Mean State
Download Data |
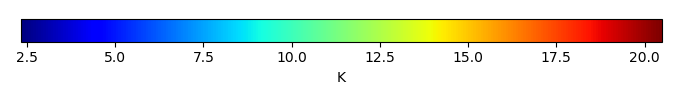
Period Mean (original grids) [K] |
Model Period Mean (intersection) [K] |
Model Period Mean (complement) [K] |
Benchmark Period Mean (intersection) [K] |
Benchmark Period Mean (complement) [K] |
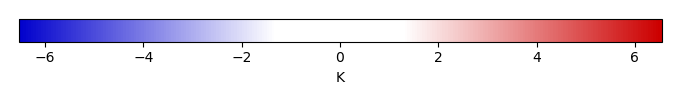
Bias [K] |
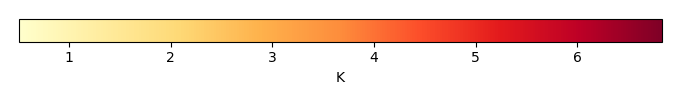
RMSE [K] |
Phase Shift [months] |
Bias Score [1] |
RMSE Score [1] |
Seasonal Cycle Score [1] |
Spatial Distribution Score [1] |
Interannual Variability Score [1] |
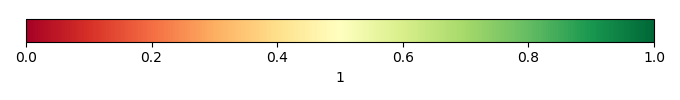
Overall Score [1] |
|||
|---|---|---|---|---|---|---|---|---|---|---|---|---|---|---|---|---|---|
| Benchmark | [-] | 10.8 | |||||||||||||||
| D104 | [-] | 11.8 | 12.0 | 7.48 | 10.9 | 9.13 | 0.671 | 1.49 | 0.546 | 0.448 | 0.550 | 0.926 | 0.898 | 0.486 | 0.643 | ||
| LMBIRCH4 | [-] | 11.9 | 12.1 | 7.61 | 10.8 | 9.18 | 0.836 | 1.62 | 0.550 | 0.400 | 0.530 | 0.928 | 0.892 | 0.498 | 0.630 | ||
| PHSParam | [-] | 11.9 | 12.0 | 7.62 | 10.8 | 9.18 | 0.827 | 1.61 | 0.526 | 0.405 | 0.531 | 0.930 | 0.892 | 0.499 | 0.631 | ||
| PPE | [-] | 11.9 | 12.1 | 7.61 | 10.8 | 9.18 | 0.830 | 1.62 | 0.549 | 0.403 | 0.528 | 0.929 | 0.889 | 0.502 | 0.630 | ||
| R15 | [-] | 11.8 | 12.0 | 7.59 | 10.8 | 9.18 | 0.766 | 1.56 | 0.540 | 0.419 | 0.537 | 0.929 | 0.893 | 0.494 | 0.635 |
Download Data |
Period Mean (original grids) [K] |
Model Period Mean (intersection) [K] |
Model Period Mean (complement) [K] |
Benchmark Period Mean (intersection) [K] |
Benchmark Period Mean (complement) [K] |
Bias [K] |
RMSE [K] |
Phase Shift [months] |
Bias Score [1] |
RMSE Score [1] |
Seasonal Cycle Score [1] |
Spatial Distribution Score [1] |
Interannual Variability Score [1] |
Overall Score [1] |
|||
|---|---|---|---|---|---|---|---|---|---|---|---|---|---|---|---|---|---|
| Benchmark | [-] | 13.8 | |||||||||||||||
| D104 | [-] | 14.5 | 14.5 | 7.68 | 13.5 | 11.8 | 0.838 | 1.38 | 0.735 | 0.689 | 0.755 | 0.921 | 0.916 | 0.808 | 0.808 | ||
| LMBIRCH4 | [-] | 14.8 | 14.7 | 7.84 | 13.8 | 11.7 | 0.793 | 1.43 | 0.585 | 0.714 | 0.732 | 0.937 | 0.939 | 0.766 | 0.803 | ||
| PHSParam | [-] | 14.7 | 14.7 | 7.82 | 13.8 | 11.7 | 0.784 | 1.43 | 0.602 | 0.714 | 0.733 | 0.935 | 0.938 | 0.765 | 0.803 | ||
| PPE | [-] | 14.8 | 14.7 | 7.87 | 13.8 | 11.7 | 0.801 | 1.43 | 0.584 | 0.711 | 0.733 | 0.937 | 0.940 | 0.765 | 0.803 | ||
| R15 | [-] | 14.7 | 14.7 | 7.81 | 13.8 | 11.7 | 0.723 | 1.39 | 0.568 | 0.727 | 0.733 | 0.940 | 0.933 | 0.762 | 0.805 |
Download Data |
Period Mean (original grids) [K] |
Model Period Mean (intersection) [K] |
Model Period Mean (complement) [K] |
Benchmark Period Mean (intersection) [K] |
Benchmark Period Mean (complement) [K] |
Bias [K] |
RMSE [K] |
Phase Shift [months] |
Bias Score [1] |
RMSE Score [1] |
Seasonal Cycle Score [1] |
Spatial Distribution Score [1] |
Interannual Variability Score [1] |
Overall Score [1] |
|||
|---|---|---|---|---|---|---|---|---|---|---|---|---|---|---|---|---|---|
| Benchmark | [-] | 12.8 | |||||||||||||||
| D104 | [-] | 13.8 | 14.0 | 8.41 | 12.9 | 8.90 | 0.546 | 1.61 | 0.538 | 0.553 | 0.653 | 0.931 | 0.937 | 0.642 | 0.728 | ||
| LMBIRCH4 | [-] | 13.8 | 14.0 | 8.49 | 12.8 | 8.86 | 0.663 | 1.64 | 0.534 | 0.524 | 0.658 | 0.933 | 0.942 | 0.676 | 0.732 | ||
| PHSParam | [-] | 13.8 | 14.0 | 8.51 | 12.8 | 8.86 | 0.649 | 1.63 | 0.549 | 0.528 | 0.659 | 0.930 | 0.943 | 0.675 | 0.732 | ||
| PPE | [-] | 13.8 | 14.0 | 8.49 | 12.8 | 8.86 | 0.659 | 1.63 | 0.549 | 0.526 | 0.659 | 0.930 | 0.943 | 0.674 | 0.732 | ||
| R15 | [-] | 13.8 | 13.9 | 8.45 | 12.8 | 8.86 | 0.602 | 1.60 | 0.540 | 0.538 | 0.663 | 0.932 | 0.942 | 0.674 | 0.735 |
Download Data |
Period Mean (original grids) [K] |
Model Period Mean (intersection) [K] |
Model Period Mean (complement) [K] |
Benchmark Period Mean (intersection) [K] |
Benchmark Period Mean (complement) [K] |
Bias [K] |
RMSE [K] |
Phase Shift [months] |
Bias Score [1] |
RMSE Score [1] |
Seasonal Cycle Score [1] |
Spatial Distribution Score [1] |
Interannual Variability Score [1] |
Overall Score [1] |
|||
|---|---|---|---|---|---|---|---|---|---|---|---|---|---|---|---|---|---|
| Benchmark | [-] | 9.39 | |||||||||||||||
| D104 | [-] | 9.48 | 9.64 | 6.75 | 9.14 | 6.92 | 0.0680 | 1.33 | 1.67 | 0.716 | 0.584 | 0.724 | 0.938 | 0.849 | 0.732 | ||
| LMBIRCH4 | [-] | 9.59 | 9.76 | 6.88 | 9.40 | 7.12 | -0.0741 | 1.35 | 1.89 | 0.747 | 0.560 | 0.675 | 0.944 | 0.829 | 0.719 | ||
| PHSParam | [-] | 9.62 | 9.79 | 6.89 | 9.40 | 7.12 | -0.0481 | 1.35 | 2.00 | 0.742 | 0.560 | 0.656 | 0.939 | 0.830 | 0.714 | ||
| PPE | [-] | 9.61 | 9.78 | 6.86 | 9.40 | 7.12 | -0.0589 | 1.37 | 1.96 | 0.743 | 0.557 | 0.665 | 0.937 | 0.832 | 0.715 | ||
| R15 | [-] | 9.67 | 9.84 | 6.94 | 9.40 | 7.12 | 0.00127 | 1.38 | 2.02 | 0.730 | 0.555 | 0.652 | 0.937 | 0.832 | 0.710 |
Download Data |
Period Mean (original grids) [K] |
Model Period Mean (intersection) [K] |
Model Period Mean (complement) [K] |
Benchmark Period Mean (intersection) [K] |
Benchmark Period Mean (complement) [K] |
Bias [K] |
RMSE [K] |
Phase Shift [months] |
Bias Score [1] |
RMSE Score [1] |
Seasonal Cycle Score [1] |
Spatial Distribution Score [1] |
Interannual Variability Score [1] |
Overall Score [1] |
|||
|---|---|---|---|---|---|---|---|---|---|---|---|---|---|---|---|---|---|
| Benchmark | [-] | 9.53 | |||||||||||||||
| D104 | [-] | 9.57 | 9.89 | 7.88 | 9.34 | 8.54 | -0.485 | 2.29 | 1.02 | 0.201 | 0.443 | 0.854 | 0.933 | 0.670 | 0.591 | ||
| LMBIRCH4 | [-] | 9.80 | 10.1 | 8.08 | 9.56 | 8.70 | -0.505 | 2.34 | 1.05 | 0.187 | 0.463 | 0.857 | 0.926 | 0.734 | 0.605 | ||
| PHSParam | [-] | 9.78 | 10.1 | 8.07 | 9.56 | 8.70 | -0.527 | 2.33 | 1.06 | 0.190 | 0.459 | 0.856 | 0.929 | 0.734 | 0.604 | ||
| PPE | [-] | 9.72 | 10.0 | 8.03 | 9.56 | 8.70 | -0.578 | 2.31 | 1.07 | 0.197 | 0.456 | 0.855 | 0.931 | 0.733 | 0.605 | ||
| R15 | [-] | 9.78 | 10.1 | 8.06 | 9.56 | 8.70 | -0.526 | 2.33 | 1.05 | 0.189 | 0.467 | 0.857 | 0.926 | 0.735 | 0.607 |
Download Data |
Period Mean (original grids) [K] |
Model Period Mean (intersection) [K] |
Model Period Mean (complement) [K] |
Benchmark Period Mean (intersection) [K] |
Benchmark Period Mean (complement) [K] |
Bias [K] |
RMSE [K] |
Phase Shift [months] |
Bias Score [1] |
RMSE Score [1] |
Seasonal Cycle Score [1] |
Spatial Distribution Score [1] |
Interannual Variability Score [1] |
Overall Score [1] |
|||
|---|---|---|---|---|---|---|---|---|---|---|---|---|---|---|---|---|---|
| Benchmark | [-] | 10.7 | |||||||||||||||
| D104 | [-] | 11.1 | 11.0 | 7.88 | 10.5 | 7.58 | 0.514 | 1.14 | 1.16 | 0.738 | 0.666 | 0.818 | 0.988 | 0.922 | 0.800 | ||
| LMBIRCH4 | [-] | 11.2 | 11.2 | 7.92 | 10.7 | 7.84 | 0.455 | 1.19 | 1.18 | 0.749 | 0.629 | 0.816 | 0.991 | 0.941 | 0.792 | ||
| PHSParam | [-] | 11.2 | 11.2 | 7.90 | 10.7 | 7.84 | 0.467 | 1.19 | 1.16 | 0.747 | 0.633 | 0.819 | 0.990 | 0.940 | 0.794 | ||
| PPE | [-] | 11.2 | 11.2 | 7.89 | 10.7 | 7.84 | 0.480 | 1.18 | 1.15 | 0.744 | 0.634 | 0.821 | 0.994 | 0.941 | 0.794 | ||
| R15 | [-] | 11.2 | 11.2 | 7.88 | 10.7 | 7.84 | 0.442 | 1.16 | 1.15 | 0.754 | 0.637 | 0.822 | 0.990 | 0.939 | 0.797 |
Download Data |
Period Mean (original grids) [K] |
Model Period Mean (intersection) [K] |
Model Period Mean (complement) [K] |
Benchmark Period Mean (intersection) [K] |
Benchmark Period Mean (complement) [K] |
Bias [K] |
RMSE [K] |
Phase Shift [months] |
Bias Score [1] |
RMSE Score [1] |
Seasonal Cycle Score [1] |
Spatial Distribution Score [1] |
Interannual Variability Score [1] |
Overall Score [1] |
|||
|---|---|---|---|---|---|---|---|---|---|---|---|---|---|---|---|---|---|
| Benchmark | [-] | 11.7 | |||||||||||||||
| D104 | [-] | 11.9 | 12.0 | 6.47 | 11.4 | 8.25 | 0.322 | 1.21 | 0.822 | 0.693 | 0.628 | 0.888 | 0.993 | 0.887 | 0.786 | ||
| LMBIRCH4 | [-] | 12.1 | 12.2 | 6.54 | 11.7 | 8.31 | 0.233 | 1.23 | 0.768 | 0.705 | 0.622 | 0.891 | 0.995 | 0.911 | 0.791 | ||
| PHSParam | [-] | 12.1 | 12.2 | 6.55 | 11.7 | 8.31 | 0.259 | 1.24 | 0.776 | 0.702 | 0.622 | 0.890 | 0.995 | 0.910 | 0.790 | ||
| PPE | [-] | 12.1 | 12.2 | 6.53 | 11.7 | 8.31 | 0.251 | 1.24 | 0.777 | 0.702 | 0.621 | 0.890 | 0.994 | 0.910 | 0.790 | ||
| R15 | [-] | 12.1 | 12.2 | 6.51 | 11.7 | 8.31 | 0.227 | 1.24 | 0.755 | 0.705 | 0.620 | 0.893 | 0.993 | 0.910 | 0.790 |
Download Data |
Period Mean (original grids) [K] |
Model Period Mean (intersection) [K] |
Model Period Mean (complement) [K] |
Benchmark Period Mean (intersection) [K] |
Benchmark Period Mean (complement) [K] |
Bias [K] |
RMSE [K] |
Phase Shift [months] |
Bias Score [1] |
RMSE Score [1] |
Seasonal Cycle Score [1] |
Spatial Distribution Score [1] |
Interannual Variability Score [1] |
Overall Score [1] |
|||
|---|---|---|---|---|---|---|---|---|---|---|---|---|---|---|---|---|---|
| Benchmark | [-] | 11.1 | |||||||||||||||
| D104 | [-] | 11.7 | 12.0 | 7.41 | 10.9 | 8.22 | 0.326 | 1.59 | 0.586 | 0.622 | 0.693 | 0.930 | 0.897 | 0.794 | 0.772 | ||
| LMBIRCH4 | [-] | 11.9 | 12.2 | 7.52 | 11.1 | 8.29 | 0.325 | 1.59 | 0.530 | 0.628 | 0.700 | 0.939 | 0.903 | 0.823 | 0.782 | ||
| PHSParam | [-] | 11.9 | 12.2 | 7.52 | 11.1 | 8.29 | 0.315 | 1.57 | 0.540 | 0.631 | 0.700 | 0.938 | 0.904 | 0.822 | 0.783 | ||
| PPE | [-] | 11.9 | 12.2 | 7.52 | 11.1 | 8.29 | 0.332 | 1.59 | 0.586 | 0.628 | 0.698 | 0.931 | 0.902 | 0.824 | 0.780 | ||
| R15 | [-] | 11.8 | 12.2 | 7.48 | 11.1 | 8.29 | 0.266 | 1.55 | 0.526 | 0.639 | 0.702 | 0.939 | 0.904 | 0.820 | 0.784 |
Download Data |
Period Mean (original grids) [K] |
Model Period Mean (intersection) [K] |
Model Period Mean (complement) [K] |
Benchmark Period Mean (intersection) [K] |
Benchmark Period Mean (complement) [K] |
Bias [K] |
RMSE [K] |
Phase Shift [months] |
Bias Score [1] |
RMSE Score [1] |
Seasonal Cycle Score [1] |
Spatial Distribution Score [1] |
Interannual Variability Score [1] |
Overall Score [1] |
|||
|---|---|---|---|---|---|---|---|---|---|---|---|---|---|---|---|---|---|
| Benchmark | [-] | 8.50 | |||||||||||||||
| D104 | [-] | 8.21 | 8.37 | 5.85 | 8.03 | 7.42 | 0.133 | 1.17 | 1.17 | 0.783 | 0.597 | 0.804 | 0.927 | 0.831 | 0.757 | ||
| LMBIRCH4 | [-] | 8.47 | 8.64 | 5.96 | 8.50 | 7.73 | -0.0733 | 1.17 | 0.660 | 0.797 | 0.594 | 0.898 | 0.940 | 0.800 | 0.770 | ||
| PHSParam | [-] | 8.48 | 8.65 | 5.96 | 8.50 | 7.73 | -0.0635 | 1.17 | 0.710 | 0.799 | 0.593 | 0.888 | 0.937 | 0.800 | 0.768 | ||
| PPE | [-] | 8.47 | 8.64 | 5.95 | 8.50 | 7.73 | -0.0698 | 1.18 | 0.663 | 0.794 | 0.593 | 0.897 | 0.934 | 0.801 | 0.769 | ||
| R15 | [-] | 8.53 | 8.70 | 6.00 | 8.50 | 7.73 | -0.0122 | 1.19 | 0.780 | 0.794 | 0.588 | 0.876 | 0.935 | 0.800 | 0.764 |
Download Data |
Period Mean (original grids) [K] |
Model Period Mean (intersection) [K] |
Model Period Mean (complement) [K] |
Benchmark Period Mean (intersection) [K] |
Benchmark Period Mean (complement) [K] |
Bias [K] |
RMSE [K] |
Phase Shift [months] |
Bias Score [1] |
RMSE Score [1] |
Seasonal Cycle Score [1] |
Spatial Distribution Score [1] |
Interannual Variability Score [1] |
Overall Score [1] |
|||
|---|---|---|---|---|---|---|---|---|---|---|---|---|---|---|---|---|---|
| Benchmark | [-] | 13.7 | |||||||||||||||
| D104 | [-] | 14.5 | 14.7 | 9.07 | 13.5 | 10.4 | 0.497 | 1.49 | 0.406 | 0.566 | 0.715 | 0.958 | 0.846 | 0.877 | 0.780 | ||
| LMBIRCH4 | [-] | 14.7 | 14.9 | 9.21 | 13.7 | 10.5 | 0.485 | 1.53 | 0.444 | 0.570 | 0.683 | 0.957 | 0.854 | 0.902 | 0.775 | ||
| PHSParam | [-] | 14.7 | 14.9 | 9.22 | 13.7 | 10.5 | 0.484 | 1.53 | 0.451 | 0.570 | 0.683 | 0.957 | 0.855 | 0.901 | 0.775 | ||
| PPE | [-] | 14.7 | 14.9 | 9.18 | 13.7 | 10.5 | 0.494 | 1.55 | 0.441 | 0.564 | 0.682 | 0.957 | 0.851 | 0.900 | 0.773 | ||
| R15 | [-] | 14.7 | 14.9 | 9.16 | 13.7 | 10.5 | 0.434 | 1.50 | 0.438 | 0.581 | 0.684 | 0.958 | 0.854 | 0.903 | 0.777 |
Download Data |
Period Mean (original grids) [K] |
Model Period Mean (intersection) [K] |
Model Period Mean (complement) [K] |
Benchmark Period Mean (intersection) [K] |
Benchmark Period Mean (complement) [K] |
Bias [K] |
RMSE [K] |
Phase Shift [months] |
Bias Score [1] |
RMSE Score [1] |
Seasonal Cycle Score [1] |
Spatial Distribution Score [1] |
Interannual Variability Score [1] |
Overall Score [1] |
|||
|---|---|---|---|---|---|---|---|---|---|---|---|---|---|---|---|---|---|
| Benchmark | [-] | 8.57 | |||||||||||||||
| D104 | [-] | 9.26 | 9.45 | 6.53 | 8.59 | 6.25 | 0.223 | 1.59 | 0.769 | 0.579 | 0.654 | 0.895 | 0.811 | 0.834 | 0.738 | ||
| LMBIRCH4 | [-] | 9.18 | 9.37 | 6.48 | 8.58 | 6.34 | 0.170 | 1.60 | 0.789 | 0.590 | 0.640 | 0.895 | 0.808 | 0.847 | 0.737 | ||
| PHSParam | [-] | 9.21 | 9.40 | 6.48 | 8.58 | 6.34 | 0.195 | 1.62 | 0.791 | 0.584 | 0.641 | 0.895 | 0.804 | 0.847 | 0.735 | ||
| PPE | [-] | 9.20 | 9.39 | 6.47 | 8.58 | 6.34 | 0.184 | 1.61 | 0.769 | 0.586 | 0.641 | 0.898 | 0.800 | 0.847 | 0.736 | ||
| R15 | [-] | 9.16 | 9.35 | 6.45 | 8.58 | 6.34 | 0.148 | 1.59 | 0.805 | 0.593 | 0.641 | 0.892 | 0.811 | 0.848 | 0.738 |
Download Data |
Period Mean (original grids) [K] |
Model Period Mean (intersection) [K] |
Model Period Mean (complement) [K] |
Benchmark Period Mean (intersection) [K] |
Benchmark Period Mean (complement) [K] |
Bias [K] |
RMSE [K] |
Phase Shift [months] |
Bias Score [1] |
RMSE Score [1] |
Seasonal Cycle Score [1] |
Spatial Distribution Score [1] |
Interannual Variability Score [1] |
Overall Score [1] |
|||
|---|---|---|---|---|---|---|---|---|---|---|---|---|---|---|---|---|---|
| Benchmark | [-] | 11.6 | |||||||||||||||
| D104 | [-] | 11.8 | 12.4 | 7.65 | 11.5 | 7.30 | 0.350 | 1.48 | 0.787 | 0.590 | 0.630 | 0.891 | 0.980 | 0.782 | 0.751 | ||
| LMBIRCH4 | [-] | 11.9 | 12.6 | 7.65 | 11.7 | 7.37 | 0.313 | 1.50 | 0.737 | 0.596 | 0.623 | 0.899 | 0.980 | 0.789 | 0.752 | ||
| PHSParam | [-] | 11.9 | 12.6 | 7.65 | 11.7 | 7.37 | 0.319 | 1.50 | 0.744 | 0.596 | 0.624 | 0.897 | 0.980 | 0.789 | 0.752 | ||
| PPE | [-] | 11.9 | 12.6 | 7.65 | 11.7 | 7.37 | 0.319 | 1.50 | 0.735 | 0.595 | 0.623 | 0.898 | 0.980 | 0.789 | 0.751 | ||
| R15 | [-] | 11.9 | 12.5 | 7.64 | 11.7 | 7.37 | 0.282 | 1.48 | 0.738 | 0.602 | 0.625 | 0.898 | 0.981 | 0.789 | 0.753 |
Download Data |
Period Mean (original grids) [K] |
Model Period Mean (intersection) [K] |
Model Period Mean (complement) [K] |
Benchmark Period Mean (intersection) [K] |
Benchmark Period Mean (complement) [K] |
Bias [K] |
RMSE [K] |
Phase Shift [months] |
Bias Score [1] |
RMSE Score [1] |
Seasonal Cycle Score [1] |
Spatial Distribution Score [1] |
Interannual Variability Score [1] |
Overall Score [1] |
|||
|---|---|---|---|---|---|---|---|---|---|---|---|---|---|---|---|---|---|
| Benchmark | [-] | 14.0 | |||||||||||||||
| D104 | [-] | 15.2 | 15.4 | 8.65 | 13.9 | 10.0 | 0.984 | 1.86 | 0.797 | 0.406 | 0.586 | 0.890 | 0.899 | 0.733 | 0.683 | ||
| LMBIRCH4 | [-] | 15.2 | 15.4 | 8.72 | 14.0 | 10.0 | 0.937 | 1.82 | 0.655 | 0.421 | 0.596 | 0.912 | 0.887 | 0.728 | 0.690 | ||
| PHSParam | [-] | 15.2 | 15.4 | 8.72 | 14.0 | 10.0 | 0.938 | 1.82 | 0.627 | 0.421 | 0.596 | 0.917 | 0.888 | 0.728 | 0.691 | ||
| PPE | [-] | 15.2 | 15.4 | 8.73 | 14.0 | 10.0 | 0.939 | 1.82 | 0.630 | 0.421 | 0.596 | 0.916 | 0.888 | 0.728 | 0.691 | ||
| R15 | [-] | 15.2 | 15.4 | 8.68 | 14.0 | 10.0 | 0.898 | 1.79 | 0.633 | 0.428 | 0.598 | 0.915 | 0.886 | 0.727 | 0.692 |
Download Data |
Period Mean (original grids) [K] |
Model Period Mean (intersection) [K] |
Model Period Mean (complement) [K] |
Benchmark Period Mean (intersection) [K] |
Benchmark Period Mean (complement) [K] |
Bias [K] |
RMSE [K] |
Phase Shift [months] |
Bias Score [1] |
RMSE Score [1] |
Seasonal Cycle Score [1] |
Spatial Distribution Score [1] |
Interannual Variability Score [1] |
Overall Score [1] |
|||
|---|---|---|---|---|---|---|---|---|---|---|---|---|---|---|---|---|---|
| Benchmark | [-] | 8.40 | |||||||||||||||
| D104 | [-] | 8.35 | 8.49 | 5.71 | 8.21 | 7.26 | -0.164 | 1.20 | 0.970 | 0.731 | 0.570 | 0.849 | 0.936 | 0.905 | 0.760 | ||
| LMBIRCH4 | [-] | 8.43 | 8.57 | 5.90 | 8.40 | 7.38 | -0.255 | 1.22 | 0.841 | 0.754 | 0.566 | 0.870 | 0.957 | 0.896 | 0.768 | ||
| PHSParam | [-] | 8.44 | 8.57 | 5.88 | 8.40 | 7.38 | -0.256 | 1.22 | 0.890 | 0.755 | 0.566 | 0.861 | 0.954 | 0.896 | 0.766 | ||
| PPE | [-] | 8.44 | 8.57 | 5.89 | 8.40 | 7.38 | -0.254 | 1.22 | 0.815 | 0.754 | 0.567 | 0.874 | 0.954 | 0.896 | 0.768 | ||
| R15 | [-] | 8.49 | 8.63 | 5.91 | 8.40 | 7.38 | -0.203 | 1.23 | 0.924 | 0.747 | 0.564 | 0.854 | 0.947 | 0.896 | 0.762 |
Download Data |
Period Mean (original grids) [K] |
Model Period Mean (intersection) [K] |
Model Period Mean (complement) [K] |
Benchmark Period Mean (intersection) [K] |
Benchmark Period Mean (complement) [K] |
Bias [K] |
RMSE [K] |
Phase Shift [months] |
Bias Score [1] |
RMSE Score [1] |
Seasonal Cycle Score [1] |
Spatial Distribution Score [1] |
Interannual Variability Score [1] |
Overall Score [1] |
|||
|---|---|---|---|---|---|---|---|---|---|---|---|---|---|---|---|---|---|
| Benchmark | [-] | 13.3 | |||||||||||||||
| D104 | [-] | 13.7 | 14.3 | 9.45 | 13.3 | 8.64 | -0.711 | 2.28 | 0.649 | 0.461 | 0.584 | 0.923 | 0.886 | 0.741 | 0.696 | ||
| LMBIRCH4 | [-] | 13.7 | 14.3 | 9.52 | 13.3 | 9.00 | -0.682 | 2.32 | 0.636 | 0.458 | 0.576 | 0.925 | 0.868 | 0.773 | 0.696 | ||
| PHSParam | [-] | 13.7 | 14.3 | 9.53 | 13.3 | 9.00 | -0.671 | 2.32 | 0.681 | 0.457 | 0.574 | 0.915 | 0.869 | 0.776 | 0.694 | ||
| PPE | [-] | 13.7 | 14.3 | 9.55 | 13.3 | 9.00 | -0.664 | 2.32 | 0.673 | 0.458 | 0.573 | 0.917 | 0.868 | 0.776 | 0.694 | ||
| R15 | [-] | 13.6 | 14.2 | 9.48 | 13.3 | 9.00 | -0.736 | 2.31 | 0.636 | 0.464 | 0.578 | 0.925 | 0.872 | 0.771 | 0.698 |
Download Data |
Period Mean (original grids) [K] |
Model Period Mean (intersection) [K] |
Model Period Mean (complement) [K] |
Benchmark Period Mean (intersection) [K] |
Benchmark Period Mean (complement) [K] |
Bias [K] |
RMSE [K] |
Phase Shift [months] |
Bias Score [1] |
RMSE Score [1] |
Seasonal Cycle Score [1] |
Spatial Distribution Score [1] |
Interannual Variability Score [1] |
Overall Score [1] |
|||
|---|---|---|---|---|---|---|---|---|---|---|---|---|---|---|---|---|---|
| Benchmark | [-] | 12.2 | |||||||||||||||
| D104 | [-] | 11.8 | 12.0 | 9.39 | 11.9 | 10.7 | -0.159 | 1.17 | 1.07 | 0.670 | 0.641 | 0.828 | 0.742 | 0.923 | 0.741 | ||
| LMBIRCH4 | [-] | 12.1 | 12.3 | 9.49 | 12.2 | 10.7 | -0.168 | 1.22 | 1.09 | 0.682 | 0.628 | 0.831 | 0.729 | 0.922 | 0.737 | ||
| PHSParam | [-] | 12.2 | 12.3 | 9.47 | 12.2 | 10.7 | -0.165 | 1.23 | 1.11 | 0.680 | 0.628 | 0.828 | 0.728 | 0.922 | 0.735 | ||
| PPE | [-] | 12.1 | 12.3 | 9.46 | 12.2 | 10.7 | -0.181 | 1.22 | 1.10 | 0.682 | 0.629 | 0.831 | 0.729 | 0.922 | 0.737 | ||
| R15 | [-] | 12.1 | 12.2 | 9.38 | 12.2 | 10.7 | -0.258 | 1.20 | 1.11 | 0.695 | 0.630 | 0.828 | 0.739 | 0.926 | 0.741 |
Download Data |
Period Mean (original grids) [K] |
Model Period Mean (intersection) [K] |
Model Period Mean (complement) [K] |
Benchmark Period Mean (intersection) [K] |
Benchmark Period Mean (complement) [K] |
Bias [K] |
RMSE [K] |
Phase Shift [months] |
Bias Score [1] |
RMSE Score [1] |
Seasonal Cycle Score [1] |
Spatial Distribution Score [1] |
Interannual Variability Score [1] |
Overall Score [1] |
|||
|---|---|---|---|---|---|---|---|---|---|---|---|---|---|---|---|---|---|
| Benchmark | [-] | 11.0 | |||||||||||||||
| D104 | [-] | 11.2 | 11.2 | 7.69 | 10.8 | 7.12 | 0.169 | 1.17 | 0.912 | 0.713 | 0.672 | 0.871 | 0.969 | 0.930 | 0.804 | ||
| LMBIRCH4 | [-] | 11.3 | 11.4 | 7.76 | 11.0 | 7.18 | 0.0776 | 1.18 | 0.813 | 0.736 | 0.660 | 0.884 | 0.974 | 0.934 | 0.808 | ||
| PHSParam | [-] | 11.3 | 11.4 | 7.74 | 11.0 | 7.18 | 0.100 | 1.18 | 0.797 | 0.733 | 0.662 | 0.886 | 0.971 | 0.934 | 0.808 | ||
| PPE | [-] | 11.3 | 11.4 | 7.71 | 11.0 | 7.18 | 0.0700 | 1.17 | 0.755 | 0.736 | 0.664 | 0.894 | 0.973 | 0.933 | 0.810 | ||
| R15 | [-] | 11.3 | 11.4 | 7.72 | 11.0 | 7.18 | 0.0668 | 1.17 | 0.769 | 0.737 | 0.662 | 0.891 | 0.974 | 0.934 | 0.810 |
Download Data |
Period Mean (original grids) [K] |
Model Period Mean (intersection) [K] |
Model Period Mean (complement) [K] |
Benchmark Period Mean (intersection) [K] |
Benchmark Period Mean (complement) [K] |
Bias [K] |
RMSE [K] |
Phase Shift [months] |
Bias Score [1] |
RMSE Score [1] |
Seasonal Cycle Score [1] |
Spatial Distribution Score [1] |
Interannual Variability Score [1] |
Overall Score [1] |
|||
|---|---|---|---|---|---|---|---|---|---|---|---|---|---|---|---|---|---|
| Benchmark | [-] | 15.3 | |||||||||||||||
| D104 | [-] | 15.0 | 15.0 | 8.19 | 15.1 | 12.1 | -0.281 | 1.37 | 0.569 | 0.723 | 0.651 | 0.932 | 0.985 | 0.916 | 0.810 | ||
| LMBIRCH4 | [-] | 15.1 | 15.2 | 8.39 | 15.3 | 12.7 | -0.358 | 1.45 | 0.549 | 0.732 | 0.635 | 0.934 | 0.981 | 0.918 | 0.806 | ||
| PHSParam | [-] | 15.2 | 15.2 | 8.38 | 15.3 | 12.7 | -0.305 | 1.42 | 0.561 | 0.735 | 0.642 | 0.931 | 0.983 | 0.919 | 0.809 | ||
| PPE | [-] | 15.2 | 15.2 | 8.37 | 15.3 | 12.7 | -0.291 | 1.43 | 0.568 | 0.732 | 0.642 | 0.929 | 0.980 | 0.918 | 0.807 | ||
| R15 | [-] | 15.1 | 15.1 | 8.35 | 15.3 | 12.7 | -0.430 | 1.46 | 0.541 | 0.727 | 0.637 | 0.934 | 0.984 | 0.922 | 0.807 |
Download Data |
Period Mean (original grids) [K] |
Model Period Mean (intersection) [K] |
Model Period Mean (complement) [K] |
Benchmark Period Mean (intersection) [K] |
Benchmark Period Mean (complement) [K] |
Bias [K] |
RMSE [K] |
Phase Shift [months] |
Bias Score [1] |
RMSE Score [1] |
Seasonal Cycle Score [1] |
Spatial Distribution Score [1] |
Interannual Variability Score [1] |
Overall Score [1] |
|||
|---|---|---|---|---|---|---|---|---|---|---|---|---|---|---|---|---|---|
| Benchmark | [-] | 10.2 | |||||||||||||||
| D104 | [-] | 10.9 | 11.0 | 7.88 | 10.1 | 8.15 | 0.783 | 1.24 | 0.513 | 0.487 | 0.623 | 0.937 | 0.980 | 0.450 | 0.683 | ||
| LMBIRCH4 | [-] | 11.0 | 11.1 | 8.17 | 10.2 | 8.53 | 0.744 | 1.21 | 0.577 | 0.481 | 0.635 | 0.929 | 0.981 | 0.462 | 0.687 | ||
| PHSParam | [-] | 11.0 | 11.1 | 8.15 | 10.2 | 8.53 | 0.736 | 1.21 | 0.550 | 0.484 | 0.634 | 0.931 | 0.979 | 0.464 | 0.688 | ||
| PPE | [-] | 11.0 | 11.1 | 8.14 | 10.2 | 8.53 | 0.713 | 1.20 | 0.550 | 0.492 | 0.632 | 0.931 | 0.979 | 0.466 | 0.689 | ||
| R15 | [-] | 11.0 | 11.1 | 8.12 | 10.2 | 8.53 | 0.707 | 1.18 | 0.567 | 0.493 | 0.638 | 0.930 | 0.982 | 0.460 | 0.690 |
Download Data |
Period Mean (original grids) [K] |
Model Period Mean (intersection) [K] |
Model Period Mean (complement) [K] |
Benchmark Period Mean (intersection) [K] |
Benchmark Period Mean (complement) [K] |
Bias [K] |
RMSE [K] |
Phase Shift [months] |
Bias Score [1] |
RMSE Score [1] |
Seasonal Cycle Score [1] |
Spatial Distribution Score [1] |
Interannual Variability Score [1] |
Overall Score [1] |
|||
|---|---|---|---|---|---|---|---|---|---|---|---|---|---|---|---|---|---|
| Benchmark | [-] | 11.7 | |||||||||||||||
| D104 | [-] | 12.3 | 12.4 | 8.49 | 11.5 | 7.37 | 0.650 | 1.22 | 0.525 | 0.568 | 0.668 | 0.933 | 0.926 | 0.647 | 0.735 | ||
| LMBIRCH4 | [-] | 12.5 | 12.6 | 8.55 | 11.7 | 7.67 | 0.650 | 1.25 | 0.497 | 0.558 | 0.651 | 0.939 | 0.910 | 0.626 | 0.722 | ||
| PHSParam | [-] | 12.5 | 12.6 | 8.57 | 11.7 | 7.67 | 0.651 | 1.25 | 0.507 | 0.559 | 0.650 | 0.935 | 0.912 | 0.626 | 0.722 | ||
| PPE | [-] | 12.5 | 12.6 | 8.60 | 11.7 | 7.67 | 0.689 | 1.28 | 0.513 | 0.549 | 0.648 | 0.935 | 0.912 | 0.621 | 0.719 | ||
| R15 | [-] | 12.4 | 12.5 | 8.52 | 11.7 | 7.67 | 0.568 | 1.19 | 0.487 | 0.583 | 0.655 | 0.941 | 0.914 | 0.623 | 0.729 |
Download Data |
Period Mean (original grids) [K] |
Model Period Mean (intersection) [K] |
Model Period Mean (complement) [K] |
Benchmark Period Mean (intersection) [K] |
Benchmark Period Mean (complement) [K] |
Bias [K] |
RMSE [K] |
Phase Shift [months] |
Bias Score [1] |
RMSE Score [1] |
Seasonal Cycle Score [1] |
Spatial Distribution Score [1] |
Interannual Variability Score [1] |
Overall Score [1] |
|||
|---|---|---|---|---|---|---|---|---|---|---|---|---|---|---|---|---|---|
| Benchmark | [-] | 12.5 | |||||||||||||||
| D104 | [-] | 13.5 | 13.6 | 9.65 | 12.4 | 7.58 | 0.263 | 1.92 | 1.09 | 0.513 | 0.569 | 0.856 | 0.932 | 0.753 | 0.698 | ||
| LMBIRCH4 | [-] | 13.6 | 13.7 | 9.78 | 12.5 | 7.60 | 0.193 | 1.88 | 0.956 | 0.534 | 0.580 | 0.875 | 0.945 | 0.739 | 0.709 | ||
| PHSParam | [-] | 13.6 | 13.7 | 9.78 | 12.5 | 7.60 | 0.186 | 1.89 | 0.997 | 0.532 | 0.578 | 0.872 | 0.940 | 0.736 | 0.706 | ||
| PPE | [-] | 13.6 | 13.7 | 9.79 | 12.5 | 7.60 | 0.194 | 1.88 | 0.943 | 0.532 | 0.580 | 0.876 | 0.943 | 0.740 | 0.709 | ||
| R15 | [-] | 13.5 | 13.6 | 9.74 | 12.5 | 7.60 | 0.131 | 1.86 | 0.951 | 0.541 | 0.580 | 0.878 | 0.943 | 0.733 | 0.709 |
Temporally integrated period mean