Mean State
Download Data |
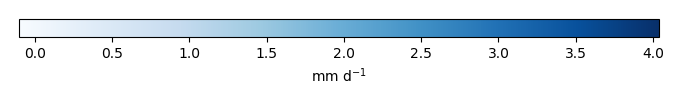
Period Mean (original grids) [mm d-1] |
Model Period Mean (intersection) [mm d-1] |
Model Period Mean (complement) [mm d-1] |
Benchmark Period Mean (intersection) [mm d-1] |
Benchmark Period Mean (complement) [mm d-1] |
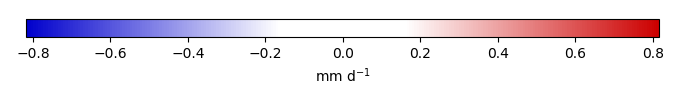
Bias [mm d-1] |
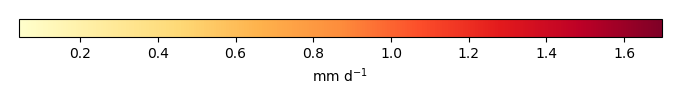
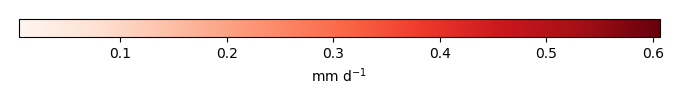
RMSE [mm d-1] |
Phase Shift [months] |
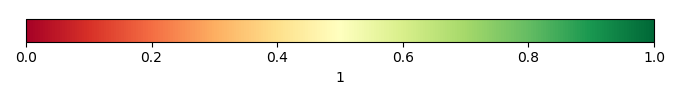
Bias Score [1] |
RMSE Score [1] |
Seasonal Cycle Score [1] |
Spatial Distribution Score [1] |
Interannual Variability Score [1] |
Overall Score [1] |
|||
|---|---|---|---|---|---|---|---|---|---|---|---|---|---|---|---|---|---|
| Benchmark | [-] | 2.07 | |||||||||||||||
| D104 | [-] | 2.51 | 2.48 | 2.50 | 2.05 | 1.30 | 0.416 | 0.811 | 2.16 | 0.440 | 0.320 | 0.631 | 0.959 | 0.655 | 0.554 | ||
| LMBIRCH4 | [-] | 2.57 | 2.53 | 2.52 | 2.07 | 1.30 | 0.446 | 0.818 | 2.21 | 0.402 | 0.310 | 0.613 | 0.959 | 0.661 | 0.543 | ||
| PHSParam | [-] | 2.57 | 2.54 | 2.54 | 2.07 | 1.30 | 0.456 | 0.827 | 2.08 | 0.394 | 0.304 | 0.629 | 0.953 | 0.688 | 0.546 | ||
| PPE | [-] | 2.58 | 2.55 | 2.55 | 2.07 | 1.30 | 0.465 | 0.837 | 2.06 | 0.388 | 0.302 | 0.631 | 0.950 | 0.678 | 0.542 | ||
| R15 | [-] | 2.48 | 2.45 | 2.48 | 2.07 | 1.30 | 0.364 | 0.770 | 2.20 | 0.460 | 0.314 | 0.616 | 0.972 | 0.659 | 0.556 |
Download Data |
Period Mean (original grids) [mm d-1] |
Model Period Mean (intersection) [mm d-1] |
Model Period Mean (complement) [mm d-1] |
Benchmark Period Mean (intersection) [mm d-1] |
Benchmark Period Mean (complement) [mm d-1] |
Bias [mm d-1] |
RMSE [mm d-1] |
Phase Shift [months] |
Bias Score [1] |
RMSE Score [1] |
Seasonal Cycle Score [1] |
Spatial Distribution Score [1] |
Interannual Variability Score [1] |
Overall Score [1] |
|||
|---|---|---|---|---|---|---|---|---|---|---|---|---|---|---|---|---|---|
| Benchmark | [-] | 1.48 | |||||||||||||||
| D104 | [-] | 1.59 | 1.61 | 1.56 | 1.45 | 1.40 | 0.152 | 0.673 | 1.76 | 0.719 | 0.467 | 0.659 | 0.966 | 0.774 | 0.675 | ||
| LMBIRCH4 | [-] | 1.57 | 1.59 | 1.57 | 1.48 | 1.39 | 0.105 | 0.690 | 1.70 | 0.702 | 0.449 | 0.680 | 0.944 | 0.779 | 0.667 | ||
| PHSParam | [-] | 1.56 | 1.58 | 1.44 | 1.48 | 1.39 | 0.0949 | 0.664 | 1.53 | 0.718 | 0.461 | 0.713 | 0.971 | 0.784 | 0.685 | ||
| PPE | [-] | 1.54 | 1.56 | 1.47 | 1.48 | 1.39 | 0.0740 | 0.679 | 1.49 | 0.699 | 0.456 | 0.721 | 0.959 | 0.766 | 0.676 | ||
| R15 | [-] | 1.57 | 1.58 | 1.55 | 1.48 | 1.39 | 0.0968 | 0.665 | 1.81 | 0.737 | 0.454 | 0.651 | 0.965 | 0.777 | 0.673 |
Download Data |
Period Mean (original grids) [mm d-1] |
Model Period Mean (intersection) [mm d-1] |
Model Period Mean (complement) [mm d-1] |
Benchmark Period Mean (intersection) [mm d-1] |
Benchmark Period Mean (complement) [mm d-1] |
Bias [mm d-1] |
RMSE [mm d-1] |
Phase Shift [months] |
Bias Score [1] |
RMSE Score [1] |
Seasonal Cycle Score [1] |
Spatial Distribution Score [1] |
Interannual Variability Score [1] |
Overall Score [1] |
|||
|---|---|---|---|---|---|---|---|---|---|---|---|---|---|---|---|---|---|
| Benchmark | [-] | 1.64 | |||||||||||||||
| D104 | [-] | 1.72 | 1.73 | 1.84 | 1.61 | 1.11 | 0.114 | 0.736 | 1.32 | 0.647 | 0.463 | 0.819 | 0.916 | 0.700 | 0.668 | ||
| LMBIRCH4 | [-] | 1.75 | 1.76 | 1.86 | 1.65 | 1.11 | 0.119 | 0.752 | 1.25 | 0.631 | 0.454 | 0.824 | 0.905 | 0.676 | 0.657 | ||
| PHSParam | [-] | 1.68 | 1.68 | 1.82 | 1.65 | 1.11 | 0.0403 | 0.699 | 1.22 | 0.662 | 0.469 | 0.836 | 0.942 | 0.681 | 0.676 | ||
| PPE | [-] | 1.66 | 1.67 | 1.77 | 1.65 | 1.11 | 0.0236 | 0.730 | 1.24 | 0.629 | 0.463 | 0.831 | 0.926 | 0.672 | 0.664 | ||
| R15 | [-] | 1.69 | 1.70 | 1.81 | 1.65 | 1.11 | 0.0561 | 0.728 | 1.26 | 0.646 | 0.460 | 0.827 | 0.931 | 0.682 | 0.668 |
Download Data |
Period Mean (original grids) [mm d-1] |
Model Period Mean (intersection) [mm d-1] |
Model Period Mean (complement) [mm d-1] |
Benchmark Period Mean (intersection) [mm d-1] |
Benchmark Period Mean (complement) [mm d-1] |
Bias [mm d-1] |
RMSE [mm d-1] |
Phase Shift [months] |
Bias Score [1] |
RMSE Score [1] |
Seasonal Cycle Score [1] |
Spatial Distribution Score [1] |
Interannual Variability Score [1] |
Overall Score [1] |
|||
|---|---|---|---|---|---|---|---|---|---|---|---|---|---|---|---|---|---|
| Benchmark | [-] | 0.536 | |||||||||||||||
| D104 | [-] | 0.549 | 0.557 | 0.451 | 0.539 | 0.375 | -0.000652 | 0.497 | 0.642 | 0.828 | 0.496 | 0.957 | 0.976 | 0.765 | 0.753 | ||
| LMBIRCH4 | [-] | 0.492 | 0.499 | 0.431 | 0.537 | 0.370 | -0.0498 | 0.453 | 0.745 | 0.831 | 0.529 | 0.950 | 0.975 | 0.778 | 0.765 | ||
| PHSParam | [-] | 0.503 | 0.510 | 0.428 | 0.537 | 0.370 | -0.0410 | 0.450 | 0.722 | 0.834 | 0.527 | 0.951 | 0.977 | 0.787 | 0.767 | ||
| PPE | [-] | 0.502 | 0.511 | 0.420 | 0.537 | 0.370 | -0.0412 | 0.475 | 0.693 | 0.824 | 0.513 | 0.954 | 0.972 | 0.742 | 0.753 | ||
| R15 | [-] | 0.541 | 0.549 | 0.451 | 0.537 | 0.370 | -0.00586 | 0.499 | 0.688 | 0.823 | 0.494 | 0.953 | 0.975 | 0.730 | 0.745 |
Download Data |
Period Mean (original grids) [mm d-1] |
Model Period Mean (intersection) [mm d-1] |
Model Period Mean (complement) [mm d-1] |
Benchmark Period Mean (intersection) [mm d-1] |
Benchmark Period Mean (complement) [mm d-1] |
Bias [mm d-1] |
RMSE [mm d-1] |
Phase Shift [months] |
Bias Score [1] |
RMSE Score [1] |
Seasonal Cycle Score [1] |
Spatial Distribution Score [1] |
Interannual Variability Score [1] |
Overall Score [1] |
|||
|---|---|---|---|---|---|---|---|---|---|---|---|---|---|---|---|---|---|
| Benchmark | [-] | 2.98 | |||||||||||||||
| D104 | [-] | 3.44 | 3.41 | 3.55 | 2.99 | 2.17 | 0.496 | 1.03 | 2.52 | 0.372 | 0.294 | 0.580 | 0.448 | 0.652 | 0.440 | ||
| LMBIRCH4 | [-] | 3.45 | 3.43 | 3.55 | 3.01 | 2.17 | 0.488 | 1.02 | 2.54 | 0.376 | 0.298 | 0.579 | 0.434 | 0.652 | 0.439 | ||
| PHSParam | [-] | 3.59 | 3.58 | 3.67 | 3.01 | 2.17 | 0.623 | 1.06 | 2.46 | 0.392 | 0.292 | 0.597 | 0.522 | 0.671 | 0.461 | ||
| PPE | [-] | 3.60 | 3.59 | 3.69 | 3.01 | 2.17 | 0.637 | 1.08 | 2.45 | 0.389 | 0.292 | 0.599 | 0.553 | 0.673 | 0.466 | ||
| R15 | [-] | 3.36 | 3.34 | 3.47 | 3.01 | 2.17 | 0.397 | 1.01 | 2.55 | 0.363 | 0.302 | 0.577 | 0.400 | 0.651 | 0.432 |
Download Data |
Period Mean (original grids) [mm d-1] |
Model Period Mean (intersection) [mm d-1] |
Model Period Mean (complement) [mm d-1] |
Benchmark Period Mean (intersection) [mm d-1] |
Benchmark Period Mean (complement) [mm d-1] |
Bias [mm d-1] |
RMSE [mm d-1] |
Phase Shift [months] |
Bias Score [1] |
RMSE Score [1] |
Seasonal Cycle Score [1] |
Spatial Distribution Score [1] |
Interannual Variability Score [1] |
Overall Score [1] |
|||
|---|---|---|---|---|---|---|---|---|---|---|---|---|---|---|---|---|---|
| Benchmark | [-] | 1.00 | |||||||||||||||
| D104 | [-] | 0.871 | 0.876 | 0.857 | 1.01 | 0.659 | -0.131 | 0.483 | 0.564 | 0.830 | 0.632 | 0.962 | 0.991 | 0.765 | 0.802 | ||
| LMBIRCH4 | [-] | 0.860 | 0.865 | 0.866 | 1.00 | 0.655 | -0.138 | 0.483 | 0.588 | 0.822 | 0.638 | 0.960 | 0.990 | 0.764 | 0.802 | ||
| PHSParam | [-] | 0.875 | 0.881 | 0.849 | 1.00 | 0.655 | -0.123 | 0.485 | 0.596 | 0.829 | 0.632 | 0.960 | 0.985 | 0.767 | 0.801 | ||
| PPE | [-] | 0.893 | 0.898 | 0.877 | 1.00 | 0.655 | -0.105 | 0.485 | 0.566 | 0.844 | 0.628 | 0.962 | 0.992 | 0.789 | 0.807 | ||
| R15 | [-] | 0.883 | 0.889 | 0.870 | 1.00 | 0.655 | -0.116 | 0.482 | 0.610 | 0.839 | 0.629 | 0.959 | 0.991 | 0.768 | 0.803 |
Download Data |
Period Mean (original grids) [mm d-1] |
Model Period Mean (intersection) [mm d-1] |
Model Period Mean (complement) [mm d-1] |
Benchmark Period Mean (intersection) [mm d-1] |
Benchmark Period Mean (complement) [mm d-1] |
Bias [mm d-1] |
RMSE [mm d-1] |
Phase Shift [months] |
Bias Score [1] |
RMSE Score [1] |
Seasonal Cycle Score [1] |
Spatial Distribution Score [1] |
Interannual Variability Score [1] |
Overall Score [1] |
|||
|---|---|---|---|---|---|---|---|---|---|---|---|---|---|---|---|---|---|
| Benchmark | [-] | 0.939 | |||||||||||||||
| D104 | [-] | 0.944 | 0.934 | 1.77 | 0.946 | 1.10 | 0.0215 | 0.498 | 0.764 | 0.752 | 0.545 | 0.937 | 0.971 | 0.710 | 0.743 | ||
| LMBIRCH4 | [-] | 0.942 | 0.933 | 1.77 | 0.939 | 1.09 | 0.0285 | 0.499 | 0.706 | 0.762 | 0.539 | 0.943 | 0.975 | 0.722 | 0.747 | ||
| PHSParam | [-] | 0.968 | 0.958 | 1.79 | 0.939 | 1.09 | 0.0528 | 0.515 | 0.738 | 0.765 | 0.530 | 0.940 | 0.977 | 0.724 | 0.744 | ||
| PPE | [-] | 0.956 | 0.946 | 1.79 | 0.939 | 1.09 | 0.0421 | 0.501 | 0.728 | 0.768 | 0.537 | 0.942 | 0.977 | 0.740 | 0.750 | ||
| R15 | [-] | 0.930 | 0.921 | 1.74 | 0.939 | 1.09 | 0.0143 | 0.495 | 0.712 | 0.747 | 0.547 | 0.942 | 0.968 | 0.722 | 0.746 |
Download Data |
Period Mean (original grids) [mm d-1] |
Model Period Mean (intersection) [mm d-1] |
Model Period Mean (complement) [mm d-1] |
Benchmark Period Mean (intersection) [mm d-1] |
Benchmark Period Mean (complement) [mm d-1] |
Bias [mm d-1] |
RMSE [mm d-1] |
Phase Shift [months] |
Bias Score [1] |
RMSE Score [1] |
Seasonal Cycle Score [1] |
Spatial Distribution Score [1] |
Interannual Variability Score [1] |
Overall Score [1] |
|||
|---|---|---|---|---|---|---|---|---|---|---|---|---|---|---|---|---|---|
| Benchmark | [-] | 1.65 | |||||||||||||||
| D104 | [-] | 2.03 | 1.97 | 2.72 | 1.65 | 1.65 | 0.461 | 0.951 | 2.51 | 0.520 | 0.320 | 0.552 | 0.973 | 0.706 | 0.565 | ||
| LMBIRCH4 | [-] | 2.02 | 1.96 | 2.72 | 1.65 | 1.62 | 0.458 | 0.945 | 2.42 | 0.521 | 0.317 | 0.577 | 0.970 | 0.707 | 0.568 | ||
| PHSParam | [-] | 1.98 | 1.92 | 2.68 | 1.65 | 1.62 | 0.420 | 0.908 | 2.26 | 0.534 | 0.334 | 0.602 | 0.971 | 0.743 | 0.586 | ||
| PPE | [-] | 1.99 | 1.93 | 2.70 | 1.65 | 1.62 | 0.433 | 0.909 | 2.20 | 0.529 | 0.337 | 0.613 | 0.968 | 0.742 | 0.588 | ||
| R15 | [-] | 1.99 | 1.93 | 2.68 | 1.65 | 1.62 | 0.426 | 0.923 | 2.37 | 0.532 | 0.323 | 0.581 | 0.973 | 0.705 | 0.573 |
Download Data |
Period Mean (original grids) [mm d-1] |
Model Period Mean (intersection) [mm d-1] |
Model Period Mean (complement) [mm d-1] |
Benchmark Period Mean (intersection) [mm d-1] |
Benchmark Period Mean (complement) [mm d-1] |
Bias [mm d-1] |
RMSE [mm d-1] |
Phase Shift [months] |
Bias Score [1] |
RMSE Score [1] |
Seasonal Cycle Score [1] |
Spatial Distribution Score [1] |
Interannual Variability Score [1] |
Overall Score [1] |
|||
|---|---|---|---|---|---|---|---|---|---|---|---|---|---|---|---|---|---|
| Benchmark | [-] | 0.539 | |||||||||||||||
| D104 | [-] | 0.578 | 0.591 | 0.394 | 0.543 | 0.252 | 0.0287 | 0.525 | 0.328 | 0.847 | 0.479 | 0.977 | 0.984 | 0.681 | 0.741 | ||
| LMBIRCH4 | [-] | 0.555 | 0.565 | 0.397 | 0.539 | 0.247 | 0.00857 | 0.499 | 0.266 | 0.848 | 0.497 | 0.981 | 0.977 | 0.727 | 0.754 | ||
| PHSParam | [-] | 0.552 | 0.564 | 0.376 | 0.539 | 0.247 | 0.00531 | 0.494 | 0.308 | 0.844 | 0.502 | 0.978 | 0.981 | 0.705 | 0.752 | ||
| PPE | [-] | 0.562 | 0.575 | 0.389 | 0.539 | 0.247 | 0.0168 | 0.511 | 0.268 | 0.864 | 0.482 | 0.981 | 0.979 | 0.675 | 0.744 | ||
| R15 | [-] | 0.596 | 0.608 | 0.406 | 0.539 | 0.247 | 0.0490 | 0.542 | 0.296 | 0.847 | 0.465 | 0.979 | 0.983 | 0.653 | 0.732 |
Download Data |
Period Mean (original grids) [mm d-1] |
Model Period Mean (intersection) [mm d-1] |
Model Period Mean (complement) [mm d-1] |
Benchmark Period Mean (intersection) [mm d-1] |
Benchmark Period Mean (complement) [mm d-1] |
Bias [mm d-1] |
RMSE [mm d-1] |
Phase Shift [months] |
Bias Score [1] |
RMSE Score [1] |
Seasonal Cycle Score [1] |
Spatial Distribution Score [1] |
Interannual Variability Score [1] |
Overall Score [1] |
|||
|---|---|---|---|---|---|---|---|---|---|---|---|---|---|---|---|---|---|
| Benchmark | [-] | 1.17 | |||||||||||||||
| D104 | [-] | 1.16 | 1.12 | 1.97 | 1.19 | 1.50 | 0.0117 | 0.515 | 0.646 | 0.737 | 0.536 | 0.929 | 0.970 | 0.769 | 0.746 | ||
| LMBIRCH4 | [-] | 1.16 | 1.12 | 2.00 | 1.17 | 1.50 | 0.0348 | 0.518 | 0.650 | 0.737 | 0.526 | 0.926 | 0.968 | 0.752 | 0.739 | ||
| PHSParam | [-] | 1.16 | 1.12 | 1.98 | 1.17 | 1.50 | 0.0381 | 0.514 | 0.685 | 0.739 | 0.527 | 0.926 | 0.974 | 0.760 | 0.742 | ||
| PPE | [-] | 1.15 | 1.11 | 1.91 | 1.17 | 1.50 | 0.0240 | 0.536 | 0.702 | 0.726 | 0.517 | 0.930 | 0.977 | 0.731 | 0.733 | ||
| R15 | [-] | 1.14 | 1.10 | 1.95 | 1.17 | 1.50 | 0.0190 | 0.511 | 0.685 | 0.738 | 0.530 | 0.923 | 0.973 | 0.764 | 0.743 |
Download Data |
Period Mean (original grids) [mm d-1] |
Model Period Mean (intersection) [mm d-1] |
Model Period Mean (complement) [mm d-1] |
Benchmark Period Mean (intersection) [mm d-1] |
Benchmark Period Mean (complement) [mm d-1] |
Bias [mm d-1] |
RMSE [mm d-1] |
Phase Shift [months] |
Bias Score [1] |
RMSE Score [1] |
Seasonal Cycle Score [1] |
Spatial Distribution Score [1] |
Interannual Variability Score [1] |
Overall Score [1] |
|||
|---|---|---|---|---|---|---|---|---|---|---|---|---|---|---|---|---|---|
| Benchmark | [-] | 1.10 | |||||||||||||||
| D104 | [-] | 1.15 | 1.16 | 1.13 | 1.10 | 0.587 | 0.0579 | 0.511 | 0.465 | 0.808 | 0.610 | 0.971 | 0.982 | 0.749 | 0.788 | ||
| LMBIRCH4 | [-] | 1.13 | 1.14 | 1.10 | 1.10 | 0.582 | 0.0418 | 0.511 | 0.468 | 0.801 | 0.610 | 0.970 | 0.983 | 0.741 | 0.786 | ||
| PHSParam | [-] | 1.17 | 1.19 | 1.14 | 1.10 | 0.582 | 0.0869 | 0.525 | 0.493 | 0.795 | 0.601 | 0.969 | 0.977 | 0.742 | 0.781 | ||
| PPE | [-] | 1.16 | 1.18 | 1.14 | 1.10 | 0.582 | 0.0771 | 0.512 | 0.510 | 0.798 | 0.612 | 0.967 | 0.976 | 0.745 | 0.785 | ||
| R15 | [-] | 1.15 | 1.16 | 1.13 | 1.10 | 0.582 | 0.0638 | 0.508 | 0.473 | 0.812 | 0.610 | 0.970 | 0.968 | 0.752 | 0.787 |
Download Data |
Period Mean (original grids) [mm d-1] |
Model Period Mean (intersection) [mm d-1] |
Model Period Mean (complement) [mm d-1] |
Benchmark Period Mean (intersection) [mm d-1] |
Benchmark Period Mean (complement) [mm d-1] |
Bias [mm d-1] |
RMSE [mm d-1] |
Phase Shift [months] |
Bias Score [1] |
RMSE Score [1] |
Seasonal Cycle Score [1] |
Spatial Distribution Score [1] |
Interannual Variability Score [1] |
Overall Score [1] |
|||
|---|---|---|---|---|---|---|---|---|---|---|---|---|---|---|---|---|---|
| Benchmark | [-] | 1.18 | |||||||||||||||
| D104 | [-] | 1.20 | 1.18 | 1.62 | 1.17 | 1.40 | 0.0576 | 0.548 | 1.17 | 0.639 | 0.457 | 0.784 | 0.970 | 0.710 | 0.670 | ||
| LMBIRCH4 | [-] | 1.21 | 1.19 | 1.63 | 1.17 | 1.39 | 0.0591 | 0.551 | 1.14 | 0.632 | 0.453 | 0.785 | 0.969 | 0.708 | 0.667 | ||
| PHSParam | [-] | 1.21 | 1.19 | 1.63 | 1.17 | 1.39 | 0.0648 | 0.545 | 1.12 | 0.649 | 0.455 | 0.794 | 0.970 | 0.723 | 0.674 | ||
| PPE | [-] | 1.21 | 1.19 | 1.63 | 1.17 | 1.39 | 0.0657 | 0.548 | 1.11 | 0.644 | 0.454 | 0.796 | 0.969 | 0.722 | 0.673 | ||
| R15 | [-] | 1.19 | 1.17 | 1.60 | 1.17 | 1.39 | 0.0392 | 0.546 | 1.15 | 0.633 | 0.457 | 0.783 | 0.973 | 0.709 | 0.669 |
Download Data |
Period Mean (original grids) [mm d-1] |
Model Period Mean (intersection) [mm d-1] |
Model Period Mean (complement) [mm d-1] |
Benchmark Period Mean (intersection) [mm d-1] |
Benchmark Period Mean (complement) [mm d-1] |
Bias [mm d-1] |
RMSE [mm d-1] |
Phase Shift [months] |
Bias Score [1] |
RMSE Score [1] |
Seasonal Cycle Score [1] |
Spatial Distribution Score [1] |
Interannual Variability Score [1] |
Overall Score [1] |
|||
|---|---|---|---|---|---|---|---|---|---|---|---|---|---|---|---|---|---|
| Benchmark | [-] | 0.283 | |||||||||||||||
| D104 | [-] | 0.327 | 0.306 | 0.606 | 0.278 | 0.769 | 0.0439 | 0.310 | 1.18 | 0.585 | 0.372 | 0.861 | 0.915 | 0.683 | 0.632 | ||
| LMBIRCH4 | [-] | 0.325 | 0.304 | 0.608 | 0.283 | 0.767 | 0.0362 | 0.321 | 1.14 | 0.593 | 0.365 | 0.867 | 0.913 | 0.687 | 0.631 | ||
| PHSParam | [-] | 0.333 | 0.312 | 0.624 | 0.283 | 0.767 | 0.0451 | 0.330 | 1.16 | 0.581 | 0.359 | 0.864 | 0.904 | 0.679 | 0.624 | ||
| PPE | [-] | 0.333 | 0.312 | 0.623 | 0.283 | 0.767 | 0.0445 | 0.328 | 1.16 | 0.582 | 0.361 | 0.863 | 0.905 | 0.676 | 0.625 | ||
| R15 | [-] | 0.321 | 0.300 | 0.597 | 0.283 | 0.767 | 0.0320 | 0.312 | 1.16 | 0.598 | 0.378 | 0.864 | 0.915 | 0.713 | 0.641 |
Download Data |
Period Mean (original grids) [mm d-1] |
Model Period Mean (intersection) [mm d-1] |
Model Period Mean (complement) [mm d-1] |
Benchmark Period Mean (intersection) [mm d-1] |
Benchmark Period Mean (complement) [mm d-1] |
Bias [mm d-1] |
RMSE [mm d-1] |
Phase Shift [months] |
Bias Score [1] |
RMSE Score [1] |
Seasonal Cycle Score [1] |
Spatial Distribution Score [1] |
Interannual Variability Score [1] |
Overall Score [1] |
|||
|---|---|---|---|---|---|---|---|---|---|---|---|---|---|---|---|---|---|
| Benchmark | [-] | 0.532 | |||||||||||||||
| D104 | [-] | 0.558 | 0.567 | 0.366 | 0.532 | 0.358 | 0.00498 | 0.498 | 0.374 | 0.800 | 0.492 | 0.973 | 0.958 | 0.720 | 0.739 | ||
| LMBIRCH4 | [-] | 0.555 | 0.562 | 0.378 | 0.533 | 0.354 | 0.00298 | 0.477 | 0.341 | 0.816 | 0.499 | 0.976 | 0.957 | 0.731 | 0.746 | ||
| PHSParam | [-] | 0.544 | 0.552 | 0.362 | 0.533 | 0.354 | -0.00882 | 0.479 | 0.395 | 0.803 | 0.500 | 0.971 | 0.962 | 0.717 | 0.742 | ||
| PPE | [-] | 0.551 | 0.559 | 0.374 | 0.533 | 0.354 | -0.000603 | 0.474 | 0.321 | 0.815 | 0.501 | 0.978 | 0.959 | 0.734 | 0.748 | ||
| R15 | [-] | 0.573 | 0.583 | 0.375 | 0.533 | 0.354 | 0.0188 | 0.503 | 0.371 | 0.793 | 0.486 | 0.973 | 0.952 | 0.725 | 0.736 |
Download Data |
Period Mean (original grids) [mm d-1] |
Model Period Mean (intersection) [mm d-1] |
Model Period Mean (complement) [mm d-1] |
Benchmark Period Mean (intersection) [mm d-1] |
Benchmark Period Mean (complement) [mm d-1] |
Bias [mm d-1] |
RMSE [mm d-1] |
Phase Shift [months] |
Bias Score [1] |
RMSE Score [1] |
Seasonal Cycle Score [1] |
Spatial Distribution Score [1] |
Interannual Variability Score [1] |
Overall Score [1] |
|||
|---|---|---|---|---|---|---|---|---|---|---|---|---|---|---|---|---|---|
| Benchmark | [-] | 1.80 | |||||||||||||||
| D104 | [-] | 2.02 | 1.96 | 2.50 | 1.78 | 2.11 | 0.350 | 0.992 | 1.42 | 0.560 | 0.398 | 0.779 | 0.881 | 0.630 | 0.608 | ||
| LMBIRCH4 | [-] | 2.05 | 1.99 | 2.51 | 1.80 | 2.12 | 0.357 | 0.998 | 1.33 | 0.556 | 0.404 | 0.799 | 0.863 | 0.640 | 0.611 | ||
| PHSParam | [-] | 2.03 | 1.97 | 2.48 | 1.80 | 2.12 | 0.339 | 0.984 | 1.26 | 0.559 | 0.411 | 0.812 | 0.862 | 0.653 | 0.618 | ||
| PPE | [-] | 2.04 | 1.98 | 2.50 | 1.80 | 2.12 | 0.347 | 0.996 | 1.21 | 0.557 | 0.407 | 0.824 | 0.859 | 0.652 | 0.618 | ||
| R15 | [-] | 2.01 | 1.95 | 2.47 | 1.80 | 2.12 | 0.315 | 0.986 | 1.37 | 0.560 | 0.403 | 0.788 | 0.874 | 0.617 | 0.607 |
Download Data |
Period Mean (original grids) [mm d-1] |
Model Period Mean (intersection) [mm d-1] |
Model Period Mean (complement) [mm d-1] |
Benchmark Period Mean (intersection) [mm d-1] |
Benchmark Period Mean (complement) [mm d-1] |
Bias [mm d-1] |
RMSE [mm d-1] |
Phase Shift [months] |
Bias Score [1] |
RMSE Score [1] |
Seasonal Cycle Score [1] |
Spatial Distribution Score [1] |
Interannual Variability Score [1] |
Overall Score [1] |
|||
|---|---|---|---|---|---|---|---|---|---|---|---|---|---|---|---|---|---|
| Benchmark | [-] | 1.98 | |||||||||||||||
| D104 | [-] | 1.79 | 1.77 | 1.99 | 1.99 | 1.94 | -0.176 | 0.683 | 0.588 | 0.738 | 0.618 | 0.950 | 0.911 | 0.757 | 0.765 | ||
| LMBIRCH4 | [-] | 1.83 | 1.80 | 2.04 | 1.98 | 1.92 | -0.135 | 0.658 | 0.497 | 0.765 | 0.623 | 0.961 | 0.955 | 0.761 | 0.781 | ||
| PHSParam | [-] | 1.86 | 1.83 | 2.07 | 1.98 | 1.92 | -0.104 | 0.638 | 0.506 | 0.781 | 0.625 | 0.958 | 0.971 | 0.776 | 0.790 | ||
| PPE | [-] | 1.85 | 1.83 | 2.07 | 1.98 | 1.92 | -0.107 | 0.620 | 0.489 | 0.783 | 0.634 | 0.959 | 0.979 | 0.782 | 0.795 | ||
| R15 | [-] | 1.74 | 1.72 | 1.96 | 1.98 | 1.92 | -0.220 | 0.688 | 0.473 | 0.715 | 0.630 | 0.963 | 0.878 | 0.751 | 0.761 |
Download Data |
Period Mean (original grids) [mm d-1] |
Model Period Mean (intersection) [mm d-1] |
Model Period Mean (complement) [mm d-1] |
Benchmark Period Mean (intersection) [mm d-1] |
Benchmark Period Mean (complement) [mm d-1] |
Bias [mm d-1] |
RMSE [mm d-1] |
Phase Shift [months] |
Bias Score [1] |
RMSE Score [1] |
Seasonal Cycle Score [1] |
Spatial Distribution Score [1] |
Interannual Variability Score [1] |
Overall Score [1] |
|||
|---|---|---|---|---|---|---|---|---|---|---|---|---|---|---|---|---|---|
| Benchmark | [-] | 1.20 | |||||||||||||||
| D104 | [-] | 1.06 | 1.06 | 1.12 | 1.19 | 1.12 | -0.132 | 0.635 | 0.554 | 0.731 | 0.580 | 0.962 | 0.692 | 0.670 | 0.703 | ||
| LMBIRCH4 | [-] | 1.07 | 1.06 | 1.15 | 1.20 | 1.12 | -0.135 | 0.622 | 0.543 | 0.735 | 0.585 | 0.963 | 0.743 | 0.670 | 0.714 | ||
| PHSParam | [-] | 1.09 | 1.09 | 1.15 | 1.20 | 1.12 | -0.110 | 0.623 | 0.567 | 0.746 | 0.580 | 0.961 | 0.775 | 0.673 | 0.719 | ||
| PPE | [-] | 1.10 | 1.10 | 1.18 | 1.20 | 1.12 | -0.0997 | 0.616 | 0.518 | 0.749 | 0.581 | 0.964 | 0.798 | 0.684 | 0.726 | ||
| R15 | [-] | 1.08 | 1.07 | 1.14 | 1.20 | 1.12 | -0.130 | 0.626 | 0.552 | 0.732 | 0.584 | 0.962 | 0.702 | 0.668 | 0.705 |
Download Data |
Period Mean (original grids) [mm d-1] |
Model Period Mean (intersection) [mm d-1] |
Model Period Mean (complement) [mm d-1] |
Benchmark Period Mean (intersection) [mm d-1] |
Benchmark Period Mean (complement) [mm d-1] |
Bias [mm d-1] |
RMSE [mm d-1] |
Phase Shift [months] |
Bias Score [1] |
RMSE Score [1] |
Seasonal Cycle Score [1] |
Spatial Distribution Score [1] |
Interannual Variability Score [1] |
Overall Score [1] |
|||
|---|---|---|---|---|---|---|---|---|---|---|---|---|---|---|---|---|---|
| Benchmark | [-] | 1.11 | |||||||||||||||
| D104 | [-] | 0.928 | 0.923 | 1.16 | 1.10 | 1.04 | -0.171 | 0.579 | 0.675 | 0.692 | 0.514 | 0.946 | 0.875 | 0.740 | 0.713 | ||
| LMBIRCH4 | [-] | 0.945 | 0.941 | 1.20 | 1.11 | 1.04 | -0.156 | 0.583 | 0.636 | 0.701 | 0.509 | 0.947 | 0.881 | 0.752 | 0.716 | ||
| PHSParam | [-] | 0.992 | 0.987 | 1.26 | 1.11 | 1.04 | -0.109 | 0.581 | 0.625 | 0.717 | 0.499 | 0.952 | 0.917 | 0.741 | 0.721 | ||
| PPE | [-] | 0.993 | 0.989 | 1.29 | 1.11 | 1.04 | -0.106 | 0.567 | 0.612 | 0.721 | 0.508 | 0.951 | 0.931 | 0.755 | 0.729 | ||
| R15 | [-] | 0.931 | 0.927 | 1.17 | 1.11 | 1.04 | -0.171 | 0.576 | 0.683 | 0.694 | 0.516 | 0.945 | 0.877 | 0.755 | 0.717 |
Download Data |
Period Mean (original grids) [mm d-1] |
Model Period Mean (intersection) [mm d-1] |
Model Period Mean (complement) [mm d-1] |
Benchmark Period Mean (intersection) [mm d-1] |
Benchmark Period Mean (complement) [mm d-1] |
Bias [mm d-1] |
RMSE [mm d-1] |
Phase Shift [months] |
Bias Score [1] |
RMSE Score [1] |
Seasonal Cycle Score [1] |
Spatial Distribution Score [1] |
Interannual Variability Score [1] |
Overall Score [1] |
|||
|---|---|---|---|---|---|---|---|---|---|---|---|---|---|---|---|---|---|
| Benchmark | [-] | 3.25 | |||||||||||||||
| D104 | [-] | 3.28 | 3.27 | 3.06 | 3.22 | 1.88 | 0.0374 | 0.720 | 2.66 | 0.508 | 0.351 | 0.537 | 0.790 | 0.706 | 0.541 | ||
| LMBIRCH4 | [-] | 3.30 | 3.29 | 3.07 | 3.25 | 1.88 | 0.0280 | 0.743 | 2.73 | 0.490 | 0.353 | 0.522 | 0.759 | 0.707 | 0.531 | ||
| PHSParam | [-] | 3.35 | 3.34 | 3.04 | 3.25 | 1.88 | 0.0754 | 0.698 | 2.65 | 0.562 | 0.355 | 0.540 | 0.877 | 0.761 | 0.575 | ||
| PPE | [-] | 3.37 | 3.37 | 3.07 | 3.25 | 1.88 | 0.0992 | 0.715 | 2.65 | 0.561 | 0.346 | 0.540 | 0.870 | 0.764 | 0.571 | ||
| R15 | [-] | 3.21 | 3.21 | 3.01 | 3.25 | 1.88 | -0.0580 | 0.752 | 2.76 | 0.464 | 0.354 | 0.517 | 0.749 | 0.703 | 0.524 |
Download Data |
Period Mean (original grids) [mm d-1] |
Model Period Mean (intersection) [mm d-1] |
Model Period Mean (complement) [mm d-1] |
Benchmark Period Mean (intersection) [mm d-1] |
Benchmark Period Mean (complement) [mm d-1] |
Bias [mm d-1] |
RMSE [mm d-1] |
Phase Shift [months] |
Bias Score [1] |
RMSE Score [1] |
Seasonal Cycle Score [1] |
Spatial Distribution Score [1] |
Interannual Variability Score [1] |
Overall Score [1] |
|||
|---|---|---|---|---|---|---|---|---|---|---|---|---|---|---|---|---|---|
| Benchmark | [-] | 2.24 | |||||||||||||||
| D104 | [-] | 2.31 | 2.30 | 2.42 | 2.25 | 1.44 | 0.0556 | 0.648 | 1.08 | 0.747 | 0.519 | 0.881 | 0.945 | 0.743 | 0.726 | ||
| LMBIRCH4 | [-] | 2.37 | 2.36 | 2.46 | 2.25 | 1.44 | 0.114 | 0.681 | 1.06 | 0.717 | 0.503 | 0.888 | 0.928 | 0.706 | 0.708 | ||
| PHSParam | [-] | 2.33 | 2.31 | 2.42 | 2.25 | 1.44 | 0.0677 | 0.656 | 1.02 | 0.727 | 0.516 | 0.897 | 0.944 | 0.714 | 0.719 | ||
| PPE | [-] | 2.32 | 2.31 | 2.43 | 2.25 | 1.44 | 0.0710 | 0.666 | 1.03 | 0.708 | 0.515 | 0.895 | 0.929 | 0.705 | 0.711 | ||
| R15 | [-] | 2.30 | 2.29 | 2.39 | 2.25 | 1.44 | 0.0465 | 0.654 | 1.00 | 0.741 | 0.514 | 0.892 | 0.947 | 0.733 | 0.723 |
Download Data |
Period Mean (original grids) [mm d-1] |
Model Period Mean (intersection) [mm d-1] |
Model Period Mean (complement) [mm d-1] |
Benchmark Period Mean (intersection) [mm d-1] |
Benchmark Period Mean (complement) [mm d-1] |
Bias [mm d-1] |
RMSE [mm d-1] |
Phase Shift [months] |
Bias Score [1] |
RMSE Score [1] |
Seasonal Cycle Score [1] |
Spatial Distribution Score [1] |
Interannual Variability Score [1] |
Overall Score [1] |
|||
|---|---|---|---|---|---|---|---|---|---|---|---|---|---|---|---|---|---|
| Benchmark | [-] | 0.909 | |||||||||||||||
| D104 | [-] | 1.01 | 1.01 | 0.734 | 0.898 | 1.11 | 0.0797 | 0.654 | 1.03 | 0.580 | 0.452 | 0.878 | 0.903 | 0.670 | 0.656 | ||
| LMBIRCH4 | [-] | 1.04 | 1.04 | 0.756 | 0.906 | 1.11 | 0.101 | 0.667 | 0.953 | 0.583 | 0.443 | 0.895 | 0.904 | 0.678 | 0.658 | ||
| PHSParam | [-] | 1.04 | 1.04 | 0.700 | 0.906 | 1.11 | 0.0969 | 0.688 | 1.00 | 0.573 | 0.435 | 0.888 | 0.901 | 0.663 | 0.649 | ||
| PPE | [-] | 1.05 | 1.06 | 0.729 | 0.906 | 1.11 | 0.116 | 0.692 | 0.963 | 0.573 | 0.433 | 0.892 | 0.899 | 0.670 | 0.650 | ||
| R15 | [-] | 1.00 | 1.00 | 0.735 | 0.906 | 1.11 | 0.0664 | 0.650 | 1.02 | 0.582 | 0.451 | 0.884 | 0.915 | 0.670 | 0.659 |
Temporally integrated period mean