Mean State
Download Data |
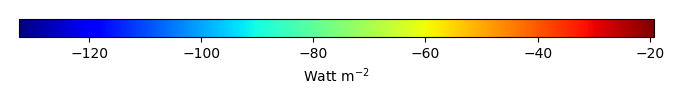
Period Mean (original grids) [Watt m-2] |
Model Period Mean (intersection) [Watt m-2] |
Model Period Mean (complement) [Watt m-2] |
Benchmark Period Mean (intersection) [Watt m-2] |
Benchmark Period Mean (complement) [Watt m-2] |
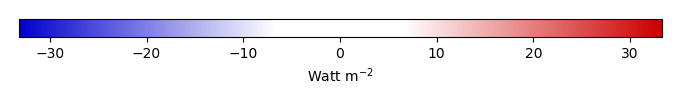
Bias [Watt m-2] |
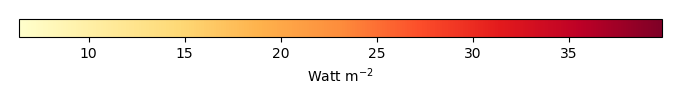
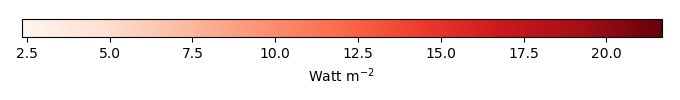
RMSE [Watt m-2] |
Phase Shift [months] |
Bias Score [1] |
RMSE Score [1] |
Seasonal Cycle Score [1] |
Spatial Distribution Score [1] |
Interannual Variability Score [1] |
Overall Score [1] |
|||
|---|---|---|---|---|---|---|---|---|---|---|---|---|---|---|---|---|---|
| Benchmark | [-] | -56.8 | |||||||||||||||
| D104 | [-] | -66.6 | -66.9 | -56.3 | -55.7 | -10.0 | 16.9 | 1.72 | 0.402 | 0.448 | 0.755 | 0.965 | 0.798 | 0.636 | |||
| LMBIRCH4 | [-] | -65.5 | -66.0 | -56.8 | -55.8 | -8.80 | 16.2 | 1.75 | 0.453 | 0.453 | 0.750 | 0.972 | 0.819 | 0.650 | |||
| PHSParam | [-] | -65.8 | -66.2 | -56.8 | -55.8 | -8.94 | 16.3 | 1.70 | 0.448 | 0.454 | 0.758 | 0.970 | 0.824 | 0.651 | |||
| PPE | [-] | -64.7 | -65.1 | -56.8 | -55.8 | -7.95 | 15.7 | 1.70 | 0.474 | 0.453 | 0.758 | 0.969 | 0.822 | 0.655 | |||
| R15 | [-] | -66.9 | -67.3 | -56.8 | -55.8 | -9.94 | 17.0 | 1.73 | 0.427 | 0.453 | 0.750 | 0.970 | 0.821 | 0.646 |
Download Data |
Period Mean (original grids) [Watt m-2] |
Model Period Mean (intersection) [Watt m-2] |
Model Period Mean (complement) [Watt m-2] |
Benchmark Period Mean (intersection) [Watt m-2] |
Benchmark Period Mean (complement) [Watt m-2] |
Bias [Watt m-2] |
RMSE [Watt m-2] |
Phase Shift [months] |
Bias Score [1] |
RMSE Score [1] |
Seasonal Cycle Score [1] |
Spatial Distribution Score [1] |
Interannual Variability Score [1] |
Overall Score [1] |
|||
|---|---|---|---|---|---|---|---|---|---|---|---|---|---|---|---|---|---|
| Benchmark | [-] | -87.0 | |||||||||||||||
| D104 | [-] | -98.6 | -98.0 | -87.1 | -54.5 | -10.4 | 22.4 | 0.253 | 0.666 | 0.589 | 0.976 | 0.819 | 0.719 | 0.726 | |||
| LMBIRCH4 | [-] | -98.3 | -97.6 | -87.1 | -55.1 | -10.1 | 22.3 | 0.273 | 0.677 | 0.581 | 0.976 | 0.874 | 0.717 | 0.734 | |||
| PHSParam | [-] | -98.4 | -97.7 | -87.1 | -55.1 | -10.2 | 22.5 | 0.251 | 0.674 | 0.577 | 0.978 | 0.850 | 0.715 | 0.729 | |||
| PPE | [-] | -98.0 | -97.3 | -87.1 | -55.1 | -9.85 | 22.4 | 0.257 | 0.679 | 0.576 | 0.977 | 0.886 | 0.714 | 0.735 | |||
| R15 | [-] | -98.8 | -98.2 | -87.1 | -55.1 | -10.8 | 22.5 | 0.273 | 0.666 | 0.584 | 0.976 | 0.833 | 0.719 | 0.727 |
Download Data |
Period Mean (original grids) [Watt m-2] |
Model Period Mean (intersection) [Watt m-2] |
Model Period Mean (complement) [Watt m-2] |
Benchmark Period Mean (intersection) [Watt m-2] |
Benchmark Period Mean (complement) [Watt m-2] |
Bias [Watt m-2] |
RMSE [Watt m-2] |
Phase Shift [months] |
Bias Score [1] |
RMSE Score [1] |
Seasonal Cycle Score [1] |
Spatial Distribution Score [1] |
Interannual Variability Score [1] |
Overall Score [1] |
|||
|---|---|---|---|---|---|---|---|---|---|---|---|---|---|---|---|---|---|
| Benchmark | [-] | -81.4 | |||||||||||||||
| D104 | [-] | -91.6 | -91.5 | -82.2 | -61.3 | -6.98 | 20.1 | 0.843 | 0.614 | 0.501 | 0.893 | 0.964 | 0.692 | 0.694 | |||
| LMBIRCH4 | [-] | -90.8 | -90.6 | -82.0 | -61.4 | -6.31 | 19.6 | 0.898 | 0.626 | 0.496 | 0.890 | 0.973 | 0.702 | 0.697 | |||
| PHSParam | [-] | -91.4 | -91.3 | -82.0 | -61.4 | -6.95 | 19.8 | 0.823 | 0.614 | 0.499 | 0.900 | 0.968 | 0.705 | 0.697 | |||
| PPE | [-] | -90.7 | -90.5 | -82.0 | -61.4 | -6.28 | 19.9 | 0.867 | 0.617 | 0.498 | 0.894 | 0.959 | 0.703 | 0.695 | |||
| R15 | [-] | -92.0 | -91.8 | -82.0 | -61.4 | -7.48 | 20.1 | 0.865 | 0.604 | 0.499 | 0.894 | 0.971 | 0.705 | 0.695 |
Download Data |
Period Mean (original grids) [Watt m-2] |
Model Period Mean (intersection) [Watt m-2] |
Model Period Mean (complement) [Watt m-2] |
Benchmark Period Mean (intersection) [Watt m-2] |
Benchmark Period Mean (complement) [Watt m-2] |
Bias [Watt m-2] |
RMSE [Watt m-2] |
Phase Shift [months] |
Bias Score [1] |
RMSE Score [1] |
Seasonal Cycle Score [1] |
Spatial Distribution Score [1] |
Interannual Variability Score [1] |
Overall Score [1] |
|||
|---|---|---|---|---|---|---|---|---|---|---|---|---|---|---|---|---|---|
| Benchmark | [-] | -37.2 | |||||||||||||||
| D104 | [-] | -39.4 | -39.5 | -37.0 | -39.5 | -3.67 | 16.4 | 1.11 | 0.714 | 0.407 | 0.850 | 0.977 | 0.880 | 0.706 | |||
| LMBIRCH4 | [-] | -39.7 | -39.9 | -37.1 | -39.3 | -3.86 | 16.4 | 1.16 | 0.706 | 0.405 | 0.851 | 0.987 | 0.883 | 0.706 | |||
| PHSParam | [-] | -39.6 | -39.7 | -37.1 | -39.3 | -3.75 | 16.4 | 1.16 | 0.706 | 0.406 | 0.853 | 0.985 | 0.882 | 0.706 | |||
| PPE | [-] | -39.1 | -39.2 | -37.1 | -39.3 | -3.23 | 16.3 | 1.16 | 0.714 | 0.405 | 0.851 | 0.984 | 0.885 | 0.707 | |||
| R15 | [-] | -39.4 | -39.5 | -37.1 | -39.3 | -3.57 | 16.4 | 1.15 | 0.707 | 0.404 | 0.854 | 0.981 | 0.881 | 0.705 |
Download Data |
Period Mean (original grids) [Watt m-2] |
Model Period Mean (intersection) [Watt m-2] |
Model Period Mean (complement) [Watt m-2] |
Benchmark Period Mean (intersection) [Watt m-2] |
Benchmark Period Mean (complement) [Watt m-2] |
Bias [Watt m-2] |
RMSE [Watt m-2] |
Phase Shift [months] |
Bias Score [1] |
RMSE Score [1] |
Seasonal Cycle Score [1] |
Spatial Distribution Score [1] |
Interannual Variability Score [1] |
Overall Score [1] |
|||
|---|---|---|---|---|---|---|---|---|---|---|---|---|---|---|---|---|---|
| Benchmark | [-] | -44.6 | |||||||||||||||
| D104 | [-] | -49.2 | -49.1 | -44.1 | -49.2 | -4.13 | 9.69 | 2.01 | 0.377 | 0.345 | 0.694 | 0.979 | 0.773 | 0.585 | |||
| LMBIRCH4 | [-] | -49.3 | -49.2 | -44.1 | -49.1 | -4.24 | 9.72 | 1.94 | 0.374 | 0.345 | 0.707 | 0.979 | 0.780 | 0.588 | |||
| PHSParam | [-] | -49.0 | -48.9 | -44.1 | -49.1 | -3.99 | 9.70 | 1.97 | 0.373 | 0.343 | 0.700 | 0.975 | 0.780 | 0.586 | |||
| PPE | [-] | -48.4 | -48.3 | -44.1 | -49.1 | -3.46 | 9.57 | 1.96 | 0.378 | 0.343 | 0.701 | 0.973 | 0.781 | 0.587 | |||
| R15 | [-] | -49.7 | -49.6 | -44.1 | -49.1 | -4.60 | 9.83 | 1.86 | 0.371 | 0.345 | 0.723 | 0.981 | 0.779 | 0.591 |
Download Data |
Period Mean (original grids) [Watt m-2] |
Model Period Mean (intersection) [Watt m-2] |
Model Period Mean (complement) [Watt m-2] |
Benchmark Period Mean (intersection) [Watt m-2] |
Benchmark Period Mean (complement) [Watt m-2] |
Bias [Watt m-2] |
RMSE [Watt m-2] |
Phase Shift [months] |
Bias Score [1] |
RMSE Score [1] |
Seasonal Cycle Score [1] |
Spatial Distribution Score [1] |
Interannual Variability Score [1] |
Overall Score [1] |
|||
|---|---|---|---|---|---|---|---|---|---|---|---|---|---|---|---|---|---|
| Benchmark | [-] | -42.1 | |||||||||||||||
| D104 | [-] | -52.6 | -52.4 | -42.1 | -45.4 | -10.3 | 15.9 | 0.724 | 0.536 | 0.492 | 0.916 | 0.989 | 0.876 | 0.717 | |||
| LMBIRCH4 | [-] | -52.3 | -52.1 | -42.0 | -45.4 | -10.0 | 15.8 | 0.714 | 0.542 | 0.485 | 0.916 | 0.993 | 0.892 | 0.719 | |||
| PHSParam | [-] | -52.3 | -52.1 | -42.0 | -45.4 | -10.1 | 15.8 | 0.729 | 0.539 | 0.484 | 0.915 | 0.991 | 0.893 | 0.717 | |||
| PPE | [-] | -51.6 | -51.4 | -42.0 | -45.4 | -9.35 | 15.6 | 0.711 | 0.565 | 0.480 | 0.916 | 0.994 | 0.894 | 0.721 | |||
| R15 | [-] | -52.3 | -52.1 | -42.0 | -45.4 | -10.1 | 15.8 | 0.733 | 0.539 | 0.484 | 0.914 | 0.993 | 0.892 | 0.718 |
Download Data |
Period Mean (original grids) [Watt m-2] |
Model Period Mean (intersection) [Watt m-2] |
Model Period Mean (complement) [Watt m-2] |
Benchmark Period Mean (intersection) [Watt m-2] |
Benchmark Period Mean (complement) [Watt m-2] |
Bias [Watt m-2] |
RMSE [Watt m-2] |
Phase Shift [months] |
Bias Score [1] |
RMSE Score [1] |
Seasonal Cycle Score [1] |
Spatial Distribution Score [1] |
Interannual Variability Score [1] |
Overall Score [1] |
|||
|---|---|---|---|---|---|---|---|---|---|---|---|---|---|---|---|---|---|
| Benchmark | [-] | -67.1 | |||||||||||||||
| D104 | [-] | -72.8 | -72.8 | -67.3 | -59.0 | -4.49 | 16.4 | 1.05 | 0.671 | 0.498 | 0.853 | 0.991 | 0.809 | 0.720 | |||
| LMBIRCH4 | [-] | -72.6 | -72.7 | -67.1 | -58.9 | -4.51 | 16.5 | 0.997 | 0.673 | 0.495 | 0.857 | 0.992 | 0.811 | 0.720 | |||
| PHSParam | [-] | -72.4 | -72.4 | -67.1 | -58.9 | -4.28 | 16.5 | 1.02 | 0.678 | 0.493 | 0.854 | 0.992 | 0.811 | 0.720 | |||
| PPE | [-] | -72.3 | -72.3 | -67.1 | -58.9 | -4.14 | 16.5 | 1.01 | 0.681 | 0.493 | 0.855 | 0.992 | 0.810 | 0.721 | |||
| R15 | [-] | -72.5 | -72.6 | -67.1 | -58.9 | -4.43 | 16.5 | 1.03 | 0.673 | 0.494 | 0.852 | 0.989 | 0.809 | 0.718 |
Download Data |
Period Mean (original grids) [Watt m-2] |
Model Period Mean (intersection) [Watt m-2] |
Model Period Mean (complement) [Watt m-2] |
Benchmark Period Mean (intersection) [Watt m-2] |
Benchmark Period Mean (complement) [Watt m-2] |
Bias [Watt m-2] |
RMSE [Watt m-2] |
Phase Shift [months] |
Bias Score [1] |
RMSE Score [1] |
Seasonal Cycle Score [1] |
Spatial Distribution Score [1] |
Interannual Variability Score [1] |
Overall Score [1] |
|||
|---|---|---|---|---|---|---|---|---|---|---|---|---|---|---|---|---|---|
| Benchmark | [-] | -71.2 | |||||||||||||||
| D104 | [-] | -79.5 | -80.3 | -70.4 | -56.3 | -5.63 | 17.5 | 0.932 | 0.660 | 0.554 | 0.883 | 0.968 | 0.728 | 0.724 | |||
| LMBIRCH4 | [-] | -79.3 | -80.2 | -71.6 | -56.4 | -4.35 | 17.9 | 0.919 | 0.681 | 0.544 | 0.878 | 0.961 | 0.709 | 0.719 | |||
| PHSParam | [-] | -79.8 | -80.6 | -71.6 | -56.4 | -4.71 | 17.9 | 0.898 | 0.678 | 0.545 | 0.882 | 0.956 | 0.713 | 0.720 | |||
| PPE | [-] | -78.8 | -79.6 | -71.6 | -56.4 | -3.82 | 17.8 | 0.912 | 0.685 | 0.543 | 0.882 | 0.956 | 0.711 | 0.720 | |||
| R15 | [-] | -79.9 | -80.7 | -71.6 | -56.4 | -4.84 | 18.1 | 0.930 | 0.673 | 0.544 | 0.877 | 0.960 | 0.709 | 0.718 |
Download Data |
Period Mean (original grids) [Watt m-2] |
Model Period Mean (intersection) [Watt m-2] |
Model Period Mean (complement) [Watt m-2] |
Benchmark Period Mean (intersection) [Watt m-2] |
Benchmark Period Mean (complement) [Watt m-2] |
Bias [Watt m-2] |
RMSE [Watt m-2] |
Phase Shift [months] |
Bias Score [1] |
RMSE Score [1] |
Seasonal Cycle Score [1] |
Spatial Distribution Score [1] |
Interannual Variability Score [1] |
Overall Score [1] |
|||
|---|---|---|---|---|---|---|---|---|---|---|---|---|---|---|---|---|---|
| Benchmark | [-] | -31.1 | |||||||||||||||
| D104 | [-] | -39.6 | -39.8 | -30.9 | -29.8 | -8.97 | 16.9 | 0.868 | 0.565 | 0.421 | 0.902 | 0.933 | 0.891 | 0.689 | |||
| LMBIRCH4 | [-] | -39.4 | -39.6 | -31.2 | -30.0 | -8.52 | 16.6 | 0.874 | 0.578 | 0.422 | 0.909 | 0.930 | 0.894 | 0.693 | |||
| PHSParam | [-] | -39.5 | -39.7 | -31.2 | -30.0 | -8.58 | 16.6 | 0.865 | 0.577 | 0.423 | 0.910 | 0.925 | 0.894 | 0.692 | |||
| PPE | [-] | -39.0 | -39.2 | -31.2 | -30.0 | -8.09 | 16.4 | 0.876 | 0.593 | 0.421 | 0.909 | 0.937 | 0.896 | 0.696 | |||
| R15 | [-] | -39.3 | -39.5 | -31.2 | -30.0 | -8.39 | 16.6 | 0.864 | 0.583 | 0.420 | 0.910 | 0.931 | 0.893 | 0.693 |
Download Data |
Period Mean (original grids) [Watt m-2] |
Model Period Mean (intersection) [Watt m-2] |
Model Period Mean (complement) [Watt m-2] |
Benchmark Period Mean (intersection) [Watt m-2] |
Benchmark Period Mean (complement) [Watt m-2] |
Bias [Watt m-2] |
RMSE [Watt m-2] |
Phase Shift [months] |
Bias Score [1] |
RMSE Score [1] |
Seasonal Cycle Score [1] |
Spatial Distribution Score [1] |
Interannual Variability Score [1] |
Overall Score [1] |
|||
|---|---|---|---|---|---|---|---|---|---|---|---|---|---|---|---|---|---|
| Benchmark | [-] | -96.8 | |||||||||||||||
| D104 | [-] | -99.4 | -99.7 | -97.1 | -65.9 | 2.15 | 15.9 | 0.492 | 0.674 | 0.534 | 0.920 | 0.964 | 0.750 | 0.729 | |||
| LMBIRCH4 | [-] | -99.2 | -99.5 | -98.0 | -65.7 | 3.27 | 16.2 | 0.582 | 0.665 | 0.533 | 0.914 | 0.957 | 0.748 | 0.725 | |||
| PHSParam | [-] | -98.9 | -99.3 | -98.0 | -65.7 | 3.46 | 16.4 | 0.576 | 0.662 | 0.529 | 0.916 | 0.953 | 0.747 | 0.723 | |||
| PPE | [-] | -97.5 | -97.8 | -98.0 | -65.7 | 4.72 | 17.1 | 0.566 | 0.645 | 0.526 | 0.918 | 0.935 | 0.748 | 0.717 | |||
| R15 | [-] | -99.6 | -99.9 | -98.0 | -65.7 | 2.80 | 16.2 | 0.594 | 0.664 | 0.533 | 0.912 | 0.956 | 0.747 | 0.724 |
Download Data |
Period Mean (original grids) [Watt m-2] |
Model Period Mean (intersection) [Watt m-2] |
Model Period Mean (complement) [Watt m-2] |
Benchmark Period Mean (intersection) [Watt m-2] |
Benchmark Period Mean (complement) [Watt m-2] |
Bias [Watt m-2] |
RMSE [Watt m-2] |
Phase Shift [months] |
Bias Score [1] |
RMSE Score [1] |
Seasonal Cycle Score [1] |
Spatial Distribution Score [1] |
Interannual Variability Score [1] |
Overall Score [1] |
|||
|---|---|---|---|---|---|---|---|---|---|---|---|---|---|---|---|---|---|
| Benchmark | [-] | -55.6 | |||||||||||||||
| D104 | [-] | -58.1 | -58.2 | -56.4 | -52.6 | -2.99 | 11.8 | 0.889 | 0.651 | 0.454 | 0.884 | 0.966 | 0.864 | 0.712 | |||
| LMBIRCH4 | [-] | -57.8 | -58.0 | -55.7 | -52.2 | -3.48 | 11.9 | 0.893 | 0.639 | 0.455 | 0.886 | 0.969 | 0.871 | 0.713 | |||
| PHSParam | [-] | -57.4 | -57.5 | -55.7 | -52.2 | -3.14 | 12.0 | 0.900 | 0.643 | 0.453 | 0.885 | 0.965 | 0.871 | 0.712 | |||
| PPE | [-] | -57.1 | -57.2 | -55.7 | -52.2 | -2.79 | 11.9 | 0.892 | 0.647 | 0.452 | 0.886 | 0.957 | 0.872 | 0.711 | |||
| R15 | [-] | -57.9 | -58.0 | -55.7 | -52.2 | -3.58 | 12.0 | 0.905 | 0.638 | 0.453 | 0.885 | 0.976 | 0.870 | 0.713 |
Download Data |
Period Mean (original grids) [Watt m-2] |
Model Period Mean (intersection) [Watt m-2] |
Model Period Mean (complement) [Watt m-2] |
Benchmark Period Mean (intersection) [Watt m-2] |
Benchmark Period Mean (complement) [Watt m-2] |
Bias [Watt m-2] |
RMSE [Watt m-2] |
Phase Shift [months] |
Bias Score [1] |
RMSE Score [1] |
Seasonal Cycle Score [1] |
Spatial Distribution Score [1] |
Interannual Variability Score [1] |
Overall Score [1] |
|||
|---|---|---|---|---|---|---|---|---|---|---|---|---|---|---|---|---|---|
| Benchmark | [-] | -52.6 | |||||||||||||||
| D104 | [-] | -70.9 | -70.9 | -64.0 | -46.3 | -4.89 | 17.3 | 1.10 | 0.558 | 0.479 | 0.843 | 0.939 | 0.772 | 0.678 | |||
| LMBIRCH4 | [-] | -70.7 | -70.7 | -64.1 | -46.2 | -4.59 | 17.3 | 1.11 | 0.567 | 0.476 | 0.842 | 0.940 | 0.773 | 0.679 | |||
| PHSParam | [-] | -70.7 | -70.7 | -64.1 | -46.2 | -4.59 | 17.3 | 1.11 | 0.566 | 0.476 | 0.842 | 0.940 | 0.774 | 0.679 | |||
| PPE | [-] | -70.2 | -70.2 | -64.1 | -46.2 | -4.11 | 17.2 | 1.10 | 0.573 | 0.475 | 0.843 | 0.937 | 0.774 | 0.679 | |||
| R15 | [-] | -71.0 | -71.0 | -64.1 | -46.2 | -4.94 | 17.4 | 1.11 | 0.560 | 0.477 | 0.841 | 0.942 | 0.773 | 0.678 |
Download Data |
Period Mean (original grids) [Watt m-2] |
Model Period Mean (intersection) [Watt m-2] |
Model Period Mean (complement) [Watt m-2] |
Benchmark Period Mean (intersection) [Watt m-2] |
Benchmark Period Mean (complement) [Watt m-2] |
Bias [Watt m-2] |
RMSE [Watt m-2] |
Phase Shift [months] |
Bias Score [1] |
RMSE Score [1] |
Seasonal Cycle Score [1] |
Spatial Distribution Score [1] |
Interannual Variability Score [1] |
Overall Score [1] |
|||
|---|---|---|---|---|---|---|---|---|---|---|---|---|---|---|---|---|---|
| Benchmark | [-] | -121. | |||||||||||||||
| D104 | [-] | -107. | -107. | -121. | -76.9 | 15.3 | 25.7 | 0.811 | 0.538 | 0.527 | 0.892 | 0.805 | 0.652 | 0.657 | |||
| LMBIRCH4 | [-] | -107. | -107. | -121. | -76.6 | 15.1 | 26.2 | 0.774 | 0.549 | 0.523 | 0.892 | 0.801 | 0.639 | 0.654 | |||
| PHSParam | [-] | -107. | -107. | -121. | -76.6 | 15.2 | 26.3 | 0.775 | 0.548 | 0.522 | 0.891 | 0.805 | 0.640 | 0.655 | |||
| PPE | [-] | -107. | -107. | -121. | -76.6 | 15.3 | 26.3 | 0.779 | 0.548 | 0.521 | 0.891 | 0.813 | 0.640 | 0.656 | |||
| R15 | [-] | -107. | -107. | -121. | -76.6 | 14.9 | 26.2 | 0.778 | 0.550 | 0.522 | 0.892 | 0.797 | 0.639 | 0.654 |
Download Data |
Period Mean (original grids) [Watt m-2] |
Model Period Mean (intersection) [Watt m-2] |
Model Period Mean (complement) [Watt m-2] |
Benchmark Period Mean (intersection) [Watt m-2] |
Benchmark Period Mean (complement) [Watt m-2] |
Bias [Watt m-2] |
RMSE [Watt m-2] |
Phase Shift [months] |
Bias Score [1] |
RMSE Score [1] |
Seasonal Cycle Score [1] |
Spatial Distribution Score [1] |
Interannual Variability Score [1] |
Overall Score [1] |
|||
|---|---|---|---|---|---|---|---|---|---|---|---|---|---|---|---|---|---|
| Benchmark | [-] | -34.3 | |||||||||||||||
| D104 | [-] | -42.7 | -42.7 | -34.4 | -37.4 | -8.93 | 15.6 | 0.971 | 0.568 | 0.452 | 0.866 | 0.869 | 0.876 | 0.680 | |||
| LMBIRCH4 | [-] | -42.6 | -42.6 | -34.3 | -37.5 | -8.92 | 15.6 | 0.861 | 0.564 | 0.447 | 0.883 | 0.880 | 0.882 | 0.684 | |||
| PHSParam | [-] | -42.6 | -42.6 | -34.3 | -37.5 | -8.98 | 15.6 | 0.870 | 0.563 | 0.449 | 0.882 | 0.875 | 0.882 | 0.683 | |||
| PPE | [-] | -42.3 | -42.3 | -34.3 | -37.5 | -8.71 | 15.5 | 0.863 | 0.571 | 0.447 | 0.883 | 0.885 | 0.881 | 0.686 | |||
| R15 | [-] | -42.6 | -42.7 | -34.3 | -37.5 | -9.03 | 15.7 | 0.880 | 0.561 | 0.448 | 0.881 | 0.875 | 0.880 | 0.682 |
Download Data |
Period Mean (original grids) [Watt m-2] |
Model Period Mean (intersection) [Watt m-2] |
Model Period Mean (complement) [Watt m-2] |
Benchmark Period Mean (intersection) [Watt m-2] |
Benchmark Period Mean (complement) [Watt m-2] |
Bias [Watt m-2] |
RMSE [Watt m-2] |
Phase Shift [months] |
Bias Score [1] |
RMSE Score [1] |
Seasonal Cycle Score [1] |
Spatial Distribution Score [1] |
Interannual Variability Score [1] |
Overall Score [1] |
|||
|---|---|---|---|---|---|---|---|---|---|---|---|---|---|---|---|---|---|
| Benchmark | [-] | -70.7 | |||||||||||||||
| D104 | [-] | -84.5 | -85.1 | -72.2 | -53.9 | -7.40 | 15.7 | 1.25 | 0.533 | 0.468 | 0.803 | 0.996 | 0.793 | 0.677 | |||
| LMBIRCH4 | [-] | -84.0 | -84.6 | -71.7 | -53.7 | -7.59 | 15.7 | 1.29 | 0.536 | 0.468 | 0.790 | 0.996 | 0.799 | 0.676 | |||
| PHSParam | [-] | -84.1 | -84.7 | -71.7 | -53.7 | -7.71 | 15.7 | 1.33 | 0.531 | 0.468 | 0.783 | 0.996 | 0.802 | 0.674 | |||
| PPE | [-] | -82.8 | -83.3 | -71.7 | -53.7 | -6.53 | 15.1 | 1.34 | 0.552 | 0.468 | 0.782 | 0.995 | 0.803 | 0.678 | |||
| R15 | [-] | -84.8 | -85.4 | -71.7 | -53.7 | -8.23 | 15.9 | 1.30 | 0.524 | 0.466 | 0.790 | 0.996 | 0.797 | 0.673 |
Download Data |
Period Mean (original grids) [Watt m-2] |
Model Period Mean (intersection) [Watt m-2] |
Model Period Mean (complement) [Watt m-2] |
Benchmark Period Mean (intersection) [Watt m-2] |
Benchmark Period Mean (complement) [Watt m-2] |
Bias [Watt m-2] |
RMSE [Watt m-2] |
Phase Shift [months] |
Bias Score [1] |
RMSE Score [1] |
Seasonal Cycle Score [1] |
Spatial Distribution Score [1] |
Interannual Variability Score [1] |
Overall Score [1] |
|||
|---|---|---|---|---|---|---|---|---|---|---|---|---|---|---|---|---|---|
| Benchmark | [-] | -53.2 | |||||||||||||||
| D104 | [-] | -61.2 | -61.5 | -53.0 | -59.1 | -8.43 | 12.8 | 0.695 | 0.500 | 0.463 | 0.888 | 0.979 | 0.881 | 0.696 | |||
| LMBIRCH4 | [-] | -60.6 | -60.8 | -53.0 | -59.1 | -7.74 | 12.3 | 0.785 | 0.527 | 0.470 | 0.875 | 0.996 | 0.888 | 0.705 | |||
| PHSParam | [-] | -60.3 | -60.5 | -53.0 | -59.1 | -7.45 | 12.1 | 0.785 | 0.537 | 0.471 | 0.875 | 0.998 | 0.888 | 0.707 | |||
| PPE | [-] | -59.9 | -60.1 | -53.0 | -59.1 | -7.06 | 11.9 | 0.765 | 0.554 | 0.468 | 0.879 | 0.998 | 0.890 | 0.709 | |||
| R15 | [-] | -61.8 | -62.0 | -53.0 | -59.1 | -8.99 | 13.3 | 0.853 | 0.486 | 0.469 | 0.864 | 0.978 | 0.889 | 0.692 |
Download Data |
Period Mean (original grids) [Watt m-2] |
Model Period Mean (intersection) [Watt m-2] |
Model Period Mean (complement) [Watt m-2] |
Benchmark Period Mean (intersection) [Watt m-2] |
Benchmark Period Mean (complement) [Watt m-2] |
Bias [Watt m-2] |
RMSE [Watt m-2] |
Phase Shift [months] |
Bias Score [1] |
RMSE Score [1] |
Seasonal Cycle Score [1] |
Spatial Distribution Score [1] |
Interannual Variability Score [1] |
Overall Score [1] |
|||
|---|---|---|---|---|---|---|---|---|---|---|---|---|---|---|---|---|---|
| Benchmark | [-] | -42.5 | |||||||||||||||
| D104 | [-] | -52.6 | -52.6 | -42.6 | -45.9 | -9.79 | 15.1 | 0.683 | 0.564 | 0.509 | 0.914 | 0.984 | 0.859 | 0.723 | |||
| LMBIRCH4 | [-] | -52.7 | -52.7 | -42.4 | -45.6 | -10.1 | 15.2 | 0.637 | 0.553 | 0.508 | 0.921 | 0.987 | 0.865 | 0.724 | |||
| PHSParam | [-] | -52.6 | -52.6 | -42.4 | -45.6 | -9.94 | 15.2 | 0.636 | 0.556 | 0.507 | 0.921 | 0.982 | 0.864 | 0.723 | |||
| PPE | [-] | -52.2 | -52.2 | -42.4 | -45.6 | -9.53 | 15.0 | 0.634 | 0.571 | 0.504 | 0.922 | 0.986 | 0.865 | 0.725 | |||
| R15 | [-] | -53.0 | -53.0 | -42.4 | -45.6 | -10.3 | 15.4 | 0.641 | 0.545 | 0.509 | 0.921 | 0.985 | 0.864 | 0.722 |
Download Data |
Period Mean (original grids) [Watt m-2] |
Model Period Mean (intersection) [Watt m-2] |
Model Period Mean (complement) [Watt m-2] |
Benchmark Period Mean (intersection) [Watt m-2] |
Benchmark Period Mean (complement) [Watt m-2] |
Bias [Watt m-2] |
RMSE [Watt m-2] |
Phase Shift [months] |
Bias Score [1] |
RMSE Score [1] |
Seasonal Cycle Score [1] |
Spatial Distribution Score [1] |
Interannual Variability Score [1] |
Overall Score [1] |
|||
|---|---|---|---|---|---|---|---|---|---|---|---|---|---|---|---|---|---|
| Benchmark | [-] | -80.3 | |||||||||||||||
| D104 | [-] | -86.3 | -86.7 | -81.0 | -71.8 | -4.71 | 18.6 | 0.321 | 0.720 | 0.555 | 0.958 | 0.942 | 0.782 | 0.752 | |||
| LMBIRCH4 | [-] | -86.2 | -86.5 | -80.4 | -72.0 | -5.17 | 18.6 | 0.326 | 0.712 | 0.557 | 0.960 | 0.943 | 0.778 | 0.751 | |||
| PHSParam | [-] | -85.6 | -85.9 | -80.4 | -72.0 | -4.60 | 18.4 | 0.324 | 0.723 | 0.554 | 0.960 | 0.948 | 0.777 | 0.753 | |||
| PPE | [-] | -85.0 | -85.3 | -80.4 | -72.0 | -3.96 | 18.3 | 0.307 | 0.725 | 0.554 | 0.961 | 0.937 | 0.778 | 0.751 | |||
| R15 | [-] | -86.5 | -86.8 | -80.4 | -72.0 | -5.46 | 18.4 | 0.316 | 0.715 | 0.558 | 0.961 | 0.951 | 0.776 | 0.753 |
Download Data |
Period Mean (original grids) [Watt m-2] |
Model Period Mean (intersection) [Watt m-2] |
Model Period Mean (complement) [Watt m-2] |
Benchmark Period Mean (intersection) [Watt m-2] |
Benchmark Period Mean (complement) [Watt m-2] |
Bias [Watt m-2] |
RMSE [Watt m-2] |
Phase Shift [months] |
Bias Score [1] |
RMSE Score [1] |
Seasonal Cycle Score [1] |
Spatial Distribution Score [1] |
Interannual Variability Score [1] |
Overall Score [1] |
|||
|---|---|---|---|---|---|---|---|---|---|---|---|---|---|---|---|---|---|
| Benchmark | [-] | -43.7 | |||||||||||||||
| D104 | [-] | -51.0 | -51.1 | -42.9 | -47.1 | -8.44 | 12.9 | 1.65 | 0.454 | 0.458 | 0.775 | 0.894 | 0.761 | 0.633 | |||
| LMBIRCH4 | [-] | -50.9 | -51.1 | -43.6 | -46.9 | -7.63 | 12.6 | 1.66 | 0.487 | 0.457 | 0.771 | 0.915 | 0.751 | 0.640 | |||
| PHSParam | [-] | -51.0 | -51.1 | -43.6 | -46.9 | -7.71 | 12.6 | 1.68 | 0.486 | 0.461 | 0.766 | 0.886 | 0.759 | 0.637 | |||
| PPE | [-] | -50.0 | -50.2 | -43.6 | -46.9 | -6.82 | 12.1 | 1.65 | 0.517 | 0.460 | 0.772 | 0.897 | 0.758 | 0.644 | |||
| R15 | [-] | -51.6 | -51.7 | -43.6 | -46.9 | -8.23 | 13.0 | 1.71 | 0.470 | 0.459 | 0.760 | 0.902 | 0.753 | 0.634 |
Download Data |
Period Mean (original grids) [Watt m-2] |
Model Period Mean (intersection) [Watt m-2] |
Model Period Mean (complement) [Watt m-2] |
Benchmark Period Mean (intersection) [Watt m-2] |
Benchmark Period Mean (complement) [Watt m-2] |
Bias [Watt m-2] |
RMSE [Watt m-2] |
Phase Shift [months] |
Bias Score [1] |
RMSE Score [1] |
Seasonal Cycle Score [1] |
Spatial Distribution Score [1] |
Interannual Variability Score [1] |
Overall Score [1] |
|||
|---|---|---|---|---|---|---|---|---|---|---|---|---|---|---|---|---|---|
| Benchmark | [-] | -64.5 | |||||||||||||||
| D104 | [-] | -72.0 | -72.5 | -65.1 | -54.5 | -6.46 | 14.5 | 0.841 | 0.658 | 0.480 | 0.895 | 0.924 | 0.804 | 0.707 | |||
| LMBIRCH4 | [-] | -70.9 | -71.2 | -64.7 | -54.3 | -5.72 | 14.4 | 0.859 | 0.674 | 0.469 | 0.889 | 0.911 | 0.805 | 0.703 | |||
| PHSParam | [-] | -71.2 | -71.6 | -64.7 | -54.3 | -6.11 | 14.5 | 0.862 | 0.667 | 0.471 | 0.888 | 0.906 | 0.809 | 0.702 | |||
| PPE | [-] | -70.3 | -70.6 | -64.7 | -54.3 | -5.16 | 14.1 | 0.886 | 0.686 | 0.471 | 0.883 | 0.931 | 0.807 | 0.708 | |||
| R15 | [-] | -72.1 | -72.5 | -64.7 | -54.3 | -6.97 | 14.9 | 0.851 | 0.641 | 0.471 | 0.889 | 0.904 | 0.811 | 0.698 |
Download Data |
Period Mean (original grids) [Watt m-2] |
Model Period Mean (intersection) [Watt m-2] |
Model Period Mean (complement) [Watt m-2] |
Benchmark Period Mean (intersection) [Watt m-2] |
Benchmark Period Mean (complement) [Watt m-2] |
Bias [Watt m-2] |
RMSE [Watt m-2] |
Phase Shift [months] |
Bias Score [1] |
RMSE Score [1] |
Seasonal Cycle Score [1] |
Spatial Distribution Score [1] |
Interannual Variability Score [1] |
Overall Score [1] |
|||
|---|---|---|---|---|---|---|---|---|---|---|---|---|---|---|---|---|---|
| Benchmark | [-] | -80.0 | |||||||||||||||
| D104 | [-] | -84.1 | -83.6 | -81.9 | -50.0 | 1.49 | 21.0 | 0.949 | 0.510 | 0.425 | 0.864 | 0.864 | 0.758 | 0.641 | |||
| LMBIRCH4 | [-] | -84.0 | -83.5 | -81.4 | -50.3 | 1.03 | 20.9 | 0.910 | 0.513 | 0.424 | 0.866 | 0.879 | 0.767 | 0.646 | |||
| PHSParam | [-] | -83.9 | -83.3 | -81.4 | -50.3 | 1.17 | 21.0 | 0.831 | 0.513 | 0.422 | 0.880 | 0.875 | 0.768 | 0.647 | |||
| PPE | [-] | -83.2 | -82.6 | -81.4 | -50.3 | 1.78 | 20.8 | 0.840 | 0.521 | 0.423 | 0.879 | 0.871 | 0.768 | 0.648 | |||
| R15 | [-] | -84.3 | -83.8 | -81.4 | -50.3 | 0.790 | 21.0 | 0.920 | 0.507 | 0.424 | 0.862 | 0.881 | 0.767 | 0.644 |
Temporally integrated period mean