Mean State
Download Data |
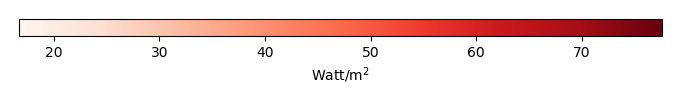
Period Mean (original grids) [Watt/m2] |
Bias [Watt/m2] |
RMSE [Watt/m2] |
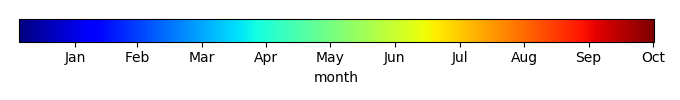
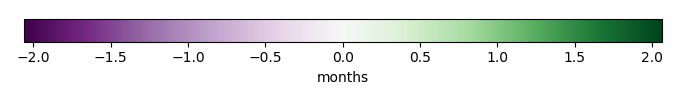
Phase Shift [months] |
Bias Score [1] |
RMSE Score [1] |
Seasonal Cycle Score [1] |
Interannual Variability Score [1] |
Overall Score [1] |
|||
|---|---|---|---|---|---|---|---|---|---|---|---|---|
| Benchmark | [-] | 131. | ||||||||||
| D104 | [-] | 90.6 | -47.3 | 49.0 | 0.00 | 0.0869 | 0.583 | 1.00 | 0.759 | 0.602 | ||
| LMBIRCH4 | [-] | 92.5 | -47.1 | 48.9 | 0.00 | 0.0874 | 0.580 | 1.00 | 0.735 | 0.596 | ||
| PHSParam | [-] | 90.7 | -47.4 | 48.5 | 0.00 | 0.0866 | 0.599 | 1.00 | 0.769 | 0.611 | ||
| PPE | [-] | 91.0 | -45.0 | 46.1 | 0.00 | 0.0946 | 0.641 | 1.00 | 0.821 | 0.640 | ||
| R15 | [-] | 90.1 | -47.5 | 49.2 | 0.00 | 0.0864 | 0.586 | 1.00 | 0.744 | 0.600 |
Download Data |
Period Mean (original grids) [Watt/m2] |
Bias [Watt/m2] |
RMSE [Watt/m2] |
Phase Shift [months] |
Bias Score [1] |
RMSE Score [1] |
Seasonal Cycle Score [1] |
Interannual Variability Score [1] |
Overall Score [1] |
|||
|---|---|---|---|---|---|---|---|---|---|---|---|---|
| Benchmark | [-] | 54.1 | ||||||||||
| D104 | [-] | 25.2 | -28.9 | 26.5 | 1.02 | 0.570 | 0.571 | 0.933 | 0.995 | 0.728 | ||
| LMBIRCH4 | [-] | 24.7 | -29.4 | 26.8 | 1.02 | 0.564 | 0.571 | 0.933 | 0.995 | 0.727 | ||
| PHSParam | [-] | 24.9 | -29.2 | 26.6 | 1.02 | 0.566 | 0.571 | 0.933 | 0.995 | 0.727 | ||
| PPE | [-] | 23.2 | -30.9 | 27.1 | 1.02 | 0.548 | 0.581 | 0.933 | 0.971 | 0.723 | ||
| R15 | [-] | 26.5 | -27.6 | 26.7 | 1.02 | 0.584 | 0.563 | 0.933 | 0.998 | 0.728 |
Download Data |
Period Mean (original grids) [Watt/m2] |
Bias [Watt/m2] |
RMSE [Watt/m2] |
Phase Shift [months] |
Bias Score [1] |
RMSE Score [1] |
Seasonal Cycle Score [1] |
Interannual Variability Score [1] |
Overall Score [1] |
|||
|---|---|---|---|---|---|---|---|---|---|---|---|---|
| Benchmark | [-] | 147. | ||||||||||
| D104 | [-] | 140. | -6.50 | 23.6 | 0.00 | 0.709 | 0.306 | 1.00 | 0.702 | 0.604 | ||
| LMBIRCH4 | [-] | 140. | -6.46 | 23.6 | 0.00 | 0.710 | 0.306 | 1.00 | 0.702 | 0.605 | ||
| PHSParam | [-] | 141. | -5.90 | 23.4 | 0.00 | 0.731 | 0.305 | 1.00 | 0.704 | 0.609 | ||
| PPE | [-] | 132. | -14.4 | 26.9 | 0.00 | 0.466 | 0.311 | 1.00 | 0.677 | 0.553 | ||
| R15 | [-] | 140. | -6.80 | 23.7 | 0.00 | 0.697 | 0.306 | 1.00 | 0.701 | 0.602 |
Download Data |
Period Mean (original grids) [Watt/m2] |
Bias [Watt/m2] |
RMSE [Watt/m2] |
Phase Shift [months] |
Bias Score [1] |
RMSE Score [1] |
Seasonal Cycle Score [1] |
Interannual Variability Score [1] |
Overall Score [1] |
|||
|---|---|---|---|---|---|---|---|---|---|---|---|---|
| Benchmark | [-] | 42.7 | ||||||||||
| D104 | [-] | 50.1 | 4.66 | 35.1 | 0.00 | 0.456 | 0.508 | 1.00 | 0.392 | 0.573 | ||
| LMBIRCH4 | [-] | 49.9 | 4.43 | 35.0 | 0.00 | 0.458 | 0.509 | 1.00 | 0.394 | 0.574 | ||
| PHSParam | [-] | 49.6 | 4.43 | 35.0 | 0.00 | 0.458 | 0.509 | 1.00 | 0.393 | 0.574 | ||
| PPE | [-] | 46.3 | 0.101 | 32.6 | 0.00 | 0.499 | 0.528 | 1.00 | 0.425 | 0.596 | ||
| R15 | [-] | 50.2 | 4.96 | 35.3 | 0.00 | 0.454 | 0.507 | 1.00 | 0.392 | 0.572 |
Download Data |
Period Mean (original grids) [Watt/m2] |
Bias [Watt/m2] |
RMSE [Watt/m2] |
Phase Shift [months] |
Bias Score [1] |
RMSE Score [1] |
Seasonal Cycle Score [1] |
Interannual Variability Score [1] |
Overall Score [1] |
|||
|---|---|---|---|---|---|---|---|---|---|---|---|---|
| Benchmark | [-] | 119. | ||||||||||
| D104 | [-] | 119. | 0.152 | 26.3 | 0.00 | 0.609 | 0.603 | 1.00 | 0.934 | 0.750 | ||
| LMBIRCH4 | [-] | 119. | 0.0227 | 26.0 | 0.00 | 0.616 | 0.603 | 1.00 | 0.934 | 0.751 | ||
| PHSParam | [-] | 118. | -0.893 | 24.4 | 0.00 | 0.647 | 0.615 | 1.00 | 0.918 | 0.759 | ||
| PPE | [-] | 115. | -3.91 | 24.7 | 0.00 | 0.653 | 0.619 | 1.00 | 0.890 | 0.756 | ||
| R15 | [-] | 119. | -0.234 | 26.1 | 0.00 | 0.613 | 0.606 | 1.00 | 0.931 | 0.751 |
Download Data |
Period Mean (original grids) [Watt/m2] |
Bias [Watt/m2] |
RMSE [Watt/m2] |
Phase Shift [months] |
Bias Score [1] |
RMSE Score [1] |
Seasonal Cycle Score [1] |
Interannual Variability Score [1] |
Overall Score [1] |
|||
|---|---|---|---|---|---|---|---|---|---|---|---|---|
| Benchmark | [-] | 67.2 | ||||||||||
| D104 | [-] | 59.2 | -8.72 | 28.1 | 0.319 | 0.741 | 0.680 | 0.977 | 0.834 | 0.782 | ||
| LMBIRCH4 | [-] | 59.2 | -8.66 | 27.8 | 0.319 | 0.743 | 0.681 | 0.977 | 0.837 | 0.784 | ||
| PHSParam | [-] | 59.7 | -8.20 | 27.6 | 0.319 | 0.746 | 0.681 | 0.977 | 0.837 | 0.784 | ||
| PPE | [-] | 57.2 | -10.5 | 27.8 | 0.419 | 0.731 | 0.690 | 0.970 | 0.850 | 0.786 | ||
| R15 | [-] | 59.1 | -8.81 | 28.1 | 0.319 | 0.742 | 0.680 | 0.977 | 0.834 | 0.782 |
Download Data |
Period Mean (original grids) [Watt/m2] |
Bias [Watt/m2] |
RMSE [Watt/m2] |
Phase Shift [months] |
Bias Score [1] |
RMSE Score [1] |
Seasonal Cycle Score [1] |
Interannual Variability Score [1] |
Overall Score [1] |
|||
|---|---|---|---|---|---|---|---|---|---|---|---|---|
| Benchmark | [-] | 74.8 | ||||||||||
| D104 | [-] | 67.6 | -7.70 | 27.5 | 0.427 | 0.739 | 0.672 | 0.964 | 0.837 | 0.777 | ||
| LMBIRCH4 | [-] | 68.2 | -7.08 | 27.4 | 0.427 | 0.742 | 0.672 | 0.964 | 0.838 | 0.778 | ||
| PHSParam | [-] | 68.5 | -6.81 | 27.2 | 0.427 | 0.745 | 0.673 | 0.964 | 0.838 | 0.778 | ||
| PPE | [-] | 65.3 | -9.89 | 27.3 | 0.458 | 0.726 | 0.682 | 0.962 | 0.847 | 0.780 | ||
| R15 | [-] | 67.9 | -7.43 | 27.3 | 0.427 | 0.740 | 0.674 | 0.964 | 0.837 | 0.778 |
Download Data |
Period Mean (original grids) [Watt/m2] |
Bias [Watt/m2] |
RMSE [Watt/m2] |
Phase Shift [months] |
Bias Score [1] |
RMSE Score [1] |
Seasonal Cycle Score [1] |
Interannual Variability Score [1] |
Overall Score [1] |
|||
|---|---|---|---|---|---|---|---|---|---|---|---|---|
| Benchmark | [-] | 117. | ||||||||||
| D104 | [-] | 65.7 | -51.3 | 56.3 | 1.02 | 0.388 | 0.615 | 0.933 | 0.750 | 0.660 | ||
| LMBIRCH4 | [-] | 65.7 | -51.3 | 56.3 | 1.02 | 0.388 | 0.614 | 0.933 | 0.750 | 0.660 | ||
| PHSParam | [-] | 67.2 | -49.9 | 54.2 | 1.02 | 0.399 | 0.628 | 0.933 | 0.771 | 0.672 | ||
| PPE | [-] | 66.5 | -50.5 | 54.8 | 1.02 | 0.394 | 0.627 | 0.933 | 0.765 | 0.669 | ||
| R15 | [-] | 65.6 | -51.4 | 56.3 | 1.02 | 0.388 | 0.614 | 0.933 | 0.751 | 0.660 |
Download Data |
Period Mean (original grids) [Watt/m2] |
Bias [Watt/m2] |
RMSE [Watt/m2] |
Phase Shift [months] |
Bias Score [1] |
RMSE Score [1] |
Seasonal Cycle Score [1] |
Interannual Variability Score [1] |
Overall Score [1] |
|||
|---|---|---|---|---|---|---|---|---|---|---|---|---|
| Benchmark | [-] | 85.0 | ||||||||||
| D104 | [-] | 80.2 | -4.84 | 27.5 | 0.814 | 0.814 | 0.660 | 0.928 | 0.823 | 0.777 | ||
| LMBIRCH4 | [-] | 81.1 | -3.90 | 27.4 | 0.814 | 0.819 | 0.659 | 0.928 | 0.823 | 0.778 | ||
| PHSParam | [-] | 81.2 | -3.79 | 27.4 | 0.814 | 0.819 | 0.659 | 0.928 | 0.823 | 0.778 | ||
| PPE | [-] | 77.3 | -7.58 | 27.1 | 0.763 | 0.807 | 0.670 | 0.932 | 0.824 | 0.781 | ||
| R15 | [-] | 80.8 | -4.20 | 27.0 | 0.814 | 0.813 | 0.666 | 0.928 | 0.829 | 0.781 |
Download Data |
Period Mean (original grids) [Watt/m2] |
Bias [Watt/m2] |
RMSE [Watt/m2] |
Phase Shift [months] |
Bias Score [1] |
RMSE Score [1] |
Seasonal Cycle Score [1] |
Interannual Variability Score [1] |
Overall Score [1] |
|||
|---|---|---|---|---|---|---|---|---|---|---|---|---|
| Benchmark | [-] | 68.6 | ||||||||||
| D104 | [-] | 59.8 | -8.81 | 20.6 | 0.218 | 0.845 | 0.735 | 0.986 | 0.924 | 0.845 | ||
| LMBIRCH4 | [-] | 59.9 | -8.78 | 20.7 | 0.218 | 0.845 | 0.735 | 0.986 | 0.923 | 0.845 | ||
| PHSParam | [-] | 59.9 | -8.71 | 20.6 | 0.218 | 0.846 | 0.735 | 0.986 | 0.924 | 0.845 | ||
| PPE | [-] | 55.4 | -13.2 | 21.4 | 0.218 | 0.794 | 0.748 | 0.986 | 0.945 | 0.844 | ||
| R15 | [-] | 60.8 | -7.80 | 20.1 | 0.218 | 0.854 | 0.739 | 0.986 | 0.926 | 0.849 |
Download Data |
Period Mean (original grids) [Watt/m2] |
Bias [Watt/m2] |
RMSE [Watt/m2] |
Phase Shift [months] |
Bias Score [1] |
RMSE Score [1] |
Seasonal Cycle Score [1] |
Interannual Variability Score [1] |
Overall Score [1] |
|||
|---|---|---|---|---|---|---|---|---|---|---|---|---|
| Benchmark | [-] | 82.6 | ||||||||||
| D104 | [-] | 86.3 | 3.67 | 27.5 | 0.850 | 0.685 | 0.723 | 0.893 | 0.883 | 0.782 | ||
| LMBIRCH4 | [-] | 93.0 | 10.4 | 29.0 | 0.850 | 0.697 | 0.716 | 0.893 | 0.886 | 0.782 | ||
| PHSParam | [-] | 93.3 | 10.7 | 28.9 | 0.850 | 0.697 | 0.717 | 0.893 | 0.887 | 0.782 | ||
| PPE | [-] | 89.2 | 6.61 | 28.8 | 0.681 | 0.688 | 0.720 | 0.904 | 0.881 | 0.782 | ||
| R15 | [-] | 87.1 | 4.41 | 28.1 | 0.850 | 0.680 | 0.721 | 0.893 | 0.878 | 0.778 |
Download Data |
Period Mean (original grids) [Watt/m2] |
Bias [Watt/m2] |
RMSE [Watt/m2] |
Phase Shift [months] |
Bias Score [1] |
RMSE Score [1] |
Seasonal Cycle Score [1] |
Interannual Variability Score [1] |
Overall Score [1] |
|||
|---|---|---|---|---|---|---|---|---|---|---|---|---|
| Benchmark | [-] | 117. | ||||||||||
| D104 | [-] | 134. | 17.9 | 38.7 | 0.00 | 0.590 | 0.387 | 1.00 | 0.629 | 0.599 | ||
| LMBIRCH4 | [-] | 135. | 18.0 | 38.7 | 0.00 | 0.588 | 0.387 | 1.00 | 0.629 | 0.598 | ||
| PHSParam | [-] | 133. | 16.5 | 37.2 | 0.00 | 0.614 | 0.395 | 1.00 | 0.610 | 0.603 | ||
| PPE | [-] | 128. | 11.1 | 34.6 | 0.00 | 0.721 | 0.395 | 1.00 | 0.598 | 0.622 | ||
| R15 | [-] | 134. | 17.7 | 38.5 | 0.00 | 0.593 | 0.387 | 1.00 | 0.629 | 0.599 |
Temporally integrated period mean