Mean State
Download Data |
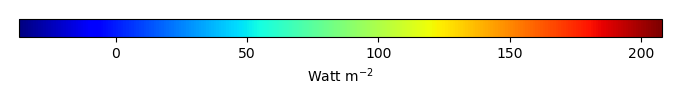
Period Mean (original grids) [Watt m-2] |
Model Period Mean (intersection) [Watt m-2] |
Model Period Mean (complement) [Watt m-2] |
Benchmark Period Mean (intersection) [Watt m-2] |
Benchmark Period Mean (complement) [Watt m-2] |
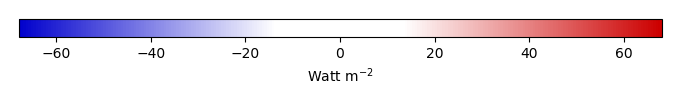
Bias [Watt m-2] |
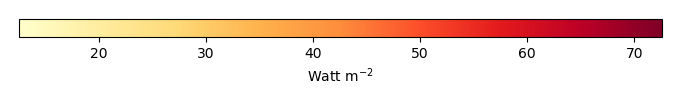
RMSE [Watt m-2] |
Phase Shift [months] |
Bias Score [1] |
RMSE Score [1] |
Seasonal Cycle Score [1] |
Spatial Distribution Score [1] |
Interannual Variability Score [1] |
Overall Score [1] |
|||
|---|---|---|---|---|---|---|---|---|---|---|---|---|---|---|---|---|---|
| Benchmark | [-] | 122. | |||||||||||||||
| D104 | [-] | 115. | 116. | 122. | 167. | -6.21 | 18.9 | 1.25 | 0.624 | 0.445 | 0.823 | 0.851 | 0.667 | 0.643 | |||
| LMBIRCH4 | [-] | 116. | 116. | 121. | 167. | -4.38 | 18.5 | 1.12 | 0.668 | 0.442 | 0.844 | 0.871 | 0.665 | 0.655 | |||
| PHSParam | [-] | 116. | 116. | 121. | 167. | -4.67 | 18.6 | 1.10 | 0.657 | 0.443 | 0.850 | 0.862 | 0.669 | 0.654 | |||
| PPE | [-] | 112. | 112. | 121. | 167. | -8.48 | 19.9 | 1.09 | 0.548 | 0.442 | 0.849 | 0.784 | 0.664 | 0.622 | |||
| R15 | [-] | 115. | 115. | 121. | 167. | -5.32 | 18.8 | 1.12 | 0.644 | 0.442 | 0.847 | 0.862 | 0.665 | 0.650 |
Download Data |
Period Mean (original grids) [Watt m-2] |
Model Period Mean (intersection) [Watt m-2] |
Model Period Mean (complement) [Watt m-2] |
Benchmark Period Mean (intersection) [Watt m-2] |
Benchmark Period Mean (complement) [Watt m-2] |
Bias [Watt m-2] |
RMSE [Watt m-2] |
Phase Shift [months] |
Bias Score [1] |
RMSE Score [1] |
Seasonal Cycle Score [1] |
Spatial Distribution Score [1] |
Interannual Variability Score [1] |
Overall Score [1] |
|||
|---|---|---|---|---|---|---|---|---|---|---|---|---|---|---|---|---|---|
| Benchmark | [-] | 102. | |||||||||||||||
| D104 | [-] | 97.2 | 97.3 | 103. | 159. | -5.27 | 20.7 | 1.38 | 0.630 | 0.510 | 0.794 | 0.849 | 0.656 | 0.658 | |||
| LMBIRCH4 | [-] | 97.4 | 97.6 | 102. | 159. | -3.47 | 20.3 | 1.30 | 0.669 | 0.508 | 0.813 | 0.889 | 0.646 | 0.672 | |||
| PHSParam | [-] | 97.6 | 97.7 | 102. | 159. | -3.40 | 20.6 | 1.20 | 0.666 | 0.505 | 0.827 | 0.871 | 0.642 | 0.669 | |||
| PPE | [-] | 96.6 | 96.7 | 102. | 159. | -4.45 | 21.1 | 1.20 | 0.646 | 0.504 | 0.824 | 0.850 | 0.640 | 0.661 | |||
| R15 | [-] | 97.0 | 97.1 | 102. | 159. | -4.04 | 20.3 | 1.26 | 0.661 | 0.510 | 0.819 | 0.866 | 0.645 | 0.669 |
Download Data |
Period Mean (original grids) [Watt m-2] |
Model Period Mean (intersection) [Watt m-2] |
Model Period Mean (complement) [Watt m-2] |
Benchmark Period Mean (intersection) [Watt m-2] |
Benchmark Period Mean (complement) [Watt m-2] |
Bias [Watt m-2] |
RMSE [Watt m-2] |
Phase Shift [months] |
Bias Score [1] |
RMSE Score [1] |
Seasonal Cycle Score [1] |
Spatial Distribution Score [1] |
Interannual Variability Score [1] |
Overall Score [1] |
|||
|---|---|---|---|---|---|---|---|---|---|---|---|---|---|---|---|---|---|
| Benchmark | [-] | 112. | |||||||||||||||
| D104 | [-] | 105. | 105. | 112. | 166. | -5.45 | 21.5 | 1.38 | 0.700 | 0.565 | 0.794 | 0.860 | 0.616 | 0.683 | |||
| LMBIRCH4 | [-] | 106. | 106. | 111. | 165. | -3.41 | 21.2 | 1.40 | 0.723 | 0.562 | 0.781 | 0.861 | 0.612 | 0.684 | |||
| PHSParam | [-] | 105. | 105. | 111. | 165. | -3.94 | 21.2 | 1.21 | 0.712 | 0.566 | 0.820 | 0.834 | 0.616 | 0.686 | |||
| PPE | [-] | 103. | 103. | 111. | 165. | -5.95 | 21.8 | 1.19 | 0.682 | 0.566 | 0.823 | 0.814 | 0.612 | 0.677 | |||
| R15 | [-] | 105. | 105. | 111. | 165. | -4.30 | 21.4 | 1.30 | 0.705 | 0.564 | 0.803 | 0.855 | 0.613 | 0.684 |
Download Data |
Period Mean (original grids) [Watt m-2] |
Model Period Mean (intersection) [Watt m-2] |
Model Period Mean (complement) [Watt m-2] |
Benchmark Period Mean (intersection) [Watt m-2] |
Benchmark Period Mean (complement) [Watt m-2] |
Bias [Watt m-2] |
RMSE [Watt m-2] |
Phase Shift [months] |
Bias Score [1] |
RMSE Score [1] |
Seasonal Cycle Score [1] |
Spatial Distribution Score [1] |
Interannual Variability Score [1] |
Overall Score [1] |
|||
|---|---|---|---|---|---|---|---|---|---|---|---|---|---|---|---|---|---|
| Benchmark | [-] | 43.3 | |||||||||||||||
| D104 | [-] | 32.9 | 33.2 | 43.0 | 45.9 | -11.8 | 23.0 | 0.203 | 0.812 | 0.702 | 0.987 | 0.767 | 0.737 | 0.784 | |||
| LMBIRCH4 | [-] | 32.2 | 32.6 | 43.2 | 46.1 | -12.4 | 23.5 | 0.210 | 0.801 | 0.698 | 0.986 | 0.773 | 0.750 | 0.785 | |||
| PHSParam | [-] | 32.0 | 32.4 | 43.2 | 46.1 | -12.7 | 23.9 | 0.231 | 0.798 | 0.696 | 0.985 | 0.755 | 0.752 | 0.780 | |||
| PPE | [-] | 30.8 | 31.2 | 43.2 | 46.1 | -13.8 | 23.8 | 0.210 | 0.784 | 0.703 | 0.986 | 0.794 | 0.744 | 0.785 | |||
| R15 | [-] | 32.6 | 33.0 | 43.2 | 46.1 | -12.2 | 23.6 | 0.227 | 0.805 | 0.697 | 0.985 | 0.778 | 0.750 | 0.785 |
Download Data |
Period Mean (original grids) [Watt m-2] |
Model Period Mean (intersection) [Watt m-2] |
Model Period Mean (complement) [Watt m-2] |
Benchmark Period Mean (intersection) [Watt m-2] |
Benchmark Period Mean (complement) [Watt m-2] |
Bias [Watt m-2] |
RMSE [Watt m-2] |
Phase Shift [months] |
Bias Score [1] |
RMSE Score [1] |
Seasonal Cycle Score [1] |
Spatial Distribution Score [1] |
Interannual Variability Score [1] |
Overall Score [1] |
|||
|---|---|---|---|---|---|---|---|---|---|---|---|---|---|---|---|---|---|
| Benchmark | [-] | 144. | |||||||||||||||
| D104 | [-] | 128. | 128. | 141. | 161. | -6.36 | 21.7 | 0.993 | 0.581 | 0.426 | 0.860 | 0.909 | 0.599 | 0.633 | |||
| LMBIRCH4 | [-] | 128. | 128. | 143. | 161. | -7.66 | 21.9 | 0.951 | 0.573 | 0.425 | 0.868 | 0.927 | 0.588 | 0.634 | |||
| PHSParam | [-] | 128. | 128. | 143. | 161. | -7.63 | 21.9 | 0.970 | 0.573 | 0.424 | 0.864 | 0.925 | 0.589 | 0.633 | |||
| PPE | [-] | 122. | 122. | 143. | 161. | -13.9 | 24.2 | 1.10 | 0.492 | 0.425 | 0.841 | 0.927 | 0.576 | 0.614 | |||
| R15 | [-] | 128. | 128. | 143. | 161. | -7.90 | 21.9 | 0.951 | 0.570 | 0.425 | 0.868 | 0.929 | 0.588 | 0.634 |
Download Data |
Period Mean (original grids) [Watt m-2] |
Model Period Mean (intersection) [Watt m-2] |
Model Period Mean (complement) [Watt m-2] |
Benchmark Period Mean (intersection) [Watt m-2] |
Benchmark Period Mean (complement) [Watt m-2] |
Bias [Watt m-2] |
RMSE [Watt m-2] |
Phase Shift [months] |
Bias Score [1] |
RMSE Score [1] |
Seasonal Cycle Score [1] |
Spatial Distribution Score [1] |
Interannual Variability Score [1] |
Overall Score [1] |
|||
|---|---|---|---|---|---|---|---|---|---|---|---|---|---|---|---|---|---|
| Benchmark | [-] | 62.5 | |||||||||||||||
| D104 | [-] | 48.2 | 48.1 | 61.9 | 69.3 | -13.3 | 22.8 | 0.0877 | 0.791 | 0.724 | 0.994 | 0.918 | 0.658 | 0.801 | |||
| LMBIRCH4 | [-] | 48.8 | 48.7 | 62.4 | 70.5 | -13.2 | 22.7 | 0.112 | 0.793 | 0.726 | 0.993 | 0.959 | 0.654 | 0.808 | |||
| PHSParam | [-] | 48.9 | 48.7 | 62.4 | 70.5 | -13.2 | 22.6 | 0.116 | 0.794 | 0.726 | 0.992 | 0.960 | 0.654 | 0.809 | |||
| PPE | [-] | 46.4 | 46.2 | 62.4 | 70.5 | -15.8 | 23.1 | 0.109 | 0.758 | 0.744 | 0.993 | 0.975 | 0.648 | 0.810 | |||
| R15 | [-] | 48.9 | 48.7 | 62.4 | 70.5 | -13.2 | 22.6 | 0.116 | 0.794 | 0.727 | 0.992 | 0.954 | 0.653 | 0.808 |
Download Data |
Period Mean (original grids) [Watt m-2] |
Model Period Mean (intersection) [Watt m-2] |
Model Period Mean (complement) [Watt m-2] |
Benchmark Period Mean (intersection) [Watt m-2] |
Benchmark Period Mean (complement) [Watt m-2] |
Bias [Watt m-2] |
RMSE [Watt m-2] |
Phase Shift [months] |
Bias Score [1] |
RMSE Score [1] |
Seasonal Cycle Score [1] |
Spatial Distribution Score [1] |
Interannual Variability Score [1] |
Overall Score [1] |
|||
|---|---|---|---|---|---|---|---|---|---|---|---|---|---|---|---|---|---|
| Benchmark | [-] | 72.7 | |||||||||||||||
| D104 | [-] | 62.0 | 62.2 | 71.5 | 103. | -7.62 | 21.7 | 0.467 | 0.798 | 0.649 | 0.963 | 0.991 | 0.637 | 0.781 | |||
| LMBIRCH4 | [-] | 61.9 | 62.1 | 72.5 | 103. | -8.73 | 22.4 | 0.417 | 0.784 | 0.647 | 0.968 | 0.993 | 0.637 | 0.779 | |||
| PHSParam | [-] | 62.3 | 62.5 | 72.5 | 103. | -8.35 | 22.2 | 0.410 | 0.788 | 0.646 | 0.968 | 0.993 | 0.638 | 0.780 | |||
| PPE | [-] | 60.9 | 61.1 | 72.5 | 103. | -9.95 | 22.4 | 0.417 | 0.772 | 0.650 | 0.968 | 0.993 | 0.636 | 0.778 | |||
| R15 | [-] | 62.3 | 62.5 | 72.5 | 103. | -8.38 | 22.1 | 0.407 | 0.790 | 0.647 | 0.968 | 0.993 | 0.631 | 0.779 |
Download Data |
Period Mean (original grids) [Watt m-2] |
Model Period Mean (intersection) [Watt m-2] |
Model Period Mean (complement) [Watt m-2] |
Benchmark Period Mean (intersection) [Watt m-2] |
Benchmark Period Mean (complement) [Watt m-2] |
Bias [Watt m-2] |
RMSE [Watt m-2] |
Phase Shift [months] |
Bias Score [1] |
RMSE Score [1] |
Seasonal Cycle Score [1] |
Spatial Distribution Score [1] |
Interannual Variability Score [1] |
Overall Score [1] |
|||
|---|---|---|---|---|---|---|---|---|---|---|---|---|---|---|---|---|---|
| Benchmark | [-] | 109. | |||||||||||||||
| D104 | [-] | 95.2 | 94.4 | 108. | 158. | -6.38 | 23.6 | 0.536 | 0.698 | 0.532 | 0.951 | 0.969 | 0.563 | 0.708 | |||
| LMBIRCH4 | [-] | 95.3 | 94.4 | 108. | 159. | -6.49 | 24.3 | 0.557 | 0.699 | 0.526 | 0.952 | 0.965 | 0.552 | 0.703 | |||
| PHSParam | [-] | 94.8 | 94.0 | 108. | 159. | -6.94 | 24.3 | 0.567 | 0.700 | 0.526 | 0.950 | 0.959 | 0.554 | 0.703 | |||
| PPE | [-] | 92.3 | 91.5 | 108. | 159. | -9.66 | 25.1 | 0.555 | 0.673 | 0.528 | 0.949 | 0.939 | 0.551 | 0.695 | |||
| R15 | [-] | 94.9 | 94.0 | 108. | 159. | -6.81 | 24.3 | 0.555 | 0.698 | 0.525 | 0.952 | 0.963 | 0.553 | 0.703 |
Download Data |
Period Mean (original grids) [Watt m-2] |
Model Period Mean (intersection) [Watt m-2] |
Model Period Mean (complement) [Watt m-2] |
Benchmark Period Mean (intersection) [Watt m-2] |
Benchmark Period Mean (complement) [Watt m-2] |
Bias [Watt m-2] |
RMSE [Watt m-2] |
Phase Shift [months] |
Bias Score [1] |
RMSE Score [1] |
Seasonal Cycle Score [1] |
Spatial Distribution Score [1] |
Interannual Variability Score [1] |
Overall Score [1] |
|||
|---|---|---|---|---|---|---|---|---|---|---|---|---|---|---|---|---|---|
| Benchmark | [-] | 41.8 | |||||||||||||||
| D104 | [-] | 25.1 | 25.9 | 41.8 | 39.2 | -17.6 | 22.7 | 0.240 | 0.725 | 0.704 | 0.984 | 0.923 | 0.746 | 0.798 | |||
| LMBIRCH4 | [-] | 25.3 | 26.1 | 41.9 | 39.1 | -17.5 | 22.8 | 0.280 | 0.726 | 0.702 | 0.981 | 0.912 | 0.735 | 0.793 | |||
| PHSParam | [-] | 25.1 | 26.0 | 41.9 | 39.1 | -17.7 | 23.0 | 0.255 | 0.724 | 0.701 | 0.983 | 0.912 | 0.739 | 0.793 | |||
| PPE | [-] | 23.9 | 24.7 | 41.9 | 39.1 | -18.8 | 23.1 | 0.255 | 0.708 | 0.710 | 0.983 | 0.924 | 0.731 | 0.794 | |||
| R15 | [-] | 25.8 | 26.6 | 41.9 | 39.1 | -17.1 | 22.6 | 0.262 | 0.733 | 0.701 | 0.983 | 0.917 | 0.736 | 0.795 |
Download Data |
Period Mean (original grids) [Watt m-2] |
Model Period Mean (intersection) [Watt m-2] |
Model Period Mean (complement) [Watt m-2] |
Benchmark Period Mean (intersection) [Watt m-2] |
Benchmark Period Mean (complement) [Watt m-2] |
Bias [Watt m-2] |
RMSE [Watt m-2] |
Phase Shift [months] |
Bias Score [1] |
RMSE Score [1] |
Seasonal Cycle Score [1] |
Spatial Distribution Score [1] |
Interannual Variability Score [1] |
Overall Score [1] |
|||
|---|---|---|---|---|---|---|---|---|---|---|---|---|---|---|---|---|---|
| Benchmark | [-] | 96.5 | |||||||||||||||
| D104 | [-] | 92.8 | 92.8 | 93.8 | 136. | 1.88 | 21.4 | 0.328 | 0.757 | 0.663 | 0.975 | 0.853 | 0.634 | 0.758 | |||
| LMBIRCH4 | [-] | 93.0 | 92.9 | 94.9 | 136. | 0.890 | 21.2 | 0.376 | 0.762 | 0.665 | 0.971 | 0.858 | 0.636 | 0.760 | |||
| PHSParam | [-] | 93.4 | 93.3 | 94.9 | 136. | 1.24 | 21.4 | 0.377 | 0.758 | 0.662 | 0.970 | 0.853 | 0.634 | 0.756 | |||
| PPE | [-] | 91.8 | 91.7 | 94.9 | 136. | -0.670 | 21.7 | 0.379 | 0.753 | 0.664 | 0.970 | 0.831 | 0.629 | 0.752 | |||
| R15 | [-] | 92.6 | 92.5 | 94.9 | 136. | 0.505 | 21.2 | 0.387 | 0.763 | 0.665 | 0.971 | 0.853 | 0.636 | 0.759 |
Download Data |
Period Mean (original grids) [Watt m-2] |
Model Period Mean (intersection) [Watt m-2] |
Model Period Mean (complement) [Watt m-2] |
Benchmark Period Mean (intersection) [Watt m-2] |
Benchmark Period Mean (complement) [Watt m-2] |
Bias [Watt m-2] |
RMSE [Watt m-2] |
Phase Shift [months] |
Bias Score [1] |
RMSE Score [1] |
Seasonal Cycle Score [1] |
Spatial Distribution Score [1] |
Interannual Variability Score [1] |
Overall Score [1] |
|||
|---|---|---|---|---|---|---|---|---|---|---|---|---|---|---|---|---|---|
| Benchmark | [-] | 64.4 | |||||||||||||||
| D104 | [-] | 54.0 | 54.3 | 64.9 | 67.2 | -7.10 | 19.9 | 0.350 | 0.845 | 0.752 | 0.977 | 0.990 | 0.643 | 0.826 | |||
| LMBIRCH4 | [-] | 53.8 | 54.1 | 64.4 | 67.0 | -6.73 | 20.3 | 0.313 | 0.843 | 0.741 | 0.979 | 0.988 | 0.641 | 0.822 | |||
| PHSParam | [-] | 54.4 | 54.7 | 64.4 | 67.0 | -6.20 | 20.4 | 0.304 | 0.844 | 0.739 | 0.980 | 0.986 | 0.640 | 0.821 | |||
| PPE | [-] | 52.1 | 52.4 | 64.4 | 67.0 | -8.66 | 20.7 | 0.270 | 0.825 | 0.748 | 0.982 | 0.987 | 0.637 | 0.821 | |||
| R15 | [-] | 54.1 | 54.4 | 64.4 | 67.0 | -6.56 | 20.2 | 0.305 | 0.847 | 0.742 | 0.980 | 0.991 | 0.638 | 0.823 |
Download Data |
Period Mean (original grids) [Watt m-2] |
Model Period Mean (intersection) [Watt m-2] |
Model Period Mean (complement) [Watt m-2] |
Benchmark Period Mean (intersection) [Watt m-2] |
Benchmark Period Mean (complement) [Watt m-2] |
Bias [Watt m-2] |
RMSE [Watt m-2] |
Phase Shift [months] |
Bias Score [1] |
RMSE Score [1] |
Seasonal Cycle Score [1] |
Spatial Distribution Score [1] |
Interannual Variability Score [1] |
Overall Score [1] |
|||
|---|---|---|---|---|---|---|---|---|---|---|---|---|---|---|---|---|---|
| Benchmark | [-] | 115. | |||||||||||||||
| D104 | [-] | 65.4 | 65.4 | 81.6 | 133. | -12.0 | 25.1 | 0.600 | 0.664 | 0.600 | 0.929 | 0.938 | 0.622 | 0.725 | |||
| LMBIRCH4 | [-] | 65.6 | 65.6 | 81.4 | 133. | -11.6 | 25.3 | 0.601 | 0.670 | 0.597 | 0.928 | 0.934 | 0.619 | 0.724 | |||
| PHSParam | [-] | 65.6 | 65.6 | 81.4 | 133. | -11.6 | 25.3 | 0.580 | 0.668 | 0.596 | 0.932 | 0.934 | 0.620 | 0.725 | |||
| PPE | [-] | 63.7 | 63.7 | 81.4 | 133. | -13.7 | 26.0 | 0.581 | 0.640 | 0.600 | 0.931 | 0.940 | 0.616 | 0.721 | |||
| R15 | [-] | 65.5 | 65.5 | 81.4 | 133. | -11.8 | 25.2 | 0.588 | 0.668 | 0.598 | 0.931 | 0.936 | 0.617 | 0.725 |
Download Data |
Period Mean (original grids) [Watt m-2] |
Model Period Mean (intersection) [Watt m-2] |
Model Period Mean (complement) [Watt m-2] |
Benchmark Period Mean (intersection) [Watt m-2] |
Benchmark Period Mean (complement) [Watt m-2] |
Bias [Watt m-2] |
RMSE [Watt m-2] |
Phase Shift [months] |
Bias Score [1] |
RMSE Score [1] |
Seasonal Cycle Score [1] |
Spatial Distribution Score [1] |
Interannual Variability Score [1] |
Overall Score [1] |
|||
|---|---|---|---|---|---|---|---|---|---|---|---|---|---|---|---|---|---|
| Benchmark | [-] | 54.9 | |||||||||||||||
| D104 | [-] | 54.3 | 53.7 | 55.3 | 145. | 2.09 | 26.3 | 0.880 | 0.667 | 0.535 | 0.888 | 0.834 | 0.564 | 0.671 | |||
| LMBIRCH4 | [-] | 54.2 | 53.7 | 54.1 | 144. | 3.17 | 27.4 | 0.893 | 0.655 | 0.520 | 0.887 | 0.824 | 0.554 | 0.660 | |||
| PHSParam | [-] | 54.4 | 53.9 | 54.1 | 144. | 3.36 | 27.5 | 0.906 | 0.653 | 0.519 | 0.886 | 0.829 | 0.555 | 0.660 | |||
| PPE | [-] | 54.1 | 53.6 | 54.1 | 144. | 3.05 | 27.4 | 0.907 | 0.655 | 0.520 | 0.885 | 0.820 | 0.554 | 0.659 | |||
| R15 | [-] | 54.1 | 53.6 | 54.1 | 144. | 3.07 | 27.4 | 0.903 | 0.655 | 0.520 | 0.886 | 0.823 | 0.552 | 0.659 |
Download Data |
Period Mean (original grids) [Watt m-2] |
Model Period Mean (intersection) [Watt m-2] |
Model Period Mean (complement) [Watt m-2] |
Benchmark Period Mean (intersection) [Watt m-2] |
Benchmark Period Mean (complement) [Watt m-2] |
Bias [Watt m-2] |
RMSE [Watt m-2] |
Phase Shift [months] |
Bias Score [1] |
RMSE Score [1] |
Seasonal Cycle Score [1] |
Spatial Distribution Score [1] |
Interannual Variability Score [1] |
Overall Score [1] |
|||
|---|---|---|---|---|---|---|---|---|---|---|---|---|---|---|---|---|---|
| Benchmark | [-] | 44.9 | |||||||||||||||
| D104 | [-] | 27.7 | 27.6 | 44.6 | 48.2 | -19.4 | 25.2 | 0.115 | 0.710 | 0.718 | 0.992 | 0.881 | 0.789 | 0.801 | |||
| LMBIRCH4 | [-] | 27.4 | 27.3 | 44.8 | 48.3 | -19.7 | 25.7 | 0.107 | 0.706 | 0.712 | 0.993 | 0.873 | 0.779 | 0.796 | |||
| PHSParam | [-] | 27.1 | 27.0 | 44.8 | 48.3 | -20.1 | 26.1 | 0.117 | 0.702 | 0.710 | 0.992 | 0.876 | 0.784 | 0.796 | |||
| PPE | [-] | 26.4 | 26.3 | 44.8 | 48.3 | -20.7 | 26.0 | 0.107 | 0.694 | 0.717 | 0.993 | 0.892 | 0.777 | 0.798 | |||
| R15 | [-] | 28.7 | 28.6 | 44.8 | 48.3 | -18.7 | 24.7 | 0.114 | 0.719 | 0.720 | 0.992 | 0.861 | 0.769 | 0.797 |
Download Data |
Period Mean (original grids) [Watt m-2] |
Model Period Mean (intersection) [Watt m-2] |
Model Period Mean (complement) [Watt m-2] |
Benchmark Period Mean (intersection) [Watt m-2] |
Benchmark Period Mean (complement) [Watt m-2] |
Bias [Watt m-2] |
RMSE [Watt m-2] |
Phase Shift [months] |
Bias Score [1] |
RMSE Score [1] |
Seasonal Cycle Score [1] |
Spatial Distribution Score [1] |
Interannual Variability Score [1] |
Overall Score [1] |
|||
|---|---|---|---|---|---|---|---|---|---|---|---|---|---|---|---|---|---|
| Benchmark | [-] | 134. | |||||||||||||||
| D104 | [-] | 109. | 109. | 133. | 165. | -16.0 | 26.8 | 0.862 | 0.618 | 0.607 | 0.894 | 0.915 | 0.611 | 0.709 | |||
| LMBIRCH4 | [-] | 109. | 109. | 132. | 164. | -14.6 | 26.1 | 0.822 | 0.630 | 0.607 | 0.899 | 0.913 | 0.614 | 0.712 | |||
| PHSParam | [-] | 109. | 109. | 132. | 164. | -14.8 | 26.2 | 0.726 | 0.630 | 0.606 | 0.914 | 0.906 | 0.616 | 0.713 | |||
| PPE | [-] | 107. | 106. | 132. | 164. | -17.7 | 27.5 | 0.725 | 0.603 | 0.607 | 0.916 | 0.880 | 0.613 | 0.704 | |||
| R15 | [-] | 109. | 109. | 132. | 164. | -15.0 | 26.3 | 0.816 | 0.626 | 0.606 | 0.900 | 0.917 | 0.608 | 0.710 |
Download Data |
Period Mean (original grids) [Watt m-2] |
Model Period Mean (intersection) [Watt m-2] |
Model Period Mean (complement) [Watt m-2] |
Benchmark Period Mean (intersection) [Watt m-2] |
Benchmark Period Mean (complement) [Watt m-2] |
Bias [Watt m-2] |
RMSE [Watt m-2] |
Phase Shift [months] |
Bias Score [1] |
RMSE Score [1] |
Seasonal Cycle Score [1] |
Spatial Distribution Score [1] |
Interannual Variability Score [1] |
Overall Score [1] |
|||
|---|---|---|---|---|---|---|---|---|---|---|---|---|---|---|---|---|---|
| Benchmark | [-] | 99.6 | |||||||||||||||
| D104 | [-] | 82.5 | 82.1 | 99.7 | 130. | -14.7 | 22.2 | 0.480 | 0.746 | 0.722 | 0.965 | 0.998 | 0.625 | 0.796 | |||
| LMBIRCH4 | [-] | 83.3 | 82.9 | 99.0 | 129. | -13.2 | 21.4 | 0.337 | 0.769 | 0.719 | 0.975 | 0.994 | 0.625 | 0.800 | |||
| PHSParam | [-] | 83.7 | 83.4 | 99.0 | 129. | -12.8 | 21.2 | 0.337 | 0.775 | 0.720 | 0.975 | 0.992 | 0.623 | 0.801 | |||
| PPE | [-] | 80.2 | 79.9 | 99.0 | 129. | -16.3 | 22.9 | 0.295 | 0.723 | 0.728 | 0.978 | 0.997 | 0.620 | 0.795 | |||
| R15 | [-] | 82.1 | 81.8 | 99.0 | 129. | -14.4 | 22.0 | 0.337 | 0.750 | 0.722 | 0.975 | 0.997 | 0.616 | 0.797 |
Download Data |
Period Mean (original grids) [Watt m-2] |
Model Period Mean (intersection) [Watt m-2] |
Model Period Mean (complement) [Watt m-2] |
Benchmark Period Mean (intersection) [Watt m-2] |
Benchmark Period Mean (complement) [Watt m-2] |
Bias [Watt m-2] |
RMSE [Watt m-2] |
Phase Shift [months] |
Bias Score [1] |
RMSE Score [1] |
Seasonal Cycle Score [1] |
Spatial Distribution Score [1] |
Interannual Variability Score [1] |
Overall Score [1] |
|||
|---|---|---|---|---|---|---|---|---|---|---|---|---|---|---|---|---|---|
| Benchmark | [-] | 72.2 | |||||||||||||||
| D104 | [-] | 58.0 | 57.8 | 72.3 | 78.3 | -14.1 | 21.8 | 0.114 | 0.781 | 0.752 | 0.992 | 0.997 | 0.679 | 0.826 | |||
| LMBIRCH4 | [-] | 57.8 | 57.7 | 72.1 | 77.8 | -14.1 | 21.9 | 0.110 | 0.781 | 0.749 | 0.993 | 0.996 | 0.673 | 0.823 | |||
| PHSParam | [-] | 57.9 | 57.8 | 72.1 | 77.8 | -13.9 | 21.9 | 0.110 | 0.783 | 0.748 | 0.993 | 0.996 | 0.675 | 0.824 | |||
| PPE | [-] | 53.8 | 53.8 | 72.1 | 77.8 | -18.1 | 23.9 | 0.114 | 0.727 | 0.764 | 0.992 | 0.991 | 0.667 | 0.817 | |||
| R15 | [-] | 58.6 | 58.5 | 72.1 | 77.8 | -13.3 | 21.0 | 0.110 | 0.791 | 0.757 | 0.993 | 0.997 | 0.662 | 0.826 |
Download Data |
Period Mean (original grids) [Watt m-2] |
Model Period Mean (intersection) [Watt m-2] |
Model Period Mean (complement) [Watt m-2] |
Benchmark Period Mean (intersection) [Watt m-2] |
Benchmark Period Mean (complement) [Watt m-2] |
Bias [Watt m-2] |
RMSE [Watt m-2] |
Phase Shift [months] |
Bias Score [1] |
RMSE Score [1] |
Seasonal Cycle Score [1] |
Spatial Distribution Score [1] |
Interannual Variability Score [1] |
Overall Score [1] |
|||
|---|---|---|---|---|---|---|---|---|---|---|---|---|---|---|---|---|---|
| Benchmark | [-] | 81.6 | |||||||||||||||
| D104 | [-] | 71.6 | 71.6 | 81.5 | 125. | -9.07 | 21.4 | 0.292 | 0.783 | 0.700 | 0.980 | 0.979 | 0.668 | 0.802 | |||
| LMBIRCH4 | [-] | 71.6 | 71.6 | 81.5 | 125. | -8.98 | 21.4 | 0.312 | 0.782 | 0.699 | 0.977 | 0.989 | 0.669 | 0.803 | |||
| PHSParam | [-] | 72.4 | 72.4 | 81.5 | 125. | -8.17 | 21.2 | 0.312 | 0.791 | 0.696 | 0.977 | 0.990 | 0.668 | 0.803 | |||
| PPE | [-] | 70.8 | 70.8 | 81.5 | 125. | -10.0 | 21.4 | 0.312 | 0.777 | 0.704 | 0.977 | 0.979 | 0.660 | 0.800 | |||
| R15 | [-] | 71.5 | 71.4 | 81.5 | 125. | -9.11 | 21.3 | 0.312 | 0.785 | 0.700 | 0.977 | 0.987 | 0.661 | 0.802 |
Download Data |
Period Mean (original grids) [Watt m-2] |
Model Period Mean (intersection) [Watt m-2] |
Model Period Mean (complement) [Watt m-2] |
Benchmark Period Mean (intersection) [Watt m-2] |
Benchmark Period Mean (complement) [Watt m-2] |
Bias [Watt m-2] |
RMSE [Watt m-2] |
Phase Shift [months] |
Bias Score [1] |
RMSE Score [1] |
Seasonal Cycle Score [1] |
Spatial Distribution Score [1] |
Interannual Variability Score [1] |
Overall Score [1] |
|||
|---|---|---|---|---|---|---|---|---|---|---|---|---|---|---|---|---|---|
| Benchmark | [-] | 132. | |||||||||||||||
| D104 | [-] | 123. | 123. | 133. | 181. | -9.60 | 21.3 | 0.966 | 0.561 | 0.392 | 0.864 | 0.929 | 0.606 | 0.624 | |||
| LMBIRCH4 | [-] | 123. | 123. | 131. | 179. | -7.56 | 20.7 | 1.08 | 0.619 | 0.392 | 0.846 | 0.927 | 0.604 | 0.630 | |||
| PHSParam | [-] | 123. | 123. | 131. | 179. | -7.88 | 20.8 | 0.991 | 0.610 | 0.394 | 0.861 | 0.933 | 0.604 | 0.633 | |||
| PPE | [-] | 117. | 117. | 131. | 179. | -13.6 | 23.5 | 1.04 | 0.462 | 0.396 | 0.852 | 0.928 | 0.596 | 0.605 | |||
| R15 | [-] | 123. | 122. | 131. | 179. | -7.99 | 20.9 | 1.06 | 0.608 | 0.393 | 0.850 | 0.931 | 0.604 | 0.630 |
Download Data |
Period Mean (original grids) [Watt m-2] |
Model Period Mean (intersection) [Watt m-2] |
Model Period Mean (complement) [Watt m-2] |
Benchmark Period Mean (intersection) [Watt m-2] |
Benchmark Period Mean (complement) [Watt m-2] |
Bias [Watt m-2] |
RMSE [Watt m-2] |
Phase Shift [months] |
Bias Score [1] |
RMSE Score [1] |
Seasonal Cycle Score [1] |
Spatial Distribution Score [1] |
Interannual Variability Score [1] |
Overall Score [1] |
|||
|---|---|---|---|---|---|---|---|---|---|---|---|---|---|---|---|---|---|
| Benchmark | [-] | 117. | |||||||||||||||
| D104 | [-] | 109. | 109. | 118. | 139. | -8.48 | 20.8 | 0.947 | 0.725 | 0.562 | 0.871 | 0.932 | 0.611 | 0.711 | |||
| LMBIRCH4 | [-] | 110. | 110. | 117. | 138. | -6.53 | 20.2 | 1.10 | 0.758 | 0.558 | 0.845 | 0.955 | 0.617 | 0.715 | |||
| PHSParam | [-] | 109. | 109. | 117. | 138. | -7.01 | 20.3 | 0.999 | 0.748 | 0.561 | 0.864 | 0.943 | 0.616 | 0.715 | |||
| PPE | [-] | 107. | 107. | 117. | 138. | -8.88 | 20.7 | 0.986 | 0.725 | 0.564 | 0.868 | 0.949 | 0.613 | 0.714 | |||
| R15 | [-] | 109. | 109. | 117. | 138. | -7.62 | 20.6 | 0.969 | 0.737 | 0.559 | 0.870 | 0.950 | 0.618 | 0.715 |
Download Data |
Period Mean (original grids) [Watt m-2] |
Model Period Mean (intersection) [Watt m-2] |
Model Period Mean (complement) [Watt m-2] |
Benchmark Period Mean (intersection) [Watt m-2] |
Benchmark Period Mean (complement) [Watt m-2] |
Bias [Watt m-2] |
RMSE [Watt m-2] |
Phase Shift [months] |
Bias Score [1] |
RMSE Score [1] |
Seasonal Cycle Score [1] |
Spatial Distribution Score [1] |
Interannual Variability Score [1] |
Overall Score [1] |
|||
|---|---|---|---|---|---|---|---|---|---|---|---|---|---|---|---|---|---|
| Benchmark | [-] | 95.7 | |||||||||||||||
| D104 | [-] | 91.1 | 90.2 | 93.7 | 132. | -4.10 | 25.7 | 0.468 | 0.733 | 0.679 | 0.953 | 0.984 | 0.571 | 0.767 | |||
| LMBIRCH4 | [-] | 91.2 | 90.3 | 94.0 | 132. | -4.36 | 25.9 | 0.457 | 0.736 | 0.675 | 0.955 | 0.986 | 0.565 | 0.765 | |||
| PHSParam | [-] | 91.5 | 90.6 | 94.0 | 132. | -4.13 | 25.9 | 0.442 | 0.735 | 0.675 | 0.957 | 0.986 | 0.567 | 0.766 | |||
| PPE | [-] | 89.3 | 88.5 | 94.0 | 132. | -6.27 | 26.5 | 0.446 | 0.722 | 0.675 | 0.956 | 0.986 | 0.563 | 0.763 | |||
| R15 | [-] | 91.1 | 90.3 | 94.0 | 132. | -4.41 | 25.9 | 0.439 | 0.733 | 0.676 | 0.955 | 0.986 | 0.562 | 0.765 |
Temporally integrated period mean