Mean State
Download Data |
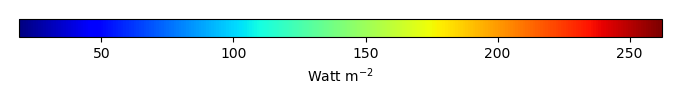
Period Mean (original grids) [Watt m-2] |
Model Period Mean (intersection) [Watt m-2] |
Model Period Mean (complement) [Watt m-2] |
Benchmark Period Mean (intersection) [Watt m-2] |
Benchmark Period Mean (complement) [Watt m-2] |
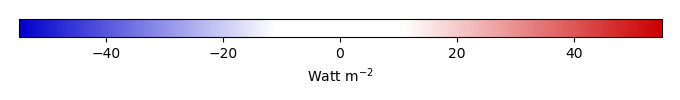
Bias [Watt m-2] |
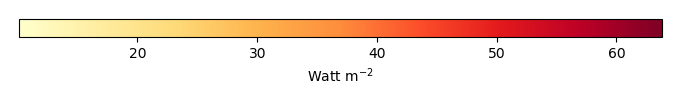
RMSE [Watt m-2] |
Phase Shift [months] |
Bias Score [1] |
RMSE Score [1] |
Seasonal Cycle Score [1] |
Spatial Distribution Score [1] |
Interannual Variability Score [1] |
Overall Score [1] |
|||
|---|---|---|---|---|---|---|---|---|---|---|---|---|---|---|---|---|---|
| Benchmark | [-] | 179. | |||||||||||||||
| D104 | [-] | 182. | 182. | 179. | 223. | 3.84 | 17.5 | 0.586 | 0.648 | 0.523 | 0.922 | 0.872 | 0.713 | 0.700 | |||
| LMBIRCH4 | [-] | 182. | 182. | 178. | 223. | 4.42 | 17.6 | 0.574 | 0.625 | 0.515 | 0.924 | 0.875 | 0.725 | 0.696 | |||
| PHSParam | [-] | 182. | 182. | 178. | 223. | 4.27 | 17.6 | 0.567 | 0.629 | 0.515 | 0.926 | 0.881 | 0.726 | 0.698 | |||
| PPE | [-] | 177. | 177. | 178. | 223. | -0.531 | 16.5 | 0.605 | 0.716 | 0.516 | 0.919 | 0.938 | 0.714 | 0.720 | |||
| R15 | [-] | 182. | 183. | 178. | 223. | 4.62 | 17.8 | 0.572 | 0.618 | 0.514 | 0.924 | 0.874 | 0.726 | 0.695 |
Download Data |
Period Mean (original grids) [Watt m-2] |
Model Period Mean (intersection) [Watt m-2] |
Model Period Mean (complement) [Watt m-2] |
Benchmark Period Mean (intersection) [Watt m-2] |
Benchmark Period Mean (complement) [Watt m-2] |
Bias [Watt m-2] |
RMSE [Watt m-2] |
Phase Shift [months] |
Bias Score [1] |
RMSE Score [1] |
Seasonal Cycle Score [1] |
Spatial Distribution Score [1] |
Interannual Variability Score [1] |
Overall Score [1] |
|||
|---|---|---|---|---|---|---|---|---|---|---|---|---|---|---|---|---|---|
| Benchmark | [-] | 189. | |||||||||||||||
| D104 | [-] | 196. | 195. | 190. | 214. | 5.16 | 16.3 | 0.581 | 0.703 | 0.537 | 0.929 | 0.972 | 0.795 | 0.745 | |||
| LMBIRCH4 | [-] | 196. | 195. | 189. | 214. | 6.65 | 17.0 | 0.555 | 0.665 | 0.528 | 0.935 | 0.979 | 0.779 | 0.736 | |||
| PHSParam | [-] | 196. | 195. | 189. | 214. | 6.84 | 17.0 | 0.527 | 0.660 | 0.531 | 0.940 | 0.979 | 0.781 | 0.737 | |||
| PPE | [-] | 195. | 194. | 189. | 214. | 5.40 | 16.5 | 0.501 | 0.690 | 0.530 | 0.943 | 0.970 | 0.778 | 0.740 | |||
| R15 | [-] | 196. | 195. | 189. | 214. | 6.72 | 17.0 | 0.549 | 0.664 | 0.528 | 0.937 | 0.979 | 0.779 | 0.736 |
Download Data |
Period Mean (original grids) [Watt m-2] |
Model Period Mean (intersection) [Watt m-2] |
Model Period Mean (complement) [Watt m-2] |
Benchmark Period Mean (intersection) [Watt m-2] |
Benchmark Period Mean (complement) [Watt m-2] |
Bias [Watt m-2] |
RMSE [Watt m-2] |
Phase Shift [months] |
Bias Score [1] |
RMSE Score [1] |
Seasonal Cycle Score [1] |
Spatial Distribution Score [1] |
Interannual Variability Score [1] |
Overall Score [1] |
|||
|---|---|---|---|---|---|---|---|---|---|---|---|---|---|---|---|---|---|
| Benchmark | [-] | 194. | |||||||||||||||
| D104 | [-] | 197. | 196. | 194. | 227. | 1.53 | 18.9 | 0.574 | 0.740 | 0.565 | 0.921 | 0.930 | 0.663 | 0.731 | |||
| LMBIRCH4 | [-] | 196. | 196. | 193. | 227. | 2.90 | 19.4 | 0.530 | 0.712 | 0.559 | 0.927 | 0.932 | 0.664 | 0.725 | |||
| PHSParam | [-] | 197. | 196. | 193. | 227. | 3.01 | 19.5 | 0.575 | 0.709 | 0.557 | 0.920 | 0.936 | 0.665 | 0.724 | |||
| PPE | [-] | 194. | 193. | 193. | 227. | 0.324 | 18.9 | 0.570 | 0.756 | 0.558 | 0.921 | 0.931 | 0.660 | 0.731 | |||
| R15 | [-] | 197. | 196. | 193. | 227. | 3.18 | 19.5 | 0.568 | 0.706 | 0.558 | 0.921 | 0.931 | 0.665 | 0.723 |
Download Data |
Period Mean (original grids) [Watt m-2] |
Model Period Mean (intersection) [Watt m-2] |
Model Period Mean (complement) [Watt m-2] |
Benchmark Period Mean (intersection) [Watt m-2] |
Benchmark Period Mean (complement) [Watt m-2] |
Bias [Watt m-2] |
RMSE [Watt m-2] |
Phase Shift [months] |
Bias Score [1] |
RMSE Score [1] |
Seasonal Cycle Score [1] |
Spatial Distribution Score [1] |
Interannual Variability Score [1] |
Overall Score [1] |
|||
|---|---|---|---|---|---|---|---|---|---|---|---|---|---|---|---|---|---|
| Benchmark | [-] | 81.3 | |||||||||||||||
| D104 | [-] | 72.3 | 72.7 | 80.8 | 86.0 | -8.96 | 20.1 | 0.260 | 0.872 | 0.756 | 0.983 | 0.933 | 0.676 | 0.829 | |||
| LMBIRCH4 | [-] | 72.0 | 72.5 | 81.1 | 86.1 | -9.41 | 20.3 | 0.281 | 0.867 | 0.755 | 0.981 | 0.925 | 0.691 | 0.829 | |||
| PHSParam | [-] | 71.6 | 72.1 | 81.1 | 86.1 | -9.80 | 20.7 | 0.291 | 0.862 | 0.751 | 0.981 | 0.921 | 0.691 | 0.826 | |||
| PPE | [-] | 69.9 | 70.4 | 81.1 | 86.1 | -11.4 | 20.5 | 0.283 | 0.845 | 0.758 | 0.981 | 0.952 | 0.680 | 0.829 | |||
| R15 | [-] | 72.0 | 72.5 | 81.1 | 86.1 | -9.44 | 20.5 | 0.282 | 0.866 | 0.752 | 0.981 | 0.943 | 0.689 | 0.831 |
Download Data |
Period Mean (original grids) [Watt m-2] |
Model Period Mean (intersection) [Watt m-2] |
Model Period Mean (complement) [Watt m-2] |
Benchmark Period Mean (intersection) [Watt m-2] |
Benchmark Period Mean (complement) [Watt m-2] |
Bias [Watt m-2] |
RMSE [Watt m-2] |
Phase Shift [months] |
Bias Score [1] |
RMSE Score [1] |
Seasonal Cycle Score [1] |
Spatial Distribution Score [1] |
Interannual Variability Score [1] |
Overall Score [1] |
|||
|---|---|---|---|---|---|---|---|---|---|---|---|---|---|---|---|---|---|
| Benchmark | [-] | 189. | |||||||||||||||
| D104 | [-] | 177. | 177. | 185. | 210. | -2.22 | 22.7 | 0.799 | 0.557 | 0.454 | 0.887 | 0.758 | 0.700 | 0.635 | |||
| LMBIRCH4 | [-] | 178. | 177. | 187. | 210. | -3.42 | 22.4 | 0.816 | 0.585 | 0.452 | 0.883 | 0.776 | 0.685 | 0.639 | |||
| PHSParam | [-] | 177. | 177. | 187. | 210. | -3.64 | 22.4 | 0.816 | 0.586 | 0.452 | 0.883 | 0.773 | 0.684 | 0.638 | |||
| PPE | [-] | 170. | 170. | 187. | 210. | -10.4 | 23.5 | 0.812 | 0.607 | 0.454 | 0.883 | 0.802 | 0.668 | 0.645 | |||
| R15 | [-] | 178. | 177. | 187. | 210. | -3.30 | 22.3 | 0.816 | 0.584 | 0.452 | 0.883 | 0.776 | 0.685 | 0.639 |
Download Data |
Period Mean (original grids) [Watt m-2] |
Model Period Mean (intersection) [Watt m-2] |
Model Period Mean (complement) [Watt m-2] |
Benchmark Period Mean (intersection) [Watt m-2] |
Benchmark Period Mean (complement) [Watt m-2] |
Bias [Watt m-2] |
RMSE [Watt m-2] |
Phase Shift [months] |
Bias Score [1] |
RMSE Score [1] |
Seasonal Cycle Score [1] |
Spatial Distribution Score [1] |
Interannual Variability Score [1] |
Overall Score [1] |
|||
|---|---|---|---|---|---|---|---|---|---|---|---|---|---|---|---|---|---|
| Benchmark | [-] | 105. | |||||||||||||||
| D104 | [-] | 101. | 101. | 104. | 115. | -2.96 | 16.2 | 0.137 | 0.935 | 0.802 | 0.991 | 0.995 | 0.635 | 0.860 | |||
| LMBIRCH4 | [-] | 101. | 101. | 105. | 116. | -3.17 | 15.9 | 0.0904 | 0.937 | 0.804 | 0.994 | 0.999 | 0.634 | 0.862 | |||
| PHSParam | [-] | 101. | 101. | 105. | 116. | -3.10 | 15.9 | 0.0925 | 0.938 | 0.804 | 0.994 | 0.999 | 0.634 | 0.862 | |||
| PPE | [-] | 98.0 | 97.6 | 105. | 116. | -6.45 | 16.0 | 0.0931 | 0.907 | 0.814 | 0.994 | 0.999 | 0.619 | 0.858 | |||
| R15 | [-] | 101. | 101. | 105. | 116. | -3.10 | 15.9 | 0.0925 | 0.937 | 0.805 | 0.994 | 0.999 | 0.632 | 0.862 |
Download Data |
Period Mean (original grids) [Watt m-2] |
Model Period Mean (intersection) [Watt m-2] |
Model Period Mean (complement) [Watt m-2] |
Benchmark Period Mean (intersection) [Watt m-2] |
Benchmark Period Mean (complement) [Watt m-2] |
Bias [Watt m-2] |
RMSE [Watt m-2] |
Phase Shift [months] |
Bias Score [1] |
RMSE Score [1] |
Seasonal Cycle Score [1] |
Spatial Distribution Score [1] |
Interannual Variability Score [1] |
Overall Score [1] |
|||
|---|---|---|---|---|---|---|---|---|---|---|---|---|---|---|---|---|---|
| Benchmark | [-] | 140. | |||||||||||||||
| D104 | [-] | 135. | 135. | 139. | 162. | -3.13 | 17.4 | 0.270 | 0.879 | 0.742 | 0.977 | 0.997 | 0.625 | 0.827 | |||
| LMBIRCH4 | [-] | 135. | 135. | 140. | 162. | -4.22 | 17.7 | 0.261 | 0.878 | 0.740 | 0.978 | 0.996 | 0.629 | 0.827 | |||
| PHSParam | [-] | 135. | 135. | 140. | 162. | -4.06 | 17.6 | 0.258 | 0.879 | 0.740 | 0.978 | 0.996 | 0.629 | 0.827 | |||
| PPE | [-] | 133. | 133. | 140. | 162. | -5.81 | 17.8 | 0.252 | 0.875 | 0.742 | 0.978 | 0.997 | 0.625 | 0.826 | |||
| R15 | [-] | 135. | 135. | 140. | 162. | -3.94 | 17.6 | 0.264 | 0.881 | 0.741 | 0.977 | 0.997 | 0.626 | 0.827 |
Download Data |
Period Mean (original grids) [Watt m-2] |
Model Period Mean (intersection) [Watt m-2] |
Model Period Mean (complement) [Watt m-2] |
Benchmark Period Mean (intersection) [Watt m-2] |
Benchmark Period Mean (complement) [Watt m-2] |
Bias [Watt m-2] |
RMSE [Watt m-2] |
Phase Shift [months] |
Bias Score [1] |
RMSE Score [1] |
Seasonal Cycle Score [1] |
Spatial Distribution Score [1] |
Interannual Variability Score [1] |
Overall Score [1] |
|||
|---|---|---|---|---|---|---|---|---|---|---|---|---|---|---|---|---|---|
| Benchmark | [-] | 180. | |||||||||||||||
| D104 | [-] | 175. | 175. | 178. | 214. | -0.759 | 20.3 | 0.270 | 0.765 | 0.612 | 0.981 | 0.914 | 0.629 | 0.752 | |||
| LMBIRCH4 | [-] | 175. | 175. | 179. | 215. | -2.14 | 20.1 | 0.278 | 0.782 | 0.611 | 0.981 | 0.927 | 0.625 | 0.756 | |||
| PHSParam | [-] | 175. | 175. | 179. | 215. | -2.24 | 20.2 | 0.276 | 0.782 | 0.610 | 0.981 | 0.922 | 0.624 | 0.755 | |||
| PPE | [-] | 171. | 171. | 179. | 215. | -5.84 | 20.5 | 0.268 | 0.780 | 0.611 | 0.981 | 0.926 | 0.619 | 0.755 | |||
| R15 | [-] | 175. | 175. | 179. | 215. | -1.96 | 20.2 | 0.279 | 0.780 | 0.611 | 0.981 | 0.926 | 0.625 | 0.755 |
Download Data |
Period Mean (original grids) [Watt m-2] |
Model Period Mean (intersection) [Watt m-2] |
Model Period Mean (complement) [Watt m-2] |
Benchmark Period Mean (intersection) [Watt m-2] |
Benchmark Period Mean (complement) [Watt m-2] |
Bias [Watt m-2] |
RMSE [Watt m-2] |
Phase Shift [months] |
Bias Score [1] |
RMSE Score [1] |
Seasonal Cycle Score [1] |
Spatial Distribution Score [1] |
Interannual Variability Score [1] |
Overall Score [1] |
|||
|---|---|---|---|---|---|---|---|---|---|---|---|---|---|---|---|---|---|
| Benchmark | [-] | 74.6 | |||||||||||||||
| D104 | [-] | 64.7 | 65.7 | 74.2 | 70.5 | -10.2 | 18.9 | 0.370 | 0.854 | 0.741 | 0.975 | 0.930 | 0.671 | 0.819 | |||
| LMBIRCH4 | [-] | 64.7 | 65.7 | 74.6 | 70.6 | -10.6 | 18.6 | 0.339 | 0.850 | 0.744 | 0.978 | 0.909 | 0.663 | 0.815 | |||
| PHSParam | [-] | 64.6 | 65.6 | 74.6 | 70.6 | -10.7 | 18.8 | 0.344 | 0.848 | 0.742 | 0.977 | 0.912 | 0.667 | 0.815 | |||
| PPE | [-] | 62.9 | 63.9 | 74.6 | 70.6 | -12.3 | 18.3 | 0.336 | 0.830 | 0.751 | 0.978 | 0.929 | 0.651 | 0.815 | |||
| R15 | [-] | 65.1 | 66.1 | 74.6 | 70.6 | -10.3 | 18.8 | 0.351 | 0.854 | 0.742 | 0.977 | 0.923 | 0.663 | 0.817 |
Download Data |
Period Mean (original grids) [Watt m-2] |
Model Period Mean (intersection) [Watt m-2] |
Model Period Mean (complement) [Watt m-2] |
Benchmark Period Mean (intersection) [Watt m-2] |
Benchmark Period Mean (complement) [Watt m-2] |
Bias [Watt m-2] |
RMSE [Watt m-2] |
Phase Shift [months] |
Bias Score [1] |
RMSE Score [1] |
Seasonal Cycle Score [1] |
Spatial Distribution Score [1] |
Interannual Variability Score [1] |
Overall Score [1] |
|||
|---|---|---|---|---|---|---|---|---|---|---|---|---|---|---|---|---|---|
| Benchmark | [-] | 193. | |||||||||||||||
| D104 | [-] | 192. | 192. | 191. | 201. | -0.270 | 19.1 | 0.233 | 0.824 | 0.699 | 0.982 | 0.997 | 0.617 | 0.803 | |||
| LMBIRCH4 | [-] | 192. | 192. | 193. | 202. | -2.38 | 18.9 | 0.235 | 0.840 | 0.702 | 0.983 | 0.996 | 0.616 | 0.807 | |||
| PHSParam | [-] | 192. | 193. | 193. | 202. | -2.22 | 18.9 | 0.243 | 0.839 | 0.703 | 0.982 | 0.996 | 0.618 | 0.807 | |||
| PPE | [-] | 189. | 189. | 193. | 202. | -5.39 | 19.2 | 0.205 | 0.840 | 0.704 | 0.984 | 0.998 | 0.613 | 0.807 | |||
| R15 | [-] | 192. | 192. | 193. | 202. | -2.29 | 18.9 | 0.235 | 0.840 | 0.702 | 0.982 | 0.996 | 0.616 | 0.806 |
Download Data |
Period Mean (original grids) [Watt m-2] |
Model Period Mean (intersection) [Watt m-2] |
Model Period Mean (complement) [Watt m-2] |
Benchmark Period Mean (intersection) [Watt m-2] |
Benchmark Period Mean (complement) [Watt m-2] |
Bias [Watt m-2] |
RMSE [Watt m-2] |
Phase Shift [months] |
Bias Score [1] |
RMSE Score [1] |
Seasonal Cycle Score [1] |
Spatial Distribution Score [1] |
Interannual Variability Score [1] |
Overall Score [1] |
|||
|---|---|---|---|---|---|---|---|---|---|---|---|---|---|---|---|---|---|
| Benchmark | [-] | 120. | |||||||||||||||
| D104 | [-] | 112. | 113. | 121. | 120. | -4.18 | 17.2 | 0.451 | 0.895 | 0.807 | 0.969 | 0.997 | 0.627 | 0.850 | |||
| LMBIRCH4 | [-] | 112. | 112. | 120. | 119. | -3.31 | 17.7 | 0.367 | 0.893 | 0.798 | 0.975 | 0.997 | 0.628 | 0.848 | |||
| PHSParam | [-] | 112. | 112. | 120. | 119. | -3.12 | 17.7 | 0.350 | 0.893 | 0.798 | 0.976 | 0.997 | 0.627 | 0.848 | |||
| PPE | [-] | 109. | 110. | 120. | 119. | -5.93 | 17.8 | 0.289 | 0.885 | 0.802 | 0.979 | 0.997 | 0.619 | 0.847 | |||
| R15 | [-] | 112. | 112. | 120. | 119. | -3.04 | 17.5 | 0.371 | 0.894 | 0.800 | 0.974 | 0.997 | 0.626 | 0.848 |
Download Data |
Period Mean (original grids) [Watt m-2] |
Model Period Mean (intersection) [Watt m-2] |
Model Period Mean (complement) [Watt m-2] |
Benchmark Period Mean (intersection) [Watt m-2] |
Benchmark Period Mean (complement) [Watt m-2] |
Bias [Watt m-2] |
RMSE [Watt m-2] |
Phase Shift [months] |
Bias Score [1] |
RMSE Score [1] |
Seasonal Cycle Score [1] |
Spatial Distribution Score [1] |
Interannual Variability Score [1] |
Overall Score [1] |
|||
|---|---|---|---|---|---|---|---|---|---|---|---|---|---|---|---|---|---|
| Benchmark | [-] | 168. | |||||||||||||||
| D104 | [-] | 136. | 136. | 146. | 180. | -7.55 | 20.5 | 0.327 | 0.765 | 0.670 | 0.967 | 0.975 | 0.624 | 0.778 | |||
| LMBIRCH4 | [-] | 136. | 136. | 146. | 180. | -7.51 | 20.6 | 0.311 | 0.765 | 0.667 | 0.968 | 0.972 | 0.623 | 0.777 | |||
| PHSParam | [-] | 136. | 136. | 146. | 180. | -7.51 | 20.6 | 0.315 | 0.764 | 0.667 | 0.968 | 0.972 | 0.624 | 0.777 | |||
| PPE | [-] | 134. | 134. | 146. | 180. | -10.0 | 21.0 | 0.308 | 0.754 | 0.669 | 0.968 | 0.977 | 0.617 | 0.776 | |||
| R15 | [-] | 137. | 137. | 146. | 180. | -7.29 | 20.5 | 0.314 | 0.765 | 0.668 | 0.968 | 0.972 | 0.622 | 0.777 |
Download Data |
Period Mean (original grids) [Watt m-2] |
Model Period Mean (intersection) [Watt m-2] |
Model Period Mean (complement) [Watt m-2] |
Benchmark Period Mean (intersection) [Watt m-2] |
Benchmark Period Mean (complement) [Watt m-2] |
Bias [Watt m-2] |
RMSE [Watt m-2] |
Phase Shift [months] |
Bias Score [1] |
RMSE Score [1] |
Seasonal Cycle Score [1] |
Spatial Distribution Score [1] |
Interannual Variability Score [1] |
Overall Score [1] |
|||
|---|---|---|---|---|---|---|---|---|---|---|---|---|---|---|---|---|---|
| Benchmark | [-] | 175. | |||||||||||||||
| D104 | [-] | 161. | 161. | 176. | 222. | -13.2 | 22.2 | 0.378 | 0.675 | 0.729 | 0.966 | 0.989 | 0.589 | 0.780 | |||
| LMBIRCH4 | [-] | 161. | 161. | 175. | 221. | -11.9 | 21.8 | 0.352 | 0.687 | 0.723 | 0.967 | 0.988 | 0.580 | 0.778 | |||
| PHSParam | [-] | 161. | 161. | 175. | 221. | -11.8 | 21.8 | 0.342 | 0.687 | 0.723 | 0.969 | 0.989 | 0.581 | 0.779 | |||
| PPE | [-] | 161. | 161. | 175. | 221. | -12.3 | 21.8 | 0.331 | 0.687 | 0.724 | 0.970 | 0.988 | 0.580 | 0.779 | |||
| R15 | [-] | 161. | 161. | 175. | 221. | -11.9 | 21.8 | 0.349 | 0.687 | 0.723 | 0.967 | 0.989 | 0.581 | 0.778 |
Download Data |
Period Mean (original grids) [Watt m-2] |
Model Period Mean (intersection) [Watt m-2] |
Model Period Mean (complement) [Watt m-2] |
Benchmark Period Mean (intersection) [Watt m-2] |
Benchmark Period Mean (complement) [Watt m-2] |
Bias [Watt m-2] |
RMSE [Watt m-2] |
Phase Shift [months] |
Bias Score [1] |
RMSE Score [1] |
Seasonal Cycle Score [1] |
Spatial Distribution Score [1] |
Interannual Variability Score [1] |
Overall Score [1] |
|||
|---|---|---|---|---|---|---|---|---|---|---|---|---|---|---|---|---|---|
| Benchmark | [-] | 80.0 | |||||||||||||||
| D104 | [-] | 70.4 | 70.3 | 79.8 | 86.5 | -11.3 | 19.9 | 0.0935 | 0.835 | 0.762 | 0.994 | 0.912 | 0.728 | 0.832 | |||
| LMBIRCH4 | [-] | 70.0 | 69.9 | 79.9 | 86.6 | -11.6 | 20.3 | 0.0921 | 0.832 | 0.758 | 0.994 | 0.910 | 0.731 | 0.830 | |||
| PHSParam | [-] | 69.8 | 69.6 | 79.9 | 86.6 | -11.9 | 20.7 | 0.0938 | 0.828 | 0.754 | 0.994 | 0.912 | 0.736 | 0.830 | |||
| PPE | [-] | 68.8 | 68.6 | 79.9 | 86.6 | -12.7 | 20.4 | 0.0913 | 0.822 | 0.761 | 0.994 | 0.932 | 0.722 | 0.832 | |||
| R15 | [-] | 71.3 | 71.2 | 79.9 | 86.6 | -10.5 | 19.5 | 0.0962 | 0.842 | 0.763 | 0.994 | 0.901 | 0.719 | 0.830 |
Download Data |
Period Mean (original grids) [Watt m-2] |
Model Period Mean (intersection) [Watt m-2] |
Model Period Mean (complement) [Watt m-2] |
Benchmark Period Mean (intersection) [Watt m-2] |
Benchmark Period Mean (complement) [Watt m-2] |
Bias [Watt m-2] |
RMSE [Watt m-2] |
Phase Shift [months] |
Bias Score [1] |
RMSE Score [1] |
Seasonal Cycle Score [1] |
Spatial Distribution Score [1] |
Interannual Variability Score [1] |
Overall Score [1] |
|||
|---|---|---|---|---|---|---|---|---|---|---|---|---|---|---|---|---|---|
| Benchmark | [-] | 205. | |||||||||||||||
| D104 | [-] | 193. | 194. | 205. | 219. | -8.60 | 23.1 | 0.279 | 0.708 | 0.638 | 0.971 | 0.839 | 0.621 | 0.736 | |||
| LMBIRCH4 | [-] | 193. | 194. | 204. | 218. | -6.98 | 22.8 | 0.287 | 0.711 | 0.635 | 0.970 | 0.834 | 0.619 | 0.734 | |||
| PHSParam | [-] | 193. | 194. | 204. | 218. | -7.13 | 22.9 | 0.281 | 0.712 | 0.634 | 0.971 | 0.837 | 0.619 | 0.735 | |||
| PPE | [-] | 189. | 190. | 204. | 218. | -11.2 | 24.0 | 0.323 | 0.692 | 0.635 | 0.963 | 0.839 | 0.613 | 0.729 | |||
| R15 | [-] | 194. | 194. | 204. | 218. | -6.80 | 22.8 | 0.287 | 0.712 | 0.635 | 0.970 | 0.838 | 0.619 | 0.735 |
Download Data |
Period Mean (original grids) [Watt m-2] |
Model Period Mean (intersection) [Watt m-2] |
Model Period Mean (complement) [Watt m-2] |
Benchmark Period Mean (intersection) [Watt m-2] |
Benchmark Period Mean (complement) [Watt m-2] |
Bias [Watt m-2] |
RMSE [Watt m-2] |
Phase Shift [months] |
Bias Score [1] |
RMSE Score [1] |
Seasonal Cycle Score [1] |
Spatial Distribution Score [1] |
Interannual Variability Score [1] |
Overall Score [1] |
|||
|---|---|---|---|---|---|---|---|---|---|---|---|---|---|---|---|---|---|
| Benchmark | [-] | 153. | |||||||||||||||
| D104 | [-] | 144. | 144. | 153. | 189. | -6.30 | 17.1 | 0.237 | 0.889 | 0.764 | 0.984 | 0.999 | 0.617 | 0.836 | |||
| LMBIRCH4 | [-] | 144. | 144. | 152. | 188. | -5.45 | 16.8 | 0.196 | 0.897 | 0.766 | 0.987 | 0.999 | 0.615 | 0.838 | |||
| PHSParam | [-] | 144. | 144. | 152. | 188. | -5.35 | 16.8 | 0.196 | 0.898 | 0.766 | 0.987 | 0.999 | 0.615 | 0.839 | |||
| PPE | [-] | 140. | 140. | 152. | 188. | -9.27 | 18.2 | 0.180 | 0.849 | 0.766 | 0.988 | 0.999 | 0.609 | 0.830 | |||
| R15 | [-] | 144. | 144. | 152. | 188. | -5.39 | 16.5 | 0.196 | 0.899 | 0.768 | 0.987 | 0.999 | 0.609 | 0.839 |
Download Data |
Period Mean (original grids) [Watt m-2] |
Model Period Mean (intersection) [Watt m-2] |
Model Period Mean (complement) [Watt m-2] |
Benchmark Period Mean (intersection) [Watt m-2] |
Benchmark Period Mean (complement) [Watt m-2] |
Bias [Watt m-2] |
RMSE [Watt m-2] |
Phase Shift [months] |
Bias Score [1] |
RMSE Score [1] |
Seasonal Cycle Score [1] |
Spatial Distribution Score [1] |
Interannual Variability Score [1] |
Overall Score [1] |
|||
|---|---|---|---|---|---|---|---|---|---|---|---|---|---|---|---|---|---|
| Benchmark | [-] | 115. | |||||||||||||||
| D104 | [-] | 111. | 110. | 115. | 124. | -4.34 | 15.4 | 0.0859 | 0.915 | 0.824 | 0.994 | 0.999 | 0.648 | 0.867 | |||
| LMBIRCH4 | [-] | 110. | 110. | 115. | 123. | -4.00 | 15.6 | 0.110 | 0.916 | 0.820 | 0.993 | 0.999 | 0.646 | 0.865 | |||
| PHSParam | [-] | 110. | 110. | 115. | 123. | -3.97 | 15.6 | 0.108 | 0.916 | 0.819 | 0.993 | 0.999 | 0.647 | 0.865 | |||
| PPE | [-] | 106. | 106. | 115. | 123. | -8.52 | 16.8 | 0.120 | 0.878 | 0.822 | 0.992 | 0.988 | 0.629 | 0.855 | |||
| R15 | [-] | 112. | 111. | 115. | 123. | -2.98 | 14.8 | 0.108 | 0.924 | 0.825 | 0.993 | 0.999 | 0.635 | 0.867 |
Download Data |
Period Mean (original grids) [Watt m-2] |
Model Period Mean (intersection) [Watt m-2] |
Model Period Mean (complement) [Watt m-2] |
Benchmark Period Mean (intersection) [Watt m-2] |
Benchmark Period Mean (complement) [Watt m-2] |
Bias [Watt m-2] |
RMSE [Watt m-2] |
Phase Shift [months] |
Bias Score [1] |
RMSE Score [1] |
Seasonal Cycle Score [1] |
Spatial Distribution Score [1] |
Interannual Variability Score [1] |
Overall Score [1] |
|||
|---|---|---|---|---|---|---|---|---|---|---|---|---|---|---|---|---|---|
| Benchmark | [-] | 162. | |||||||||||||||
| D104 | [-] | 158. | 158. | 162. | 197. | -4.35 | 16.1 | 0.162 | 0.914 | 0.806 | 0.989 | 0.999 | 0.662 | 0.863 | |||
| LMBIRCH4 | [-] | 158. | 158. | 162. | 197. | -3.80 | 15.9 | 0.189 | 0.919 | 0.805 | 0.988 | 0.998 | 0.657 | 0.862 | |||
| PHSParam | [-] | 158. | 158. | 162. | 197. | -3.57 | 15.8 | 0.176 | 0.920 | 0.806 | 0.988 | 0.999 | 0.656 | 0.863 | |||
| PPE | [-] | 156. | 156. | 162. | 197. | -6.06 | 16.4 | 0.137 | 0.904 | 0.806 | 0.991 | 0.999 | 0.650 | 0.859 | |||
| R15 | [-] | 158. | 158. | 162. | 197. | -3.65 | 15.9 | 0.180 | 0.920 | 0.806 | 0.988 | 0.998 | 0.657 | 0.862 |
Download Data |
Period Mean (original grids) [Watt m-2] |
Model Period Mean (intersection) [Watt m-2] |
Model Period Mean (complement) [Watt m-2] |
Benchmark Period Mean (intersection) [Watt m-2] |
Benchmark Period Mean (complement) [Watt m-2] |
Bias [Watt m-2] |
RMSE [Watt m-2] |
Phase Shift [months] |
Bias Score [1] |
RMSE Score [1] |
Seasonal Cycle Score [1] |
Spatial Distribution Score [1] |
Interannual Variability Score [1] |
Overall Score [1] |
|||
|---|---|---|---|---|---|---|---|---|---|---|---|---|---|---|---|---|---|
| Benchmark | [-] | 176. | |||||||||||||||
| D104 | [-] | 174. | 174. | 176. | 228. | -1.16 | 17.9 | 0.593 | 0.795 | 0.467 | 0.921 | 0.945 | 0.639 | 0.706 | |||
| LMBIRCH4 | [-] | 174. | 174. | 175. | 226. | 0.0711 | 18.0 | 0.587 | 0.802 | 0.464 | 0.923 | 0.950 | 0.644 | 0.708 | |||
| PHSParam | [-] | 174. | 174. | 175. | 226. | -0.171 | 18.0 | 0.593 | 0.801 | 0.463 | 0.923 | 0.950 | 0.643 | 0.707 | |||
| PPE | [-] | 167. | 167. | 175. | 226. | -6.82 | 19.3 | 0.602 | 0.669 | 0.465 | 0.921 | 0.971 | 0.631 | 0.687 | |||
| R15 | [-] | 174. | 174. | 175. | 226. | 0.239 | 18.0 | 0.587 | 0.802 | 0.464 | 0.923 | 0.951 | 0.644 | 0.708 |
Download Data |
Period Mean (original grids) [Watt m-2] |
Model Period Mean (intersection) [Watt m-2] |
Model Period Mean (complement) [Watt m-2] |
Benchmark Period Mean (intersection) [Watt m-2] |
Benchmark Period Mean (complement) [Watt m-2] |
Bias [Watt m-2] |
RMSE [Watt m-2] |
Phase Shift [months] |
Bias Score [1] |
RMSE Score [1] |
Seasonal Cycle Score [1] |
Spatial Distribution Score [1] |
Interannual Variability Score [1] |
Overall Score [1] |
|||
|---|---|---|---|---|---|---|---|---|---|---|---|---|---|---|---|---|---|
| Benchmark | [-] | 182. | |||||||||||||||
| D104 | [-] | 181. | 181. | 183. | 194. | -2.02 | 19.7 | 0.360 | 0.855 | 0.574 | 0.961 | 0.997 | 0.605 | 0.761 | |||
| LMBIRCH4 | [-] | 181. | 181. | 182. | 192. | -0.815 | 19.8 | 0.294 | 0.868 | 0.572 | 0.966 | 0.998 | 0.614 | 0.765 | |||
| PHSParam | [-] | 180. | 181. | 182. | 192. | -0.899 | 19.8 | 0.375 | 0.867 | 0.571 | 0.952 | 0.998 | 0.614 | 0.762 | |||
| PPE | [-] | 178. | 178. | 182. | 192. | -3.72 | 20.0 | 0.376 | 0.838 | 0.573 | 0.952 | 0.998 | 0.610 | 0.758 | |||
| R15 | [-] | 181. | 181. | 182. | 192. | -0.652 | 19.8 | 0.308 | 0.866 | 0.571 | 0.964 | 0.998 | 0.614 | 0.764 |
Download Data |
Period Mean (original grids) [Watt m-2] |
Model Period Mean (intersection) [Watt m-2] |
Model Period Mean (complement) [Watt m-2] |
Benchmark Period Mean (intersection) [Watt m-2] |
Benchmark Period Mean (complement) [Watt m-2] |
Bias [Watt m-2] |
RMSE [Watt m-2] |
Phase Shift [months] |
Bias Score [1] |
RMSE Score [1] |
Seasonal Cycle Score [1] |
Spatial Distribution Score [1] |
Interannual Variability Score [1] |
Overall Score [1] |
|||
|---|---|---|---|---|---|---|---|---|---|---|---|---|---|---|---|---|---|
| Benchmark | [-] | 176. | |||||||||||||||
| D104 | [-] | 175. | 174. | 176. | 182. | -5.59 | 23.0 | 0.407 | 0.807 | 0.686 | 0.955 | 0.998 | 0.595 | 0.788 | |||
| LMBIRCH4 | [-] | 175. | 174. | 175. | 182. | -5.40 | 23.0 | 0.408 | 0.807 | 0.687 | 0.956 | 0.998 | 0.599 | 0.789 | |||
| PHSParam | [-] | 175. | 174. | 175. | 182. | -5.31 | 23.0 | 0.408 | 0.806 | 0.687 | 0.956 | 0.998 | 0.600 | 0.789 | |||
| PPE | [-] | 172. | 171. | 175. | 182. | -8.05 | 23.8 | 0.393 | 0.792 | 0.686 | 0.957 | 0.998 | 0.597 | 0.786 | |||
| R15 | [-] | 175. | 174. | 175. | 182. | -5.20 | 23.0 | 0.408 | 0.807 | 0.687 | 0.956 | 0.998 | 0.600 | 0.789 |
Temporally integrated period mean