Mean State
Download Data |
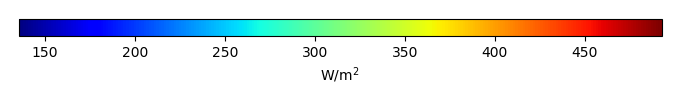
Period Mean (original grids) [W/m2] |
Model Period Mean (intersection) [W/m2] |
Model Period Mean (complement) [W/m2] |
Benchmark Period Mean (intersection) [W/m2] |
Benchmark Period Mean (complement) [W/m2] |
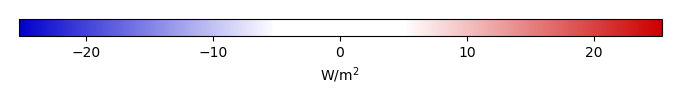
Bias [W/m2] |
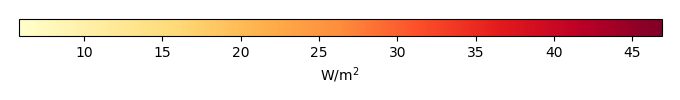
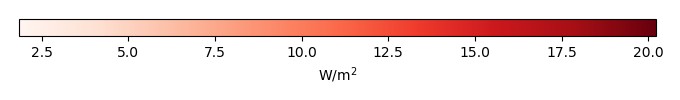
RMSE [W/m2] |
Phase Shift [months] |
Bias Score [1] |
RMSE Score [1] |
Seasonal Cycle Score [1] |
Spatial Distribution Score [1] |
Interannual Variability Score [1] |
Overall Score [1] |
|||
|---|---|---|---|---|---|---|---|---|---|---|---|---|---|---|---|---|---|
| Benchmark | [-] | 457. | |||||||||||||||
| D104 | [-] | 464. | 464. | 456. | 466. | 8.12 | 16.7 | 1.51 | 0.434 | 0.385 | 0.796 | 0.982 | 0.611 | 0.599 | |||
| LMBIRCH4 | [-] | 463. | 463. | 456. | 466. | 7.12 | 16.5 | 1.50 | 0.448 | 0.383 | 0.800 | 0.979 | 0.612 | 0.601 | |||
| PHSParam | [-] | 463. | 463. | 456. | 466. | 7.22 | 16.5 | 1.45 | 0.444 | 0.383 | 0.800 | 0.980 | 0.614 | 0.601 | |||
| PPE | [-] | 462. | 462. | 456. | 466. | 6.29 | 16.1 | 1.48 | 0.451 | 0.382 | 0.799 | 0.980 | 0.613 | 0.601 | |||
| R15 | [-] | 464. | 464. | 456. | 466. | 8.21 | 16.8 | 1.50 | 0.434 | 0.385 | 0.798 | 0.982 | 0.612 | 0.599 |
Download Data |
Period Mean (original grids) [W/m2] |
Model Period Mean (intersection) [W/m2] |
Model Period Mean (complement) [W/m2] |
Benchmark Period Mean (intersection) [W/m2] |
Benchmark Period Mean (complement) [W/m2] |
Bias [W/m2] |
RMSE [W/m2] |
Phase Shift [months] |
Bias Score [1] |
RMSE Score [1] |
Seasonal Cycle Score [1] |
Spatial Distribution Score [1] |
Interannual Variability Score [1] |
Overall Score [1] |
|||
|---|---|---|---|---|---|---|---|---|---|---|---|---|---|---|---|---|---|
| Benchmark | [-] | 466. | |||||||||||||||
| D104 | [-] | 484. | 484. | 466. | 463. | 17.6 | 24.1 | 0.673 | 0.450 | 0.500 | 0.938 | 0.945 | 0.624 | 0.659 | |||
| LMBIRCH4 | [-] | 484. | 484. | 466. | 463. | 16.9 | 23.8 | 0.685 | 0.461 | 0.496 | 0.936 | 0.963 | 0.619 | 0.662 | |||
| PHSParam | [-] | 484. | 484. | 466. | 463. | 17.0 | 23.9 | 0.687 | 0.461 | 0.493 | 0.936 | 0.956 | 0.618 | 0.659 | |||
| PPE | [-] | 484. | 483. | 466. | 463. | 16.6 | 23.8 | 0.693 | 0.469 | 0.492 | 0.936 | 0.970 | 0.616 | 0.662 | |||
| R15 | [-] | 484. | 484. | 466. | 463. | 17.5 | 24.0 | 0.685 | 0.453 | 0.498 | 0.936 | 0.940 | 0.621 | 0.658 |
Download Data |
Period Mean (original grids) [W/m2] |
Model Period Mean (intersection) [W/m2] |
Model Period Mean (complement) [W/m2] |
Benchmark Period Mean (intersection) [W/m2] |
Benchmark Period Mean (complement) [W/m2] |
Bias [W/m2] |
RMSE [W/m2] |
Phase Shift [months] |
Bias Score [1] |
RMSE Score [1] |
Seasonal Cycle Score [1] |
Spatial Distribution Score [1] |
Interannual Variability Score [1] |
Overall Score [1] |
|||
|---|---|---|---|---|---|---|---|---|---|---|---|---|---|---|---|---|---|
| Benchmark | [-] | 443. | |||||||||||||||
| D104 | [-] | 452. | 452. | 443. | 443. | 9.00 | 19.0 | 1.36 | 0.572 | 0.459 | 0.814 | 0.999 | 0.605 | 0.651 | |||
| LMBIRCH4 | [-] | 451. | 451. | 443. | 443. | 7.99 | 18.8 | 1.43 | 0.591 | 0.453 | 0.803 | 1.00 | 0.603 | 0.650 | |||
| PHSParam | [-] | 451. | 451. | 443. | 443. | 8.57 | 18.7 | 1.31 | 0.587 | 0.457 | 0.824 | 1.00 | 0.606 | 0.655 | |||
| PPE | [-] | 451. | 450. | 443. | 443. | 7.94 | 18.7 | 1.30 | 0.586 | 0.456 | 0.828 | 0.999 | 0.604 | 0.655 | |||
| R15 | [-] | 452. | 452. | 443. | 443. | 9.11 | 19.0 | 1.34 | 0.573 | 0.458 | 0.821 | 0.999 | 0.602 | 0.652 |
Download Data |
Period Mean (original grids) [W/m2] |
Model Period Mean (intersection) [W/m2] |
Model Period Mean (complement) [W/m2] |
Benchmark Period Mean (intersection) [W/m2] |
Benchmark Period Mean (complement) [W/m2] |
Bias [W/m2] |
RMSE [W/m2] |
Phase Shift [months] |
Bias Score [1] |
RMSE Score [1] |
Seasonal Cycle Score [1] |
Spatial Distribution Score [1] |
Interannual Variability Score [1] |
Overall Score [1] |
|||
|---|---|---|---|---|---|---|---|---|---|---|---|---|---|---|---|---|---|
| Benchmark | [-] | 279. | |||||||||||||||
| D104 | [-] | 278. | 278. | 278. | 296. | 2.88 | 16.3 | 0.140 | 0.892 | 0.802 | 0.989 | 1.00 | 0.740 | 0.871 | |||
| LMBIRCH4 | [-] | 278. | 278. | 278. | 296. | 3.09 | 16.3 | 0.136 | 0.891 | 0.803 | 0.989 | 0.999 | 0.740 | 0.871 | |||
| PHSParam | [-] | 278. | 278. | 278. | 296. | 3.01 | 16.3 | 0.136 | 0.891 | 0.803 | 0.989 | 1.00 | 0.740 | 0.871 | |||
| PPE | [-] | 277. | 277. | 278. | 296. | 2.46 | 16.2 | 0.136 | 0.893 | 0.803 | 0.989 | 1.00 | 0.742 | 0.871 | |||
| R15 | [-] | 277. | 278. | 278. | 296. | 2.82 | 16.3 | 0.143 | 0.891 | 0.803 | 0.989 | 1.00 | 0.741 | 0.871 |
Download Data |
Period Mean (original grids) [W/m2] |
Model Period Mean (intersection) [W/m2] |
Model Period Mean (complement) [W/m2] |
Benchmark Period Mean (intersection) [W/m2] |
Benchmark Period Mean (complement) [W/m2] |
Bias [W/m2] |
RMSE [W/m2] |
Phase Shift [months] |
Bias Score [1] |
RMSE Score [1] |
Seasonal Cycle Score [1] |
Spatial Distribution Score [1] |
Interannual Variability Score [1] |
Overall Score [1] |
|||
|---|---|---|---|---|---|---|---|---|---|---|---|---|---|---|---|---|---|
| Benchmark | [-] | 457. | |||||||||||||||
| D104 | [-] | 459. | 459. | 456. | 468. | 4.07 | 14.5 | 1.58 | 0.296 | 0.373 | 0.762 | 0.577 | 0.594 | 0.496 | |||
| LMBIRCH4 | [-] | 459. | 459. | 456. | 468. | 3.96 | 14.5 | 1.59 | 0.297 | 0.373 | 0.761 | 0.574 | 0.594 | 0.495 | |||
| PHSParam | [-] | 459. | 458. | 456. | 468. | 3.71 | 14.5 | 1.59 | 0.299 | 0.372 | 0.756 | 0.591 | 0.598 | 0.498 | |||
| PPE | [-] | 458. | 458. | 456. | 468. | 3.19 | 14.5 | 1.61 | 0.302 | 0.370 | 0.752 | 0.601 | 0.598 | 0.499 | |||
| R15 | [-] | 459. | 459. | 456. | 468. | 4.32 | 14.6 | 1.58 | 0.294 | 0.374 | 0.762 | 0.569 | 0.593 | 0.494 |
Download Data |
Period Mean (original grids) [W/m2] |
Model Period Mean (intersection) [W/m2] |
Model Period Mean (complement) [W/m2] |
Benchmark Period Mean (intersection) [W/m2] |
Benchmark Period Mean (complement) [W/m2] |
Bias [W/m2] |
RMSE [W/m2] |
Phase Shift [months] |
Bias Score [1] |
RMSE Score [1] |
Seasonal Cycle Score [1] |
Spatial Distribution Score [1] |
Interannual Variability Score [1] |
Overall Score [1] |
|||
|---|---|---|---|---|---|---|---|---|---|---|---|---|---|---|---|---|---|
| Benchmark | [-] | 312. | |||||||||||||||
| D104 | [-] | 316. | 317. | 312. | 325. | 5.49 | 12.0 | 0.0526 | 0.904 | 0.882 | 0.996 | 1.00 | 0.854 | 0.920 | |||
| LMBIRCH4 | [-] | 316. | 317. | 312. | 325. | 5.38 | 11.9 | 0.0526 | 0.904 | 0.882 | 0.996 | 1.00 | 0.854 | 0.920 | |||
| PHSParam | [-] | 316. | 317. | 312. | 325. | 5.43 | 11.9 | 0.0526 | 0.904 | 0.882 | 0.996 | 1.00 | 0.854 | 0.920 | |||
| PPE | [-] | 315. | 316. | 312. | 325. | 4.69 | 11.7 | 0.0526 | 0.910 | 0.880 | 0.996 | 1.00 | 0.853 | 0.920 | |||
| R15 | [-] | 316. | 317. | 312. | 325. | 5.44 | 11.9 | 0.0526 | 0.904 | 0.882 | 0.996 | 1.00 | 0.854 | 0.920 |
Download Data |
Period Mean (original grids) [W/m2] |
Model Period Mean (intersection) [W/m2] |
Model Period Mean (complement) [W/m2] |
Benchmark Period Mean (intersection) [W/m2] |
Benchmark Period Mean (complement) [W/m2] |
Bias [W/m2] |
RMSE [W/m2] |
Phase Shift [months] |
Bias Score [1] |
RMSE Score [1] |
Seasonal Cycle Score [1] |
Spatial Distribution Score [1] |
Interannual Variability Score [1] |
Overall Score [1] |
|||
|---|---|---|---|---|---|---|---|---|---|---|---|---|---|---|---|---|---|
| Benchmark | [-] | 364. | |||||||||||||||
| D104 | [-] | 366. | 366. | 364. | 411. | 4.11 | 15.3 | 0.162 | 0.845 | 0.818 | 0.988 | 0.996 | 0.762 | 0.871 | |||
| LMBIRCH4 | [-] | 366. | 366. | 364. | 411. | 4.13 | 15.3 | 0.164 | 0.844 | 0.817 | 0.988 | 0.995 | 0.764 | 0.871 | |||
| PHSParam | [-] | 366. | 365. | 364. | 411. | 3.90 | 15.2 | 0.162 | 0.846 | 0.817 | 0.988 | 0.996 | 0.765 | 0.871 | |||
| PPE | [-] | 366. | 365. | 364. | 411. | 3.76 | 15.2 | 0.169 | 0.847 | 0.817 | 0.988 | 0.995 | 0.764 | 0.871 | |||
| R15 | [-] | 366. | 365. | 364. | 411. | 4.03 | 15.2 | 0.158 | 0.846 | 0.818 | 0.988 | 0.997 | 0.761 | 0.871 |
Download Data |
Period Mean (original grids) [W/m2] |
Model Period Mean (intersection) [W/m2] |
Model Period Mean (complement) [W/m2] |
Benchmark Period Mean (intersection) [W/m2] |
Benchmark Period Mean (complement) [W/m2] |
Bias [W/m2] |
RMSE [W/m2] |
Phase Shift [months] |
Bias Score [1] |
RMSE Score [1] |
Seasonal Cycle Score [1] |
Spatial Distribution Score [1] |
Interannual Variability Score [1] |
Overall Score [1] |
|||
|---|---|---|---|---|---|---|---|---|---|---|---|---|---|---|---|---|---|
| Benchmark | [-] | 448. | |||||||||||||||
| D104 | [-] | 453. | 453. | 447. | 464. | 8.93 | 19.5 | 0.868 | 0.578 | 0.547 | 0.904 | 0.987 | 0.628 | 0.699 | |||
| LMBIRCH4 | [-] | 453. | 453. | 447. | 464. | 8.68 | 19.4 | 0.892 | 0.584 | 0.546 | 0.900 | 0.987 | 0.628 | 0.699 | |||
| PHSParam | [-] | 453. | 453. | 447. | 464. | 8.98 | 19.4 | 0.813 | 0.581 | 0.548 | 0.915 | 0.987 | 0.632 | 0.702 | |||
| PPE | [-] | 452. | 452. | 447. | 464. | 8.12 | 19.2 | 0.827 | 0.590 | 0.545 | 0.911 | 0.987 | 0.631 | 0.702 | |||
| R15 | [-] | 453. | 453. | 447. | 464. | 9.11 | 19.6 | 0.872 | 0.576 | 0.547 | 0.904 | 0.988 | 0.628 | 0.698 |
Download Data |
Period Mean (original grids) [W/m2] |
Model Period Mean (intersection) [W/m2] |
Model Period Mean (complement) [W/m2] |
Benchmark Period Mean (intersection) [W/m2] |
Benchmark Period Mean (complement) [W/m2] |
Bias [W/m2] |
RMSE [W/m2] |
Phase Shift [months] |
Bias Score [1] |
RMSE Score [1] |
Seasonal Cycle Score [1] |
Spatial Distribution Score [1] |
Interannual Variability Score [1] |
Overall Score [1] |
|||
|---|---|---|---|---|---|---|---|---|---|---|---|---|---|---|---|---|---|
| Benchmark | [-] | 281. | |||||||||||||||
| D104 | [-] | 284. | 285. | 281. | 278. | 4.70 | 13.9 | 0.108 | 0.902 | 0.820 | 0.992 | 0.999 | 0.759 | 0.882 | |||
| LMBIRCH4 | [-] | 284. | 285. | 281. | 278. | 4.75 | 13.9 | 0.108 | 0.901 | 0.820 | 0.992 | 1.00 | 0.757 | 0.882 | |||
| PHSParam | [-] | 284. | 285. | 281. | 278. | 4.82 | 14.0 | 0.108 | 0.901 | 0.820 | 0.992 | 0.999 | 0.759 | 0.882 | |||
| PPE | [-] | 284. | 284. | 281. | 278. | 4.31 | 13.7 | 0.108 | 0.906 | 0.819 | 0.992 | 0.999 | 0.759 | 0.882 | |||
| R15 | [-] | 284. | 285. | 281. | 278. | 4.63 | 13.8 | 0.110 | 0.902 | 0.820 | 0.991 | 0.999 | 0.760 | 0.882 |
Download Data |
Period Mean (original grids) [W/m2] |
Model Period Mean (intersection) [W/m2] |
Model Period Mean (complement) [W/m2] |
Benchmark Period Mean (intersection) [W/m2] |
Benchmark Period Mean (complement) [W/m2] |
Bias [W/m2] |
RMSE [W/m2] |
Phase Shift [months] |
Bias Score [1] |
RMSE Score [1] |
Seasonal Cycle Score [1] |
Spatial Distribution Score [1] |
Interannual Variability Score [1] |
Overall Score [1] |
|||
|---|---|---|---|---|---|---|---|---|---|---|---|---|---|---|---|---|---|
| Benchmark | [-] | 441. | |||||||||||||||
| D104 | [-] | 449. | 450. | 442. | 425. | 3.74 | 13.8 | 0.407 | 0.774 | 0.681 | 0.966 | 0.991 | 0.737 | 0.805 | |||
| LMBIRCH4 | [-] | 449. | 449. | 442. | 425. | 3.25 | 13.6 | 0.406 | 0.782 | 0.681 | 0.966 | 0.993 | 0.738 | 0.807 | |||
| PHSParam | [-] | 449. | 449. | 442. | 425. | 3.05 | 13.7 | 0.421 | 0.786 | 0.676 | 0.964 | 0.993 | 0.735 | 0.805 | |||
| PPE | [-] | 447. | 447. | 442. | 425. | 1.73 | 13.7 | 0.403 | 0.788 | 0.674 | 0.966 | 0.995 | 0.742 | 0.806 | |||
| R15 | [-] | 449. | 450. | 442. | 425. | 3.71 | 13.8 | 0.412 | 0.775 | 0.680 | 0.966 | 0.992 | 0.736 | 0.805 |
Download Data |
Period Mean (original grids) [W/m2] |
Model Period Mean (intersection) [W/m2] |
Model Period Mean (complement) [W/m2] |
Benchmark Period Mean (intersection) [W/m2] |
Benchmark Period Mean (complement) [W/m2] |
Bias [W/m2] |
RMSE [W/m2] |
Phase Shift [months] |
Bias Score [1] |
RMSE Score [1] |
Seasonal Cycle Score [1] |
Spatial Distribution Score [1] |
Interannual Variability Score [1] |
Overall Score [1] |
|||
|---|---|---|---|---|---|---|---|---|---|---|---|---|---|---|---|---|---|
| Benchmark | [-] | 368. | |||||||||||||||
| D104 | [-] | 364. | 364. | 368. | 376. | 1.30 | 13.0 | 0.423 | 0.836 | 0.752 | 0.972 | 0.999 | 0.769 | 0.847 | |||
| LMBIRCH4 | [-] | 364. | 364. | 368. | 376. | 1.26 | 13.0 | 0.418 | 0.836 | 0.752 | 0.972 | 0.999 | 0.770 | 0.847 | |||
| PHSParam | [-] | 363. | 364. | 368. | 376. | 0.940 | 12.9 | 0.436 | 0.837 | 0.752 | 0.971 | 0.999 | 0.768 | 0.846 | |||
| PPE | [-] | 363. | 364. | 368. | 376. | 0.572 | 12.9 | 0.486 | 0.838 | 0.751 | 0.967 | 0.999 | 0.767 | 0.846 | |||
| R15 | [-] | 364. | 364. | 368. | 376. | 1.36 | 13.0 | 0.431 | 0.834 | 0.752 | 0.971 | 1.00 | 0.768 | 0.846 |
Download Data |
Period Mean (original grids) [W/m2] |
Model Period Mean (intersection) [W/m2] |
Model Period Mean (complement) [W/m2] |
Benchmark Period Mean (intersection) [W/m2] |
Benchmark Period Mean (complement) [W/m2] |
Bias [W/m2] |
RMSE [W/m2] |
Phase Shift [months] |
Bias Score [1] |
RMSE Score [1] |
Seasonal Cycle Score [1] |
Spatial Distribution Score [1] |
Interannual Variability Score [1] |
Overall Score [1] |
|||
|---|---|---|---|---|---|---|---|---|---|---|---|---|---|---|---|---|---|
| Benchmark | [-] | 399. | |||||||||||||||
| D104 | [-] | 381. | 381. | 379. | 410. | 6.03 | 16.7 | 0.569 | 0.700 | 0.648 | 0.936 | 0.999 | 0.694 | 0.771 | |||
| LMBIRCH4 | [-] | 381. | 381. | 379. | 410. | 5.77 | 16.6 | 0.575 | 0.704 | 0.648 | 0.935 | 0.999 | 0.694 | 0.771 | |||
| PHSParam | [-] | 381. | 381. | 379. | 410. | 5.76 | 16.6 | 0.569 | 0.704 | 0.647 | 0.936 | 0.999 | 0.694 | 0.771 | |||
| PPE | [-] | 380. | 380. | 379. | 410. | 5.28 | 16.5 | 0.569 | 0.708 | 0.647 | 0.936 | 0.999 | 0.694 | 0.772 | |||
| R15 | [-] | 381. | 381. | 379. | 410. | 6.09 | 16.7 | 0.568 | 0.699 | 0.648 | 0.936 | 0.999 | 0.693 | 0.771 |
Download Data |
Period Mean (original grids) [W/m2] |
Model Period Mean (intersection) [W/m2] |
Model Period Mean (complement) [W/m2] |
Benchmark Period Mean (intersection) [W/m2] |
Benchmark Period Mean (complement) [W/m2] |
Bias [W/m2] |
RMSE [W/m2] |
Phase Shift [months] |
Bias Score [1] |
RMSE Score [1] |
Seasonal Cycle Score [1] |
Spatial Distribution Score [1] |
Interannual Variability Score [1] |
Overall Score [1] |
|||
|---|---|---|---|---|---|---|---|---|---|---|---|---|---|---|---|---|---|
| Benchmark | [-] | 450. | |||||||||||||||
| D104 | [-] | 452. | 452. | 450. | 435. | 2.16 | 16.0 | 0.375 | 0.826 | 0.748 | 0.972 | 1.00 | 0.715 | 0.835 | |||
| LMBIRCH4 | [-] | 452. | 452. | 450. | 435. | 2.11 | 15.9 | 0.377 | 0.826 | 0.748 | 0.971 | 1.00 | 0.715 | 0.835 | |||
| PHSParam | [-] | 452. | 452. | 450. | 435. | 2.01 | 16.0 | 0.380 | 0.826 | 0.747 | 0.971 | 1.00 | 0.716 | 0.835 | |||
| PPE | [-] | 451. | 451. | 450. | 435. | 1.90 | 16.0 | 0.378 | 0.826 | 0.747 | 0.971 | 1.00 | 0.716 | 0.835 | |||
| R15 | [-] | 452. | 452. | 450. | 435. | 2.25 | 16.0 | 0.375 | 0.826 | 0.748 | 0.972 | 1.00 | 0.715 | 0.835 |
Download Data |
Period Mean (original grids) [W/m2] |
Model Period Mean (intersection) [W/m2] |
Model Period Mean (complement) [W/m2] |
Benchmark Period Mean (intersection) [W/m2] |
Benchmark Period Mean (complement) [W/m2] |
Bias [W/m2] |
RMSE [W/m2] |
Phase Shift [months] |
Bias Score [1] |
RMSE Score [1] |
Seasonal Cycle Score [1] |
Spatial Distribution Score [1] |
Interannual Variability Score [1] |
Overall Score [1] |
|||
|---|---|---|---|---|---|---|---|---|---|---|---|---|---|---|---|---|---|
| Benchmark | [-] | 281. | |||||||||||||||
| D104 | [-] | 287. | 287. | 281. | 295. | 6.68 | 17.5 | 0.185 | 0.874 | 0.786 | 0.986 | 1.00 | 0.761 | 0.865 | |||
| LMBIRCH4 | [-] | 287. | 287. | 281. | 295. | 6.68 | 17.4 | 0.186 | 0.875 | 0.786 | 0.986 | 0.999 | 0.759 | 0.865 | |||
| PHSParam | [-] | 287. | 287. | 281. | 295. | 6.75 | 17.4 | 0.185 | 0.874 | 0.786 | 0.986 | 1.00 | 0.761 | 0.865 | |||
| PPE | [-] | 287. | 287. | 281. | 295. | 6.48 | 17.4 | 0.186 | 0.877 | 0.785 | 0.986 | 0.999 | 0.759 | 0.865 | |||
| R15 | [-] | 287. | 287. | 281. | 295. | 6.82 | 17.5 | 0.185 | 0.873 | 0.786 | 0.986 | 1.00 | 0.760 | 0.865 |
Download Data |
Period Mean (original grids) [W/m2] |
Model Period Mean (intersection) [W/m2] |
Model Period Mean (complement) [W/m2] |
Benchmark Period Mean (intersection) [W/m2] |
Benchmark Period Mean (complement) [W/m2] |
Bias [W/m2] |
RMSE [W/m2] |
Phase Shift [months] |
Bias Score [1] |
RMSE Score [1] |
Seasonal Cycle Score [1] |
Spatial Distribution Score [1] |
Interannual Variability Score [1] |
Overall Score [1] |
|||
|---|---|---|---|---|---|---|---|---|---|---|---|---|---|---|---|---|---|
| Benchmark | [-] | 442. | |||||||||||||||
| D104 | [-] | 448. | 447. | 441. | 461. | 11.5 | 18.9 | 0.962 | 0.511 | 0.541 | 0.886 | 0.949 | 0.678 | 0.684 | |||
| LMBIRCH4 | [-] | 447. | 447. | 441. | 461. | 11.1 | 18.6 | 0.948 | 0.516 | 0.542 | 0.886 | 0.959 | 0.681 | 0.688 | |||
| PHSParam | [-] | 448. | 447. | 441. | 461. | 11.2 | 18.7 | 0.932 | 0.517 | 0.541 | 0.888 | 0.957 | 0.682 | 0.688 | |||
| PPE | [-] | 446. | 446. | 441. | 461. | 10.0 | 18.0 | 0.933 | 0.530 | 0.541 | 0.888 | 0.960 | 0.684 | 0.691 | |||
| R15 | [-] | 448. | 448. | 441. | 461. | 11.7 | 19.0 | 0.970 | 0.511 | 0.541 | 0.885 | 0.948 | 0.675 | 0.683 |
Download Data |
Period Mean (original grids) [W/m2] |
Model Period Mean (intersection) [W/m2] |
Model Period Mean (complement) [W/m2] |
Benchmark Period Mean (intersection) [W/m2] |
Benchmark Period Mean (complement) [W/m2] |
Bias [W/m2] |
RMSE [W/m2] |
Phase Shift [months] |
Bias Score [1] |
RMSE Score [1] |
Seasonal Cycle Score [1] |
Spatial Distribution Score [1] |
Interannual Variability Score [1] |
Overall Score [1] |
|||
|---|---|---|---|---|---|---|---|---|---|---|---|---|---|---|---|---|---|
| Benchmark | [-] | 386. | |||||||||||||||
| D104 | [-] | 391. | 391. | 386. | 422. | 8.92 | 13.4 | 0.150 | 0.815 | 0.847 | 0.990 | 0.989 | 0.842 | 0.888 | |||
| LMBIRCH4 | [-] | 390. | 390. | 386. | 422. | 8.16 | 12.8 | 0.152 | 0.828 | 0.847 | 0.990 | 0.994 | 0.842 | 0.892 | |||
| PHSParam | [-] | 390. | 390. | 386. | 422. | 7.87 | 12.5 | 0.158 | 0.833 | 0.848 | 0.989 | 0.995 | 0.841 | 0.892 | |||
| PPE | [-] | 389. | 389. | 386. | 422. | 7.48 | 12.3 | 0.168 | 0.839 | 0.846 | 0.989 | 0.995 | 0.840 | 0.893 | |||
| R15 | [-] | 391. | 391. | 386. | 422. | 9.34 | 13.7 | 0.148 | 0.809 | 0.847 | 0.990 | 0.988 | 0.839 | 0.887 |
Download Data |
Period Mean (original grids) [W/m2] |
Model Period Mean (intersection) [W/m2] |
Model Period Mean (complement) [W/m2] |
Benchmark Period Mean (intersection) [W/m2] |
Benchmark Period Mean (complement) [W/m2] |
Bias [W/m2] |
RMSE [W/m2] |
Phase Shift [months] |
Bias Score [1] |
RMSE Score [1] |
Seasonal Cycle Score [1] |
Spatial Distribution Score [1] |
Interannual Variability Score [1] |
Overall Score [1] |
|||
|---|---|---|---|---|---|---|---|---|---|---|---|---|---|---|---|---|---|
| Benchmark | [-] | 324. | |||||||||||||||
| D104 | [-] | 328. | 328. | 324. | 352. | 5.63 | 13.5 | 0.107 | 0.873 | 0.826 | 0.993 | 0.976 | 0.780 | 0.879 | |||
| LMBIRCH4 | [-] | 328. | 328. | 324. | 352. | 5.61 | 13.5 | 0.106 | 0.874 | 0.826 | 0.993 | 0.975 | 0.780 | 0.879 | |||
| PHSParam | [-] | 328. | 328. | 324. | 352. | 5.51 | 13.5 | 0.107 | 0.875 | 0.825 | 0.993 | 0.974 | 0.780 | 0.879 | |||
| PPE | [-] | 328. | 328. | 324. | 352. | 5.11 | 13.4 | 0.103 | 0.878 | 0.823 | 0.993 | 0.974 | 0.779 | 0.878 | |||
| R15 | [-] | 329. | 328. | 324. | 352. | 5.87 | 13.6 | 0.107 | 0.871 | 0.826 | 0.993 | 0.977 | 0.778 | 0.878 |
Download Data |
Period Mean (original grids) [W/m2] |
Model Period Mean (intersection) [W/m2] |
Model Period Mean (complement) [W/m2] |
Benchmark Period Mean (intersection) [W/m2] |
Benchmark Period Mean (complement) [W/m2] |
Bias [W/m2] |
RMSE [W/m2] |
Phase Shift [months] |
Bias Score [1] |
RMSE Score [1] |
Seasonal Cycle Score [1] |
Spatial Distribution Score [1] |
Interannual Variability Score [1] |
Overall Score [1] |
|||
|---|---|---|---|---|---|---|---|---|---|---|---|---|---|---|---|---|---|
| Benchmark | [-] | 377. | |||||||||||||||
| D104 | [-] | 382. | 382. | 377. | 395. | 5.44 | 15.3 | 0.123 | 0.819 | 0.802 | 0.992 | 0.996 | 0.750 | 0.860 | |||
| LMBIRCH4 | [-] | 382. | 382. | 377. | 395. | 5.31 | 15.4 | 0.117 | 0.819 | 0.801 | 0.992 | 0.997 | 0.753 | 0.861 | |||
| PHSParam | [-] | 381. | 382. | 377. | 395. | 4.74 | 15.1 | 0.121 | 0.825 | 0.802 | 0.992 | 0.997 | 0.752 | 0.862 | |||
| PPE | [-] | 381. | 381. | 377. | 395. | 4.10 | 14.9 | 0.128 | 0.830 | 0.803 | 0.991 | 0.998 | 0.751 | 0.863 | |||
| R15 | [-] | 382. | 382. | 377. | 395. | 5.54 | 15.3 | 0.120 | 0.821 | 0.803 | 0.992 | 0.997 | 0.749 | 0.861 |
Download Data |
Period Mean (original grids) [W/m2] |
Model Period Mean (intersection) [W/m2] |
Model Period Mean (complement) [W/m2] |
Benchmark Period Mean (intersection) [W/m2] |
Benchmark Period Mean (complement) [W/m2] |
Bias [W/m2] |
RMSE [W/m2] |
Phase Shift [months] |
Bias Score [1] |
RMSE Score [1] |
Seasonal Cycle Score [1] |
Spatial Distribution Score [1] |
Interannual Variability Score [1] |
Overall Score [1] |
|||
|---|---|---|---|---|---|---|---|---|---|---|---|---|---|---|---|---|---|
| Benchmark | [-] | 449. | |||||||||||||||
| D104 | [-] | 458. | 458. | 449. | 464. | 8.87 | 15.2 | 1.17 | 0.327 | 0.396 | 0.842 | 0.989 | 0.620 | 0.595 | |||
| LMBIRCH4 | [-] | 458. | 457. | 449. | 464. | 8.56 | 14.9 | 1.18 | 0.333 | 0.396 | 0.842 | 0.993 | 0.620 | 0.597 | |||
| PHSParam | [-] | 458. | 457. | 449. | 464. | 8.62 | 14.9 | 1.19 | 0.330 | 0.400 | 0.839 | 0.988 | 0.626 | 0.597 | |||
| PPE | [-] | 457. | 457. | 449. | 464. | 7.75 | 14.4 | 1.14 | 0.353 | 0.398 | 0.850 | 0.991 | 0.625 | 0.603 | |||
| R15 | [-] | 459. | 458. | 449. | 464. | 9.12 | 15.3 | 1.16 | 0.322 | 0.396 | 0.843 | 0.991 | 0.620 | 0.595 |
Download Data |
Period Mean (original grids) [W/m2] |
Model Period Mean (intersection) [W/m2] |
Model Period Mean (complement) [W/m2] |
Benchmark Period Mean (intersection) [W/m2] |
Benchmark Period Mean (complement) [W/m2] |
Bias [W/m2] |
RMSE [W/m2] |
Phase Shift [months] |
Bias Score [1] |
RMSE Score [1] |
Seasonal Cycle Score [1] |
Spatial Distribution Score [1] |
Interannual Variability Score [1] |
Overall Score [1] |
|||
|---|---|---|---|---|---|---|---|---|---|---|---|---|---|---|---|---|---|
| Benchmark | [-] | 443. | |||||||||||||||
| D104 | [-] | 449. | 449. | 443. | 442. | 4.89 | 14.6 | 0.984 | 0.688 | 0.557 | 0.855 | 0.989 | 0.660 | 0.718 | |||
| LMBIRCH4 | [-] | 448. | 448. | 443. | 442. | 3.97 | 14.2 | 0.979 | 0.706 | 0.554 | 0.855 | 0.993 | 0.656 | 0.720 | |||
| PHSParam | [-] | 448. | 448. | 443. | 442. | 4.34 | 14.3 | 0.987 | 0.698 | 0.557 | 0.850 | 0.991 | 0.659 | 0.719 | |||
| PPE | [-] | 447. | 447. | 443. | 442. | 3.40 | 14.0 | 1.00 | 0.716 | 0.557 | 0.847 | 0.995 | 0.655 | 0.721 | |||
| R15 | [-] | 449. | 449. | 443. | 442. | 5.08 | 14.6 | 0.988 | 0.686 | 0.558 | 0.850 | 0.990 | 0.658 | 0.717 |
Download Data |
Period Mean (original grids) [W/m2] |
Model Period Mean (intersection) [W/m2] |
Model Period Mean (complement) [W/m2] |
Benchmark Period Mean (intersection) [W/m2] |
Benchmark Period Mean (complement) [W/m2] |
Bias [W/m2] |
RMSE [W/m2] |
Phase Shift [months] |
Bias Score [1] |
RMSE Score [1] |
Seasonal Cycle Score [1] |
Spatial Distribution Score [1] |
Interannual Variability Score [1] |
Overall Score [1] |
|||
|---|---|---|---|---|---|---|---|---|---|---|---|---|---|---|---|---|---|
| Benchmark | [-] | 383. | |||||||||||||||
| D104 | [-] | 387. | 386. | 382. | 399. | 5.36 | 21.6 | 0.925 | 0.597 | 0.558 | 0.884 | 0.999 | 0.640 | 0.706 | |||
| LMBIRCH4 | [-] | 386. | 386. | 382. | 399. | 5.20 | 21.5 | 0.923 | 0.600 | 0.560 | 0.884 | 0.999 | 0.642 | 0.708 | |||
| PHSParam | [-] | 386. | 386. | 382. | 399. | 5.06 | 21.6 | 0.935 | 0.599 | 0.558 | 0.884 | 0.999 | 0.643 | 0.707 | |||
| PPE | [-] | 386. | 385. | 382. | 399. | 4.48 | 21.4 | 0.931 | 0.607 | 0.559 | 0.884 | 0.999 | 0.647 | 0.709 | |||
| R15 | [-] | 387. | 386. | 382. | 399. | 5.40 | 21.7 | 0.937 | 0.595 | 0.558 | 0.882 | 0.999 | 0.638 | 0.705 |
Temporally integrated period mean