Mean State
Download Data |
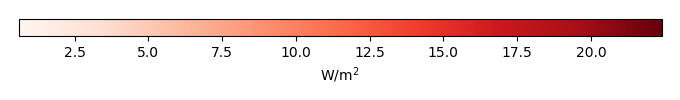
Period Mean (original grids) [W/m2] |
Model Period Mean (intersection) [W/m2] |
Model Period Mean (complement) [W/m2] |
Benchmark Period Mean (intersection) [W/m2] |
Benchmark Period Mean (complement) [W/m2] |
Bias [W/m2] |
RMSE [W/m2] |
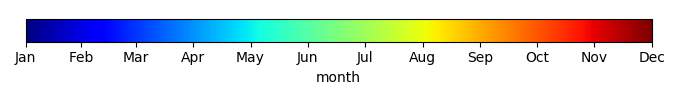
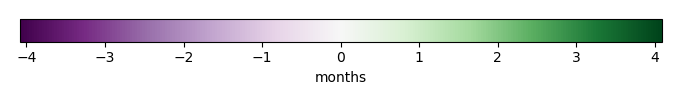
Phase Shift [months] |
Bias Score [1] |
RMSE Score [1] |
Seasonal Cycle Score [1] |
Spatial Distribution Score [1] |
Interannual Variability Score [1] |
Overall Score [1] |
|||
|---|---|---|---|---|---|---|---|---|---|---|---|---|---|---|---|---|---|
| Benchmark | [-] | 31.3 | |||||||||||||||
| D104 | [-] | 33.3 | 33.9 | 31.7 | 11.2 | 2.84 | 8.27 | 1.93 | 0.392 | 0.325 | 0.716 | 0.935 | 0.689 | 0.564 | |||
| LMBIRCH4 | [-] | 33.5 | 34.0 | 31.7 | 11.2 | 2.94 | 8.30 | 1.91 | 0.378 | 0.326 | 0.718 | 0.934 | 0.693 | 0.562 | |||
| PHSParam | [-] | 33.6 | 34.1 | 31.7 | 11.2 | 3.08 | 8.46 | 1.85 | 0.358 | 0.322 | 0.727 | 0.928 | 0.697 | 0.559 | |||
| PPE | [-] | 38.6 | 39.1 | 31.7 | 11.2 | 7.84 | 12.0 | 1.87 | 0.178 | 0.293 | 0.724 | 0.856 | 0.762 | 0.518 | |||
| R15 | [-] | 33.2 | 33.8 | 31.7 | 11.2 | 2.75 | 8.23 | 1.91 | 0.403 | 0.325 | 0.719 | 0.937 | 0.690 | 0.566 |
Download Data |
Period Mean (original grids) [W/m2] |
Model Period Mean (intersection) [W/m2] |
Model Period Mean (complement) [W/m2] |
Benchmark Period Mean (intersection) [W/m2] |
Benchmark Period Mean (complement) [W/m2] |
Bias [W/m2] |
RMSE [W/m2] |
Phase Shift [months] |
Bias Score [1] |
RMSE Score [1] |
Seasonal Cycle Score [1] |
Spatial Distribution Score [1] |
Interannual Variability Score [1] |
Overall Score [1] |
|||
|---|---|---|---|---|---|---|---|---|---|---|---|---|---|---|---|---|---|
| Benchmark | [-] | 44.7 | |||||||||||||||
| D104 | [-] | 45.2 | 45.5 | 44.7 | 13.0 | 0.587 | 9.37 | 0.930 | 0.515 | 0.339 | 0.888 | 0.968 | 0.709 | 0.626 | |||
| LMBIRCH4 | [-] | 45.3 | 45.6 | 44.7 | 13.0 | 0.744 | 9.41 | 0.932 | 0.509 | 0.338 | 0.887 | 0.965 | 0.707 | 0.624 | |||
| PHSParam | [-] | 45.1 | 45.4 | 44.7 | 13.0 | 0.538 | 9.34 | 0.902 | 0.510 | 0.344 | 0.890 | 0.963 | 0.702 | 0.625 | |||
| PPE | [-] | 46.4 | 46.8 | 44.7 | 13.0 | 1.96 | 10.1 | 0.908 | 0.418 | 0.333 | 0.890 | 0.936 | 0.720 | 0.605 | |||
| R15 | [-] | 45.3 | 45.5 | 44.7 | 13.0 | 0.665 | 9.35 | 0.888 | 0.519 | 0.340 | 0.892 | 0.969 | 0.704 | 0.627 |
Download Data |
Period Mean (original grids) [W/m2] |
Model Period Mean (intersection) [W/m2] |
Model Period Mean (complement) [W/m2] |
Benchmark Period Mean (intersection) [W/m2] |
Benchmark Period Mean (complement) [W/m2] |
Bias [W/m2] |
RMSE [W/m2] |
Phase Shift [months] |
Bias Score [1] |
RMSE Score [1] |
Seasonal Cycle Score [1] |
Spatial Distribution Score [1] |
Interannual Variability Score [1] |
Overall Score [1] |
|||
|---|---|---|---|---|---|---|---|---|---|---|---|---|---|---|---|---|---|
| Benchmark | [-] | 33.4 | |||||||||||||||
| D104 | [-] | 36.8 | 36.7 | 33.9 | 14.3 | 2.89 | 8.76 | 1.41 | 0.527 | 0.408 | 0.806 | 0.860 | 0.704 | 0.619 | |||
| LMBIRCH4 | [-] | 37.1 | 36.9 | 33.9 | 14.3 | 3.12 | 8.77 | 1.38 | 0.523 | 0.411 | 0.811 | 0.858 | 0.699 | 0.619 | |||
| PHSParam | [-] | 36.9 | 36.8 | 33.9 | 14.3 | 3.03 | 8.87 | 1.42 | 0.528 | 0.404 | 0.808 | 0.853 | 0.706 | 0.617 | |||
| PPE | [-] | 39.7 | 39.6 | 33.9 | 14.3 | 5.71 | 9.83 | 1.39 | 0.421 | 0.402 | 0.808 | 0.814 | 0.721 | 0.595 | |||
| R15 | [-] | 36.8 | 36.6 | 33.9 | 14.3 | 2.83 | 8.73 | 1.41 | 0.529 | 0.410 | 0.806 | 0.869 | 0.701 | 0.621 |
Download Data |
Period Mean (original grids) [W/m2] |
Model Period Mean (intersection) [W/m2] |
Model Period Mean (complement) [W/m2] |
Benchmark Period Mean (intersection) [W/m2] |
Benchmark Period Mean (complement) [W/m2] |
Bias [W/m2] |
RMSE [W/m2] |
Phase Shift [months] |
Bias Score [1] |
RMSE Score [1] |
Seasonal Cycle Score [1] |
Spatial Distribution Score [1] |
Interannual Variability Score [1] |
Overall Score [1] |
|||
|---|---|---|---|---|---|---|---|---|---|---|---|---|---|---|---|---|---|
| Benchmark | [-] | 40.8 | |||||||||||||||
| D104 | [-] | 33.8 | 33.7 | 41.0 | 36.3 | -6.60 | 23.8 | 0.228 | 0.809 | 0.637 | 0.985 | 0.930 | 0.647 | 0.774 | |||
| LMBIRCH4 | [-] | 33.9 | 33.7 | 41.0 | 36.3 | -6.66 | 23.6 | 0.221 | 0.807 | 0.638 | 0.985 | 0.948 | 0.655 | 0.778 | |||
| PHSParam | [-] | 34.3 | 34.1 | 41.0 | 36.3 | -6.25 | 23.3 | 0.228 | 0.812 | 0.641 | 0.985 | 0.952 | 0.656 | 0.781 | |||
| PPE | [-] | 36.1 | 36.0 | 41.0 | 36.3 | -4.55 | 23.1 | 0.228 | 0.831 | 0.635 | 0.985 | 0.900 | 0.652 | 0.773 | |||
| R15 | [-] | 33.9 | 33.8 | 41.0 | 36.3 | -6.60 | 23.9 | 0.237 | 0.809 | 0.636 | 0.984 | 0.936 | 0.646 | 0.774 |
Download Data |
Period Mean (original grids) [W/m2] |
Model Period Mean (intersection) [W/m2] |
Model Period Mean (complement) [W/m2] |
Benchmark Period Mean (intersection) [W/m2] |
Benchmark Period Mean (complement) [W/m2] |
Bias [W/m2] |
RMSE [W/m2] |
Phase Shift [months] |
Bias Score [1] |
RMSE Score [1] |
Seasonal Cycle Score [1] |
Spatial Distribution Score [1] |
Interannual Variability Score [1] |
Overall Score [1] |
|||
|---|---|---|---|---|---|---|---|---|---|---|---|---|---|---|---|---|---|
| Benchmark | [-] | 17.7 | |||||||||||||||
| D104 | [-] | 27.7 | 27.6 | 18.3 | 12.1 | 10.2 | 11.6 | 1.51 | 0.236 | 0.355 | 0.767 | 0.492 | 0.684 | 0.481 | |||
| LMBIRCH4 | [-] | 27.7 | 27.6 | 18.3 | 12.1 | 10.2 | 11.6 | 1.51 | 0.236 | 0.355 | 0.767 | 0.495 | 0.685 | 0.482 | |||
| PHSParam | [-] | 27.9 | 27.8 | 18.3 | 12.1 | 10.4 | 11.8 | 1.51 | 0.232 | 0.351 | 0.768 | 0.518 | 0.688 | 0.484 | |||
| PPE | [-] | 34.7 | 34.7 | 18.3 | 12.1 | 17.1 | 17.7 | 1.50 | 0.0579 | 0.315 | 0.769 | 0.576 | 0.691 | 0.454 | |||
| R15 | [-] | 27.6 | 27.5 | 18.3 | 12.1 | 10.1 | 11.6 | 1.51 | 0.238 | 0.356 | 0.767 | 0.494 | 0.684 | 0.482 |
Download Data |
Period Mean (original grids) [W/m2] |
Model Period Mean (intersection) [W/m2] |
Model Period Mean (complement) [W/m2] |
Benchmark Period Mean (intersection) [W/m2] |
Benchmark Period Mean (complement) [W/m2] |
Bias [W/m2] |
RMSE [W/m2] |
Phase Shift [months] |
Bias Score [1] |
RMSE Score [1] |
Seasonal Cycle Score [1] |
Spatial Distribution Score [1] |
Interannual Variability Score [1] |
Overall Score [1] |
|||
|---|---|---|---|---|---|---|---|---|---|---|---|---|---|---|---|---|---|
| Benchmark | [-] | 28.1 | |||||||||||||||
| D104 | [-] | 25.1 | 24.8 | 28.1 | 26.9 | -3.23 | 11.6 | 0.242 | 0.789 | 0.624 | 0.984 | 0.961 | 0.671 | 0.775 | |||
| LMBIRCH4 | [-] | 24.8 | 24.5 | 28.1 | 26.9 | -3.57 | 11.4 | 0.253 | 0.801 | 0.628 | 0.983 | 0.925 | 0.671 | 0.773 | |||
| PHSParam | [-] | 24.7 | 24.4 | 28.1 | 26.9 | -3.63 | 11.4 | 0.257 | 0.798 | 0.629 | 0.983 | 0.921 | 0.669 | 0.771 | |||
| PPE | [-] | 28.0 | 27.8 | 28.1 | 26.9 | -0.188 | 11.5 | 0.408 | 0.842 | 0.614 | 0.961 | 0.783 | 0.665 | 0.746 | |||
| R15 | [-] | 24.7 | 24.4 | 28.1 | 26.9 | -3.62 | 11.6 | 0.244 | 0.789 | 0.626 | 0.984 | 0.946 | 0.661 | 0.772 |
Download Data |
Period Mean (original grids) [W/m2] |
Model Period Mean (intersection) [W/m2] |
Model Period Mean (complement) [W/m2] |
Benchmark Period Mean (intersection) [W/m2] |
Benchmark Period Mean (complement) [W/m2] |
Bias [W/m2] |
RMSE [W/m2] |
Phase Shift [months] |
Bias Score [1] |
RMSE Score [1] |
Seasonal Cycle Score [1] |
Spatial Distribution Score [1] |
Interannual Variability Score [1] |
Overall Score [1] |
|||
|---|---|---|---|---|---|---|---|---|---|---|---|---|---|---|---|---|---|
| Benchmark | [-] | 35.8 | |||||||||||||||
| D104 | [-] | 35.4 | 35.4 | 36.1 | 8.36 | -1.44 | 10.9 | 0.886 | 0.683 | 0.542 | 0.887 | 0.902 | 0.687 | 0.707 | |||
| LMBIRCH4 | [-] | 35.5 | 35.4 | 36.1 | 8.36 | -1.35 | 10.8 | 0.845 | 0.687 | 0.542 | 0.891 | 0.903 | 0.689 | 0.709 | |||
| PHSParam | [-] | 35.4 | 35.3 | 36.1 | 8.36 | -1.50 | 10.9 | 0.891 | 0.685 | 0.541 | 0.887 | 0.902 | 0.689 | 0.708 | |||
| PPE | [-] | 36.9 | 36.8 | 36.1 | 8.36 | 0.239 | 11.7 | 0.832 | 0.618 | 0.532 | 0.896 | 0.800 | 0.702 | 0.680 | |||
| R15 | [-] | 35.3 | 35.2 | 36.1 | 8.36 | -1.61 | 10.9 | 0.891 | 0.680 | 0.542 | 0.886 | 0.896 | 0.683 | 0.705 |
Download Data |
Period Mean (original grids) [W/m2] |
Model Period Mean (intersection) [W/m2] |
Model Period Mean (complement) [W/m2] |
Benchmark Period Mean (intersection) [W/m2] |
Benchmark Period Mean (complement) [W/m2] |
Bias [W/m2] |
RMSE [W/m2] |
Phase Shift [months] |
Bias Score [1] |
RMSE Score [1] |
Seasonal Cycle Score [1] |
Spatial Distribution Score [1] |
Interannual Variability Score [1] |
Overall Score [1] |
|||
|---|---|---|---|---|---|---|---|---|---|---|---|---|---|---|---|---|---|
| Benchmark | [-] | 29.2 | |||||||||||||||
| D104 | [-] | 33.0 | 33.3 | 29.6 | 12.0 | 3.08 | 9.97 | 1.09 | 0.512 | 0.421 | 0.872 | 0.803 | 0.661 | 0.615 | |||
| LMBIRCH4 | [-] | 33.1 | 33.4 | 29.6 | 12.0 | 3.15 | 9.92 | 1.11 | 0.517 | 0.422 | 0.871 | 0.802 | 0.662 | 0.616 | |||
| PHSParam | [-] | 33.2 | 33.4 | 29.6 | 12.0 | 3.25 | 10.1 | 1.11 | 0.511 | 0.416 | 0.869 | 0.793 | 0.669 | 0.612 | |||
| PPE | [-] | 36.6 | 36.8 | 29.6 | 12.0 | 6.84 | 12.0 | 0.929 | 0.382 | 0.397 | 0.891 | 0.681 | 0.689 | 0.573 | |||
| R15 | [-] | 32.9 | 33.2 | 29.6 | 12.0 | 2.98 | 9.94 | 1.10 | 0.511 | 0.422 | 0.872 | 0.802 | 0.660 | 0.615 |
Download Data |
Period Mean (original grids) [W/m2] |
Model Period Mean (intersection) [W/m2] |
Model Period Mean (complement) [W/m2] |
Benchmark Period Mean (intersection) [W/m2] |
Benchmark Period Mean (complement) [W/m2] |
Bias [W/m2] |
RMSE [W/m2] |
Phase Shift [months] |
Bias Score [1] |
RMSE Score [1] |
Seasonal Cycle Score [1] |
Spatial Distribution Score [1] |
Interannual Variability Score [1] |
Overall Score [1] |
|||
|---|---|---|---|---|---|---|---|---|---|---|---|---|---|---|---|---|---|
| Benchmark | [-] | 36.1 | |||||||||||||||
| D104 | [-] | 30.4 | 30.1 | 36.0 | 42.5 | -5.18 | 21.3 | 0.189 | 0.855 | 0.659 | 0.987 | 0.852 | 0.674 | 0.781 | |||
| LMBIRCH4 | [-] | 30.5 | 30.2 | 36.0 | 42.5 | -5.11 | 20.7 | 0.199 | 0.862 | 0.664 | 0.986 | 0.844 | 0.676 | 0.783 | |||
| PHSParam | [-] | 30.6 | 30.2 | 36.0 | 42.5 | -5.02 | 20.7 | 0.199 | 0.862 | 0.665 | 0.986 | 0.846 | 0.682 | 0.784 | |||
| PPE | [-] | 32.4 | 32.1 | 36.0 | 42.5 | -3.29 | 20.4 | 0.179 | 0.879 | 0.661 | 0.988 | 0.769 | 0.668 | 0.771 | |||
| R15 | [-] | 30.1 | 29.8 | 36.0 | 42.5 | -5.46 | 21.4 | 0.189 | 0.853 | 0.657 | 0.987 | 0.836 | 0.672 | 0.777 |
Download Data |
Period Mean (original grids) [W/m2] |
Model Period Mean (intersection) [W/m2] |
Model Period Mean (complement) [W/m2] |
Benchmark Period Mean (intersection) [W/m2] |
Benchmark Period Mean (complement) [W/m2] |
Bias [W/m2] |
RMSE [W/m2] |
Phase Shift [months] |
Bias Score [1] |
RMSE Score [1] |
Seasonal Cycle Score [1] |
Spatial Distribution Score [1] |
Interannual Variability Score [1] |
Overall Score [1] |
|||
|---|---|---|---|---|---|---|---|---|---|---|---|---|---|---|---|---|---|
| Benchmark | [-] | 36.6 | |||||||||||||||
| D104 | [-] | 39.2 | 39.3 | 37.5 | 12.9 | 0.514 | 9.75 | 0.665 | 0.579 | 0.546 | 0.937 | 0.744 | 0.685 | 0.673 | |||
| LMBIRCH4 | [-] | 39.3 | 39.4 | 37.5 | 12.9 | 0.630 | 9.79 | 0.669 | 0.578 | 0.547 | 0.935 | 0.739 | 0.684 | 0.672 | |||
| PHSParam | [-] | 39.1 | 39.2 | 37.5 | 12.9 | 0.476 | 9.81 | 0.653 | 0.575 | 0.548 | 0.938 | 0.729 | 0.678 | 0.670 | |||
| PPE | [-] | 42.3 | 42.4 | 37.5 | 12.9 | 3.73 | 10.2 | 0.647 | 0.583 | 0.540 | 0.939 | 0.684 | 0.685 | 0.662 | |||
| R15 | [-] | 39.3 | 39.4 | 37.5 | 12.9 | 0.549 | 9.76 | 0.656 | 0.579 | 0.546 | 0.937 | 0.747 | 0.685 | 0.673 |
Download Data |
Period Mean (original grids) [W/m2] |
Model Period Mean (intersection) [W/m2] |
Model Period Mean (complement) [W/m2] |
Benchmark Period Mean (intersection) [W/m2] |
Benchmark Period Mean (complement) [W/m2] |
Bias [W/m2] |
RMSE [W/m2] |
Phase Shift [months] |
Bias Score [1] |
RMSE Score [1] |
Seasonal Cycle Score [1] |
Spatial Distribution Score [1] |
Interannual Variability Score [1] |
Overall Score [1] |
|||
|---|---|---|---|---|---|---|---|---|---|---|---|---|---|---|---|---|---|
| Benchmark | [-] | 19.6 | |||||||||||||||
| D104 | [-] | 22.5 | 22.5 | 19.8 | 7.93 | 2.80 | 9.59 | 0.927 | 0.650 | 0.531 | 0.882 | 0.838 | 0.665 | 0.683 | |||
| LMBIRCH4 | [-] | 22.7 | 22.7 | 19.8 | 7.93 | 2.99 | 9.63 | 0.969 | 0.649 | 0.530 | 0.874 | 0.861 | 0.667 | 0.685 | |||
| PHSParam | [-] | 22.5 | 22.5 | 19.8 | 7.93 | 2.78 | 9.56 | 0.961 | 0.647 | 0.532 | 0.876 | 0.849 | 0.664 | 0.683 | |||
| PPE | [-] | 25.1 | 25.2 | 19.8 | 7.93 | 5.62 | 10.6 | 0.617 | 0.607 | 0.523 | 0.931 | 0.785 | 0.666 | 0.673 | |||
| R15 | [-] | 22.3 | 22.4 | 19.8 | 7.93 | 2.72 | 9.61 | 0.928 | 0.650 | 0.532 | 0.881 | 0.850 | 0.659 | 0.684 |
Download Data |
Period Mean (original grids) [W/m2] |
Model Period Mean (intersection) [W/m2] |
Model Period Mean (complement) [W/m2] |
Benchmark Period Mean (intersection) [W/m2] |
Benchmark Period Mean (complement) [W/m2] |
Bias [W/m2] |
RMSE [W/m2] |
Phase Shift [months] |
Bias Score [1] |
RMSE Score [1] |
Seasonal Cycle Score [1] |
Spatial Distribution Score [1] |
Interannual Variability Score [1] |
Overall Score [1] |
|||
|---|---|---|---|---|---|---|---|---|---|---|---|---|---|---|---|---|---|
| Benchmark | [-] | 24.0 | |||||||||||||||
| D104 | [-] | 45.2 | 45.2 | 42.6 | 13.7 | 1.00 | 13.9 | 0.778 | 0.603 | 0.520 | 0.904 | 0.986 | 0.665 | 0.700 | |||
| LMBIRCH4 | [-] | 45.3 | 45.3 | 42.6 | 13.7 | 1.05 | 13.9 | 0.773 | 0.604 | 0.520 | 0.905 | 0.986 | 0.665 | 0.700 | |||
| PHSParam | [-] | 45.2 | 45.2 | 42.6 | 13.7 | 1.06 | 13.9 | 0.775 | 0.604 | 0.520 | 0.905 | 0.986 | 0.665 | 0.700 | |||
| PPE | [-] | 47.6 | 47.6 | 42.6 | 13.7 | 3.57 | 14.9 | 0.744 | 0.560 | 0.511 | 0.909 | 0.980 | 0.672 | 0.691 | |||
| R15 | [-] | 45.0 | 45.0 | 42.6 | 13.7 | 0.848 | 14.0 | 0.770 | 0.602 | 0.520 | 0.905 | 0.986 | 0.663 | 0.699 |
Download Data |
Period Mean (original grids) [W/m2] |
Model Period Mean (intersection) [W/m2] |
Model Period Mean (complement) [W/m2] |
Benchmark Period Mean (intersection) [W/m2] |
Benchmark Period Mean (complement) [W/m2] |
Bias [W/m2] |
RMSE [W/m2] |
Phase Shift [months] |
Bias Score [1] |
RMSE Score [1] |
Seasonal Cycle Score [1] |
Spatial Distribution Score [1] |
Interannual Variability Score [1] |
Overall Score [1] |
|||
|---|---|---|---|---|---|---|---|---|---|---|---|---|---|---|---|---|---|
| Benchmark | [-] | 72.5 | |||||||||||||||
| D104 | [-] | 78.8 | 79.4 | 73.0 | 12.5 | 3.77 | 16.1 | 0.764 | 0.546 | 0.535 | 0.921 | 0.975 | 0.700 | 0.702 | |||
| LMBIRCH4 | [-] | 78.8 | 79.4 | 73.0 | 12.5 | 3.77 | 16.1 | 0.769 | 0.546 | 0.535 | 0.920 | 0.975 | 0.700 | 0.702 | |||
| PHSParam | [-] | 78.8 | 79.3 | 73.0 | 12.5 | 3.71 | 16.1 | 0.769 | 0.546 | 0.536 | 0.920 | 0.975 | 0.701 | 0.702 | |||
| PPE | [-] | 79.1 | 79.7 | 73.0 | 12.5 | 4.11 | 16.2 | 0.738 | 0.547 | 0.536 | 0.923 | 0.971 | 0.700 | 0.702 | |||
| R15 | [-] | 78.8 | 79.3 | 73.0 | 12.5 | 3.73 | 16.1 | 0.751 | 0.546 | 0.535 | 0.923 | 0.975 | 0.700 | 0.702 |
Download Data |
Period Mean (original grids) [W/m2] |
Model Period Mean (intersection) [W/m2] |
Model Period Mean (complement) [W/m2] |
Benchmark Period Mean (intersection) [W/m2] |
Benchmark Period Mean (complement) [W/m2] |
Bias [W/m2] |
RMSE [W/m2] |
Phase Shift [months] |
Bias Score [1] |
RMSE Score [1] |
Seasonal Cycle Score [1] |
Spatial Distribution Score [1] |
Interannual Variability Score [1] |
Overall Score [1] |
|||
|---|---|---|---|---|---|---|---|---|---|---|---|---|---|---|---|---|---|
| Benchmark | [-] | 46.1 | |||||||||||||||
| D104 | [-] | 37.7 | 37.6 | 46.2 | 38.9 | -7.43 | 23.5 | 0.216 | 0.827 | 0.661 | 0.983 | 0.937 | 0.676 | 0.791 | |||
| LMBIRCH4 | [-] | 38.0 | 37.9 | 46.2 | 38.9 | -7.24 | 23.5 | 0.200 | 0.829 | 0.661 | 0.984 | 0.927 | 0.676 | 0.790 | |||
| PHSParam | [-] | 38.2 | 38.2 | 46.2 | 38.9 | -6.96 | 23.2 | 0.210 | 0.830 | 0.664 | 0.984 | 0.929 | 0.683 | 0.792 | |||
| PPE | [-] | 39.2 | 39.2 | 46.2 | 38.9 | -6.11 | 23.3 | 0.198 | 0.842 | 0.659 | 0.985 | 0.888 | 0.673 | 0.784 | |||
| R15 | [-] | 36.6 | 36.6 | 46.2 | 38.9 | -8.37 | 24.4 | 0.215 | 0.817 | 0.653 | 0.983 | 0.934 | 0.663 | 0.784 |
Download Data |
Period Mean (original grids) [W/m2] |
Model Period Mean (intersection) [W/m2] |
Model Period Mean (complement) [W/m2] |
Benchmark Period Mean (intersection) [W/m2] |
Benchmark Period Mean (complement) [W/m2] |
Bias [W/m2] |
RMSE [W/m2] |
Phase Shift [months] |
Bias Score [1] |
RMSE Score [1] |
Seasonal Cycle Score [1] |
Spatial Distribution Score [1] |
Interannual Variability Score [1] |
Overall Score [1] |
|||
|---|---|---|---|---|---|---|---|---|---|---|---|---|---|---|---|---|---|
| Benchmark | [-] | 26.3 | |||||||||||||||
| D104 | [-] | 33.2 | 33.2 | 27.0 | 12.8 | 6.10 | 12.2 | 0.784 | 0.371 | 0.455 | 0.900 | 0.401 | 0.663 | 0.541 | |||
| LMBIRCH4 | [-] | 33.2 | 33.3 | 27.0 | 12.8 | 6.16 | 12.2 | 0.764 | 0.372 | 0.454 | 0.903 | 0.401 | 0.665 | 0.542 | |||
| PHSParam | [-] | 33.3 | 33.4 | 27.0 | 12.8 | 6.35 | 12.4 | 0.758 | 0.369 | 0.448 | 0.905 | 0.395 | 0.665 | 0.538 | |||
| PPE | [-] | 37.4 | 37.5 | 27.0 | 12.8 | 10.4 | 14.4 | 0.751 | 0.321 | 0.430 | 0.906 | 0.374 | 0.666 | 0.521 | |||
| R15 | [-] | 33.0 | 33.1 | 27.0 | 12.8 | 6.00 | 12.2 | 0.788 | 0.370 | 0.456 | 0.900 | 0.399 | 0.661 | 0.540 |
Download Data |
Period Mean (original grids) [W/m2] |
Model Period Mean (intersection) [W/m2] |
Model Period Mean (complement) [W/m2] |
Benchmark Period Mean (intersection) [W/m2] |
Benchmark Period Mean (complement) [W/m2] |
Bias [W/m2] |
RMSE [W/m2] |
Phase Shift [months] |
Bias Score [1] |
RMSE Score [1] |
Seasonal Cycle Score [1] |
Spatial Distribution Score [1] |
Interannual Variability Score [1] |
Overall Score [1] |
|||
|---|---|---|---|---|---|---|---|---|---|---|---|---|---|---|---|---|---|
| Benchmark | [-] | 26.9 | |||||||||||||||
| D104 | [-] | 27.5 | 27.7 | 27.1 | 12.9 | 0.262 | 8.39 | 1.12 | 0.687 | 0.540 | 0.834 | 0.743 | 0.673 | 0.670 | |||
| LMBIRCH4 | [-] | 27.3 | 27.5 | 27.1 | 12.9 | 0.0714 | 8.47 | 1.11 | 0.678 | 0.538 | 0.836 | 0.756 | 0.670 | 0.669 | |||
| PHSParam | [-] | 27.2 | 27.3 | 27.1 | 12.9 | -0.0378 | 8.51 | 1.12 | 0.673 | 0.537 | 0.833 | 0.756 | 0.665 | 0.667 | |||
| PPE | [-] | 31.0 | 31.1 | 27.1 | 12.9 | 3.85 | 8.37 | 0.787 | 0.671 | 0.574 | 0.888 | 0.478 | 0.683 | 0.645 | |||
| R15 | [-] | 27.2 | 27.4 | 27.1 | 12.9 | 0.00455 | 8.11 | 1.12 | 0.691 | 0.548 | 0.836 | 0.754 | 0.683 | 0.677 |
Download Data |
Period Mean (original grids) [W/m2] |
Model Period Mean (intersection) [W/m2] |
Model Period Mean (complement) [W/m2] |
Benchmark Period Mean (intersection) [W/m2] |
Benchmark Period Mean (complement) [W/m2] |
Bias [W/m2] |
RMSE [W/m2] |
Phase Shift [months] |
Bias Score [1] |
RMSE Score [1] |
Seasonal Cycle Score [1] |
Spatial Distribution Score [1] |
Interannual Variability Score [1] |
Overall Score [1] |
|||
|---|---|---|---|---|---|---|---|---|---|---|---|---|---|---|---|---|---|
| Benchmark | [-] | 26.3 | |||||||||||||||
| D104 | [-] | 24.6 | 24.7 | 26.6 | 10.0 | -2.19 | 11.6 | 0.374 | 0.739 | 0.581 | 0.956 | 0.962 | 0.630 | 0.742 | |||
| LMBIRCH4 | [-] | 24.7 | 24.9 | 26.6 | 10.0 | -2.05 | 11.6 | 0.378 | 0.740 | 0.581 | 0.956 | 0.968 | 0.631 | 0.743 | |||
| PHSParam | [-] | 24.7 | 24.8 | 26.6 | 10.0 | -2.09 | 11.7 | 0.376 | 0.738 | 0.581 | 0.957 | 0.966 | 0.633 | 0.743 | |||
| PPE | [-] | 29.2 | 29.3 | 26.6 | 10.0 | 2.46 | 12.2 | 0.610 | 0.754 | 0.563 | 0.925 | 0.846 | 0.630 | 0.713 | |||
| R15 | [-] | 23.6 | 23.8 | 26.6 | 10.0 | -3.04 | 12.0 | 0.333 | 0.728 | 0.575 | 0.960 | 0.961 | 0.612 | 0.735 |
Download Data |
Period Mean (original grids) [W/m2] |
Model Period Mean (intersection) [W/m2] |
Model Period Mean (complement) [W/m2] |
Benchmark Period Mean (intersection) [W/m2] |
Benchmark Period Mean (complement) [W/m2] |
Bias [W/m2] |
RMSE [W/m2] |
Phase Shift [months] |
Bias Score [1] |
RMSE Score [1] |
Seasonal Cycle Score [1] |
Spatial Distribution Score [1] |
Interannual Variability Score [1] |
Overall Score [1] |
|||
|---|---|---|---|---|---|---|---|---|---|---|---|---|---|---|---|---|---|
| Benchmark | [-] | 38.3 | |||||||||||||||
| D104 | [-] | 35.4 | 35.3 | 38.4 | 14.1 | -3.63 | 10.4 | 1.03 | 0.688 | 0.571 | 0.850 | 0.975 | 0.745 | 0.733 | |||
| LMBIRCH4 | [-] | 35.5 | 35.4 | 38.4 | 14.1 | -3.59 | 10.4 | 1.04 | 0.691 | 0.570 | 0.847 | 0.975 | 0.750 | 0.734 | |||
| PHSParam | [-] | 35.2 | 35.2 | 38.4 | 14.1 | -3.79 | 10.3 | 0.973 | 0.688 | 0.573 | 0.855 | 0.982 | 0.745 | 0.736 | |||
| PPE | [-] | 37.3 | 37.3 | 38.4 | 14.1 | -1.39 | 9.95 | 0.973 | 0.710 | 0.576 | 0.852 | 0.914 | 0.749 | 0.730 | |||
| R15 | [-] | 35.3 | 35.2 | 38.4 | 14.1 | -3.70 | 10.4 | 1.01 | 0.686 | 0.571 | 0.854 | 0.976 | 0.744 | 0.734 |
Download Data |
Period Mean (original grids) [W/m2] |
Model Period Mean (intersection) [W/m2] |
Model Period Mean (complement) [W/m2] |
Benchmark Period Mean (intersection) [W/m2] |
Benchmark Period Mean (complement) [W/m2] |
Bias [W/m2] |
RMSE [W/m2] |
Phase Shift [months] |
Bias Score [1] |
RMSE Score [1] |
Seasonal Cycle Score [1] |
Spatial Distribution Score [1] |
Interannual Variability Score [1] |
Overall Score [1] |
|||
|---|---|---|---|---|---|---|---|---|---|---|---|---|---|---|---|---|---|
| Benchmark | [-] | 27.6 | |||||||||||||||
| D104 | [-] | 27.2 | 27.2 | 27.8 | 11.2 | -0.353 | 5.32 | 1.19 | 0.546 | 0.443 | 0.852 | 0.815 | 0.626 | 0.621 | |||
| LMBIRCH4 | [-] | 27.2 | 27.2 | 27.8 | 11.2 | -0.313 | 5.32 | 1.20 | 0.548 | 0.442 | 0.850 | 0.830 | 0.626 | 0.623 | |||
| PHSParam | [-] | 27.5 | 27.5 | 27.8 | 11.2 | -0.0503 | 5.26 | 1.18 | 0.567 | 0.439 | 0.852 | 0.836 | 0.636 | 0.628 | |||
| PPE | [-] | 34.3 | 34.3 | 27.8 | 11.2 | 6.57 | 8.00 | 1.21 | 0.297 | 0.430 | 0.846 | 0.748 | 0.716 | 0.578 | |||
| R15 | [-] | 27.1 | 27.1 | 27.8 | 11.2 | -0.471 | 5.37 | 1.19 | 0.536 | 0.442 | 0.851 | 0.824 | 0.625 | 0.620 |
Download Data |
Period Mean (original grids) [W/m2] |
Model Period Mean (intersection) [W/m2] |
Model Period Mean (complement) [W/m2] |
Benchmark Period Mean (intersection) [W/m2] |
Benchmark Period Mean (complement) [W/m2] |
Bias [W/m2] |
RMSE [W/m2] |
Phase Shift [months] |
Bias Score [1] |
RMSE Score [1] |
Seasonal Cycle Score [1] |
Spatial Distribution Score [1] |
Interannual Variability Score [1] |
Overall Score [1] |
|||
|---|---|---|---|---|---|---|---|---|---|---|---|---|---|---|---|---|---|
| Benchmark | [-] | 31.2 | |||||||||||||||
| D104 | [-] | 31.3 | 31.3 | 31.4 | 11.1 | -0.149 | 6.82 | 1.06 | 0.651 | 0.489 | 0.860 | 0.671 | 0.711 | 0.645 | |||
| LMBIRCH4 | [-] | 31.4 | 31.4 | 31.4 | 11.1 | -0.0244 | 6.74 | 1.04 | 0.662 | 0.490 | 0.867 | 0.672 | 0.708 | 0.648 | |||
| PHSParam | [-] | 31.5 | 31.5 | 31.4 | 11.1 | 0.0895 | 6.79 | 1.08 | 0.666 | 0.487 | 0.857 | 0.692 | 0.710 | 0.650 | |||
| PPE | [-] | 34.3 | 34.4 | 31.4 | 11.1 | 2.89 | 6.91 | 0.988 | 0.641 | 0.503 | 0.874 | 0.589 | 0.742 | 0.642 | |||
| R15 | [-] | 31.3 | 31.3 | 31.4 | 11.1 | -0.175 | 6.84 | 1.03 | 0.651 | 0.488 | 0.863 | 0.675 | 0.709 | 0.646 |
Download Data |
Period Mean (original grids) [W/m2] |
Model Period Mean (intersection) [W/m2] |
Model Period Mean (complement) [W/m2] |
Benchmark Period Mean (intersection) [W/m2] |
Benchmark Period Mean (complement) [W/m2] |
Bias [W/m2] |
RMSE [W/m2] |
Phase Shift [months] |
Bias Score [1] |
RMSE Score [1] |
Seasonal Cycle Score [1] |
Spatial Distribution Score [1] |
Interannual Variability Score [1] |
Overall Score [1] |
|||
|---|---|---|---|---|---|---|---|---|---|---|---|---|---|---|---|---|---|
| Benchmark | [-] | 30.1 | |||||||||||||||
| D104 | [-] | 33.6 | 33.7 | 30.9 | 12.2 | 1.93 | 10.8 | 0.890 | 0.522 | 0.506 | 0.895 | 0.967 | 0.682 | 0.679 | |||
| LMBIRCH4 | [-] | 33.7 | 33.7 | 30.9 | 12.2 | 2.01 | 10.8 | 0.887 | 0.522 | 0.505 | 0.894 | 0.966 | 0.681 | 0.679 | |||
| PHSParam | [-] | 33.6 | 33.6 | 30.9 | 12.2 | 1.94 | 10.7 | 0.863 | 0.521 | 0.506 | 0.898 | 0.966 | 0.678 | 0.679 | |||
| PPE | [-] | 36.4 | 36.5 | 30.9 | 12.2 | 4.66 | 11.7 | 0.880 | 0.485 | 0.483 | 0.894 | 0.956 | 0.696 | 0.666 | |||
| R15 | [-] | 33.4 | 33.5 | 30.9 | 12.2 | 1.82 | 10.7 | 0.857 | 0.523 | 0.506 | 0.897 | 0.966 | 0.680 | 0.680 |
Temporally integrated period mean