Mean State
Download Data |
Period Mean (original grids) [Pg yr-1] |
Model Period Mean (intersection) [Pg yr-1] |
Benchmark Period Mean (intersection) [Pg yr-1] |
Model Period Mean (complement) [Pg yr-1] |
Benchmark Period Mean (complement) [Pg yr-1] |
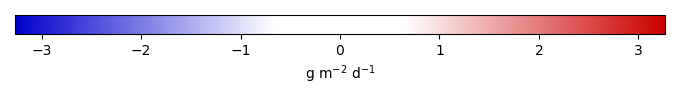
Bias [g m-2 d-1] |
RMSE [g m-2 d-1] |
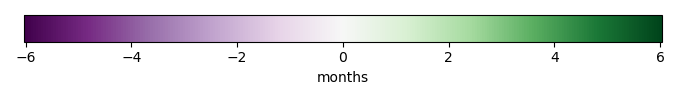
Phase Shift [months] |
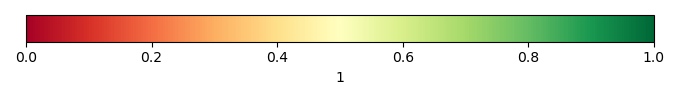
Bias Score [1] |
RMSE Score [1] |
Seasonal Cycle Score [1] |
Spatial Distribution Score [1] |
Overall Score [1] |
|||
|---|---|---|---|---|---|---|---|---|---|---|---|---|---|---|---|---|
| Benchmark | [-] | 119. | ||||||||||||||
| PPE | [-] | 126. | 116. | 118. | 9.81 | 0.413 | 0.281 | 1.51 | 1.40 | 0.473 | 0.429 | 0.784 | 0.952 | 0.614 | ||
| PPEnocrop | [-] | 135. | 124. | 118. | 10.6 | 0.413 | 0.468 | 1.52 | 1.27 | 0.459 | 0.450 | 0.802 | 0.947 | 0.622 | ||
| R15 | [-] | 118. | 109. | 118. | 9.30 | 0.413 | 0.0966 | 1.50 | 1.37 | 0.430 | 0.461 | 0.782 | 0.934 | 0.613 |
Temporally integrated period mean