Mean State
Download Data |
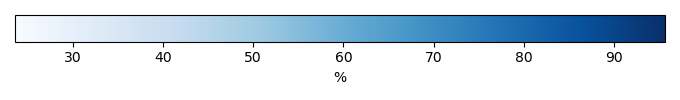
Period Mean (original grids) [%] |
Model Period Mean (intersection) [%] |
Benchmark Period Mean (intersection) [%] |
Model Period Mean (complement) [%] |
Benchmark Period Mean (complement) [%] |
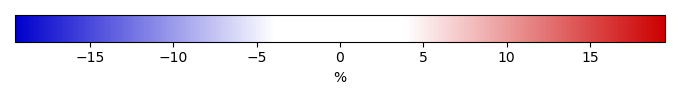
Bias [%] |
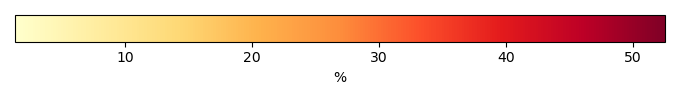
RMSE [%] |
Phase Shift [months] |
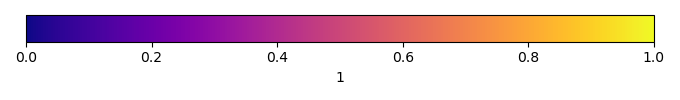
Bias Score [1] |
RMSE Score [1] |
Seasonal Cycle Score [1] |
Spatial Distribution Score [1] |
Overall Score [1] |
|||
|---|---|---|---|---|---|---|---|---|---|---|---|---|---|---|---|---|
| Benchmark | [-] | 62.5 | ||||||||||||||
| CLM50 | [-] | 69.7 | 69.7 | 61.1 | 88.5 | 9.42 | 14.7 | 1.43 | 0.329 | 0.485 | 0.796 | 0.940 | 0.607 | |||
| CTSM51 | [-] | 70.9 | 70.9 | 61.1 | 88.5 | 10.6 | 15.3 | 1.43 | 0.303 | 0.493 | 0.797 | 0.931 | 0.604 |
Temporally integrated period mean