Mean State
Download Data |
Period Mean (original grids) [Pg] |
Model Period Mean (intersection) [Pg] |
Benchmark Period Mean (intersection) [Pg] |
Model Period Mean (complement) [Pg] |
Benchmark Period Mean (complement) [Pg] |
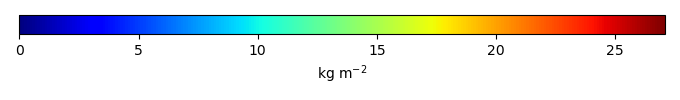
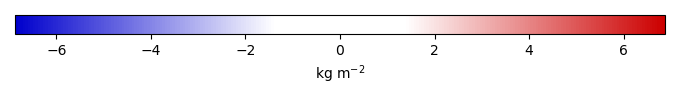
Bias [kg m-2] |
Bias Score [1] |
Spatial Distribution Score [1] |
Overall Score [1] |
|||
|---|---|---|---|---|---|---|---|---|---|---|---|---|
| Benchmark | [-] | 4.43 | ||||||||||
| CLM50 | [-] | 3.78 | 3.57 | 4.36 | 0.227 | 0.0705 | -0.160 | 0.569 | 0.815 | 0.692 | ||
| CTSM51 | [-] | 4.91 | 4.76 | 4.36 | 0.193 | 0.0705 | 0.279 | 0.514 | 0.739 | 0.626 | ||
| DeadVeg | [-] | 10.1 | 9.77 | 4.36 | 0.394 | 0.0705 | 2.13 | 0.275 | 0.579 | 0.427 |
Download Data |
Period Mean (original grids) [Pg] |
Model Period Mean (intersection) [Pg] |
Benchmark Period Mean (intersection) [Pg] |
Model Period Mean (complement) [Pg] |
Benchmark Period Mean (complement) [Pg] |
Bias [kg m-2] |
Bias Score [1] |
Spatial Distribution Score [1] |
Overall Score [1] |
|||
|---|---|---|---|---|---|---|---|---|---|---|---|---|
| Benchmark | [-] | 40.1 | ||||||||||
| CLM50 | [-] | 52.8 | 51.5 | 39.9 | 0.362 | 0.184 | 1.47 | 0.462 | 0.333 | 0.397 | ||
| CTSM51 | [-] | 65.2 | 63.8 | 39.9 | 0.381 | 0.184 | 2.84 | 0.431 | 0.342 | 0.386 | ||
| DeadVeg | [-] | 96.8 | 94.8 | 39.9 | 0.410 | 0.184 | 6.29 | 0.288 | 0.422 | 0.355 |
Download Data |
Period Mean (original grids) [Pg] |
Model Period Mean (intersection) [Pg] |
Benchmark Period Mean (intersection) [Pg] |
Model Period Mean (complement) [Pg] |
Benchmark Period Mean (complement) [Pg] |
Bias [kg m-2] |
Bias Score [1] |
Spatial Distribution Score [1] |
Overall Score [1] |
|||
|---|---|---|---|---|---|---|---|---|---|---|---|---|
| Benchmark | [-] | 28.0 | ||||||||||
| CLM50 | [-] | 40.8 | 16.7 | 27.7 | 25.0 | 0.322 | -0.949 | 0.488 | 0.577 | 0.532 | ||
| CTSM51 | [-] | 45.9 | 18.9 | 27.7 | 27.9 | 0.322 | -0.638 | 0.483 | 0.514 | 0.499 | ||
| DeadVeg | [-] | 51.2 | 24.8 | 27.7 | 27.4 | 0.322 | 0.124 | 0.507 | 0.449 | 0.478 |
Download Data |
Period Mean (original grids) [Pg] |
Model Period Mean (intersection) [Pg] |
Benchmark Period Mean (intersection) [Pg] |
Model Period Mean (complement) [Pg] |
Benchmark Period Mean (complement) [Pg] |
Bias [kg m-2] |
Bias Score [1] |
Spatial Distribution Score [1] |
Overall Score [1] |
|||
|---|---|---|---|---|---|---|---|---|---|---|---|---|
| Benchmark | [-] | 0.341 | ||||||||||
| CLM50 | [-] | 30.6 | 0.0871 | 0.341 | 29.5 | -1.79 | 0.458 | 0.802 | 0.630 | |||
| CTSM51 | [-] | 31.2 | 0.107 | 0.341 | 30.0 | -1.64 | 0.463 | 0.793 | 0.628 | |||
| DeadVeg | [-] | 39.2 | 0.0889 | 0.341 | 38.3 | -1.77 | 0.485 | 0.823 | 0.654 |
Download Data |
Period Mean (original grids) [Pg] |
Model Period Mean (intersection) [Pg] |
Benchmark Period Mean (intersection) [Pg] |
Model Period Mean (complement) [Pg] |
Benchmark Period Mean (complement) [Pg] |
Bias [kg m-2] |
Bias Score [1] |
Spatial Distribution Score [1] |
Overall Score [1] |
|||
|---|---|---|---|---|---|---|---|---|---|---|---|---|
| Benchmark | [-] | 3.80 | ||||||||||
| CLM50 | [-] | 5.74 | 5.18 | 3.79 | 0.908 | 0.00634 | 0.601 | 0.536 | 0.573 | 0.554 | ||
| CTSM51 | [-] | 6.71 | 6.47 | 3.79 | 0.615 | 0.00634 | 1.10 | 0.459 | 0.591 | 0.525 | ||
| DeadVeg | [-] | 11.9 | 11.2 | 3.79 | 1.29 | 0.00634 | 3.00 | 0.201 | 0.405 | 0.303 |
Download Data |
Period Mean (original grids) [Pg] |
Model Period Mean (intersection) [Pg] |
Benchmark Period Mean (intersection) [Pg] |
Model Period Mean (complement) [Pg] |
Benchmark Period Mean (complement) [Pg] |
Bias [kg m-2] |
Bias Score [1] |
Spatial Distribution Score [1] |
Overall Score [1] |
|||
|---|---|---|---|---|---|---|---|---|---|---|---|---|
| Benchmark | [-] | 29.4 | ||||||||||
| CLM50 | [-] | 18.4 | 17.4 | 28.9 | 0.627 | 0.540 | -1.27 | 0.520 | 0.627 | 0.574 | ||
| CTSM51 | [-] | 20.1 | 19.1 | 28.9 | 0.701 | 0.540 | -0.874 | 0.526 | 0.586 | 0.556 | ||
| DeadVeg | [-] | 21.9 | 21.0 | 28.9 | 0.564 | 0.540 | -0.661 | 0.524 | 0.594 | 0.559 |
Download Data |
Period Mean (original grids) [Pg] |
Model Period Mean (intersection) [Pg] |
Benchmark Period Mean (intersection) [Pg] |
Model Period Mean (complement) [Pg] |
Benchmark Period Mean (complement) [Pg] |
Bias [kg m-2] |
Bias Score [1] |
Spatial Distribution Score [1] |
Overall Score [1] |
|||
|---|---|---|---|---|---|---|---|---|---|---|---|---|
| Benchmark | [-] | 174. | ||||||||||
| CLM50 | [-] | 562. | 176. | 172. | 384. | 2.04 | 0.429 | 0.478 | 0.558 | 0.518 | ||
| CTSM51 | [-] | 611. | 204. | 172. | 405. | 2.04 | 1.04 | 0.462 | 0.515 | 0.489 | ||
| DeadVeg | [-] | 834. | 270. | 172. | 561. | 2.04 | 2.44 | 0.390 | 0.453 | 0.421 |
Download Data |
Period Mean (original grids) [Pg] |
Model Period Mean (intersection) [Pg] |
Benchmark Period Mean (intersection) [Pg] |
Model Period Mean (complement) [Pg] |
Benchmark Period Mean (complement) [Pg] |
Bias [kg m-2] |
Bias Score [1] |
Spatial Distribution Score [1] |
Overall Score [1] |
|||
|---|---|---|---|---|---|---|---|---|---|---|---|---|
| Benchmark | [-] | 4.88 | ||||||||||
| CLM50 | [-] | 1.96 | 0.737 | 4.82 | 1.24 | 0.0615 | -2.69 | 0.457 | 0.671 | 0.564 | ||
| CTSM51 | [-] | 2.56 | 1.17 | 4.82 | 1.40 | 0.0615 | -2.22 | 0.483 | 0.821 | 0.652 | ||
| DeadVeg | [-] | 3.25 | 1.61 | 4.82 | 1.65 | 0.0615 | -1.99 | 0.546 | 0.874 | 0.710 |
Download Data |
Period Mean (original grids) [Pg] |
Model Period Mean (intersection) [Pg] |
Benchmark Period Mean (intersection) [Pg] |
Model Period Mean (complement) [Pg] |
Benchmark Period Mean (complement) [Pg] |
Bias [kg m-2] |
Bias Score [1] |
Spatial Distribution Score [1] |
Overall Score [1] |
|||
|---|---|---|---|---|---|---|---|---|---|---|---|---|
| Benchmark | [-] | 9.77 | ||||||||||
| CLM50 | [-] | 12.6 | 12.1 | 9.60 | 0.292 | 0.175 | 0.592 | 0.435 | 0.620 | 0.528 | ||
| CTSM51 | [-] | 12.7 | 12.3 | 9.60 | 0.261 | 0.175 | 0.636 | 0.422 | 0.605 | 0.514 | ||
| DeadVeg | [-] | 19.5 | 18.8 | 9.60 | 0.497 | 0.175 | 1.90 | 0.321 | 0.510 | 0.415 |
Download Data |
Period Mean (original grids) [Pg] |
Model Period Mean (intersection) [Pg] |
Benchmark Period Mean (intersection) [Pg] |
Model Period Mean (complement) [Pg] |
Benchmark Period Mean (complement) [Pg] |
Bias [kg m-2] |
Bias Score [1] |
Spatial Distribution Score [1] |
Overall Score [1] |
|||
|---|---|---|---|---|---|---|---|---|---|---|---|---|
| Benchmark | [-] | 0.211 | ||||||||||
| CLM50 | [-] | 12.1 | 0.0450 | 0.210 | 11.7 | 0.000277 | -1.36 | 0.494 | 0.872 | 0.683 | ||
| CTSM51 | [-] | 13.2 | 0.0619 | 0.210 | 12.8 | 0.000277 | -1.17 | 0.535 | 0.847 | 0.691 | ||
| DeadVeg | [-] | 15.6 | 0.0786 | 0.210 | 15.1 | 0.000277 | -1.02 | 0.582 | 0.888 | 0.735 |
Download Data |
Period Mean (original grids) [Pg] |
Model Period Mean (intersection) [Pg] |
Benchmark Period Mean (intersection) [Pg] |
Model Period Mean (complement) [Pg] |
Benchmark Period Mean (complement) [Pg] |
Bias [kg m-2] |
Bias Score [1] |
Spatial Distribution Score [1] |
Overall Score [1] |
|||
|---|---|---|---|---|---|---|---|---|---|---|---|---|
| Benchmark | [-] | 16.1 | ||||||||||
| CLM50 | [-] | 17.6 | 16.5 | 16.1 | 0.931 | 0.0548 | 0.456 | 0.581 | 0.498 | 0.539 | ||
| CTSM51 | [-] | 18.7 | 17.4 | 16.1 | 1.10 | 0.0548 | 0.710 | 0.564 | 0.450 | 0.507 | ||
| DeadVeg | [-] | 20.4 | 19.1 | 16.1 | 1.18 | 0.0548 | 1.10 | 0.527 | 0.348 | 0.437 |
Download Data |
Period Mean (original grids) [Pg] |
Model Period Mean (intersection) [Pg] |
Benchmark Period Mean (intersection) [Pg] |
Model Period Mean (complement) [Pg] |
Benchmark Period Mean (complement) [Pg] |
Bias [kg m-2] |
Bias Score [1] |
Spatial Distribution Score [1] |
Overall Score [1] |
|||
|---|---|---|---|---|---|---|---|---|---|---|---|---|
| Benchmark | [-] | 24.5 | ||||||||||
| CLM50 | [-] | 48.4 | 48.2 | 24.0 | 0.440 | 0.527 | 5.08 | 0.323 | 0.493 | 0.408 | ||
| CTSM51 | [-] | 52.7 | 52.4 | 24.0 | 0.460 | 0.527 | 5.87 | 0.296 | 0.450 | 0.373 | ||
| DeadVeg | [-] | 60.5 | 60.2 | 24.0 | 0.531 | 0.527 | 7.39 | 0.245 | 0.448 | 0.346 |
Download Data |
Period Mean (original grids) [Pg] |
Model Period Mean (intersection) [Pg] |
Benchmark Period Mean (intersection) [Pg] |
Model Period Mean (complement) [Pg] |
Benchmark Period Mean (complement) [Pg] |
Bias [kg m-2] |
Bias Score [1] |
Spatial Distribution Score [1] |
Overall Score [1] |
|||
|---|---|---|---|---|---|---|---|---|---|---|---|---|
| Benchmark | [-] | 12.8 | ||||||||||
| CLM50 | [-] | 4.56 | 4.36 | 12.7 | 0.251 | 0.0995 | -2.22 | 0.509 | 0.862 | 0.686 | ||
| CTSM51 | [-] | 7.88 | 7.61 | 12.7 | 0.317 | 0.0995 | -1.25 | 0.549 | 0.787 | 0.668 | ||
| DeadVeg | [-] | 9.09 | 8.79 | 12.7 | 0.351 | 0.0995 | -0.926 | 0.530 | 0.708 | 0.619 |
Temporally integrated period mean