Mean State
Download Data |
Period Mean (original grids) [Pg] |
Model Period Mean (intersection) [Pg] |
Benchmark Period Mean (intersection) [Pg] |
Model Period Mean (complement) [Pg] |
Benchmark Period Mean (complement) [Pg] |
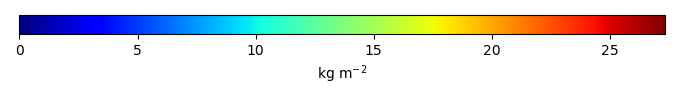
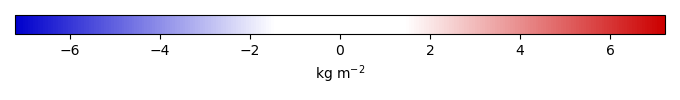
Bias [kg m-2] |
Bias Score [1] |
Spatial Distribution Score [1] |
Overall Score [1] |
|||
|---|---|---|---|---|---|---|---|---|---|---|---|---|
| Benchmark | [-] | 38.7 | ||||||||||
| CLM50 | [-] | 45.6 | 46.0 | 38.7 | 0.237 | 0.0457 | 1.98 | 0.585 | 0.889 | 0.737 | ||
| CTSM51 | [-] | 47.9 | 48.3 | 38.7 | 0.256 | 0.0457 | 2.53 | 0.575 | 0.869 | 0.722 | ||
| DeadVeg | [-] | 70.3 | 71.7 | 38.7 | 0.250 | 0.0457 | 7.76 | 0.437 | 0.603 | 0.520 |
Download Data |
Period Mean (original grids) [Pg] |
Model Period Mean (intersection) [Pg] |
Benchmark Period Mean (intersection) [Pg] |
Model Period Mean (complement) [Pg] |
Benchmark Period Mean (complement) [Pg] |
Bias [kg m-2] |
Bias Score [1] |
Spatial Distribution Score [1] |
Overall Score [1] |
|||
|---|---|---|---|---|---|---|---|---|---|---|---|---|
| Benchmark | [-] | 11.9 | ||||||||||
| CLM50 | [-] | 4.52 | 3.98 | 11.9 | 0.0493 | 0.0196 | -1.17 | 0.457 | 0.758 | 0.607 | ||
| CTSM51 | [-] | 5.05 | 4.43 | 11.9 | 0.0447 | 0.0196 | -1.10 | 0.470 | 0.801 | 0.636 | ||
| DeadVeg | [-] | 9.49 | 8.29 | 11.9 | 0.0385 | 0.0196 | -0.527 | 0.502 | 0.668 | 0.585 |
Download Data |
Period Mean (original grids) [Pg] |
Model Period Mean (intersection) [Pg] |
Benchmark Period Mean (intersection) [Pg] |
Model Period Mean (complement) [Pg] |
Benchmark Period Mean (complement) [Pg] |
Bias [kg m-2] |
Bias Score [1] |
Spatial Distribution Score [1] |
Overall Score [1] |
|||
|---|---|---|---|---|---|---|---|---|---|---|---|---|
| Benchmark | [-] | 24.6 | ||||||||||
| CLM50 | [-] | 15.2 | 14.5 | 24.5 | 0.428 | 0.0612 | -0.880 | 0.491 | 0.744 | 0.618 | ||
| CTSM51 | [-] | 15.1 | 14.4 | 24.5 | 0.441 | 0.0612 | -0.897 | 0.475 | 0.712 | 0.593 | ||
| DeadVeg | [-] | 28.2 | 27.1 | 24.5 | 0.448 | 0.0612 | 0.482 | 0.453 | 0.445 | 0.449 |
Download Data |
Period Mean (original grids) [Pg] |
Model Period Mean (intersection) [Pg] |
Benchmark Period Mean (intersection) [Pg] |
Model Period Mean (complement) [Pg] |
Benchmark Period Mean (complement) [Pg] |
Bias [kg m-2] |
Bias Score [1] |
Spatial Distribution Score [1] |
Overall Score [1] |
|||
|---|---|---|---|---|---|---|---|---|---|---|---|---|
| Benchmark | [-] | 36.8 | ||||||||||
| CLM50 | [-] | 47.2 | 44.9 | 35.7 | 2.11 | 1.10 | 7.95 | 0.471 | 0.932 | 0.702 | ||
| CTSM51 | [-] | 52.3 | 49.7 | 35.7 | 2.34 | 1.10 | 9.86 | 0.427 | 0.905 | 0.666 | ||
| DeadVeg | [-] | 68.5 | 65.2 | 35.7 | 2.95 | 1.10 | 15.8 | 0.295 | 0.794 | 0.544 |
Download Data |
Period Mean (original grids) [Pg] |
Model Period Mean (intersection) [Pg] |
Benchmark Period Mean (intersection) [Pg] |
Model Period Mean (complement) [Pg] |
Benchmark Period Mean (complement) [Pg] |
Bias [kg m-2] |
Bias Score [1] |
Spatial Distribution Score [1] |
Overall Score [1] |
|||
|---|---|---|---|---|---|---|---|---|---|---|---|---|
| Benchmark | [-] | 38.4 | ||||||||||
| CLM50 | [-] | 40.9 | 30.8 | 38.3 | 10.9 | 0.0891 | -0.414 | 0.505 | 0.646 | 0.575 | ||
| CTSM51 | [-] | 45.9 | 34.1 | 38.3 | 12.7 | 0.0891 | 0.0339 | 0.511 | 0.622 | 0.566 | ||
| DeadVeg | [-] | 51.4 | 33.7 | 38.3 | 18.7 | 0.0891 | -0.0933 | 0.521 | 0.643 | 0.582 |
Download Data |
Period Mean (original grids) [Pg] |
Model Period Mean (intersection) [Pg] |
Benchmark Period Mean (intersection) [Pg] |
Model Period Mean (complement) [Pg] |
Benchmark Period Mean (complement) [Pg] |
Bias [kg m-2] |
Bias Score [1] |
Spatial Distribution Score [1] |
Overall Score [1] |
|||
|---|---|---|---|---|---|---|---|---|---|---|---|---|
| Benchmark | [-] | 43.7 | ||||||||||
| CLM50 | [-] | 30.7 | 28.8 | 43.4 | 0.791 | 0.257 | -1.05 | 0.511 | 0.861 | 0.686 | ||
| CTSM51 | [-] | 31.2 | 29.3 | 43.4 | 0.822 | 0.257 | -0.919 | 0.515 | 0.853 | 0.684 | ||
| DeadVeg | [-] | 39.2 | 37.6 | 43.4 | 0.821 | 0.257 | 0.265 | 0.538 | 0.817 | 0.677 |
Download Data |
Period Mean (original grids) [Pg] |
Model Period Mean (intersection) [Pg] |
Benchmark Period Mean (intersection) [Pg] |
Model Period Mean (complement) [Pg] |
Benchmark Period Mean (complement) [Pg] |
Bias [kg m-2] |
Bias Score [1] |
Spatial Distribution Score [1] |
Overall Score [1] |
|||
|---|---|---|---|---|---|---|---|---|---|---|---|---|
| Benchmark | [-] | 13.7 | ||||||||||
| CLM50 | [-] | 13.0 | 4.86 | 13.5 | 7.99 | 0.139 | -1.14 | 0.452 | 0.594 | 0.523 | ||
| CTSM51 | [-] | 12.7 | 4.85 | 13.5 | 7.64 | 0.139 | -1.16 | 0.456 | 0.610 | 0.533 | ||
| DeadVeg | [-] | 14.5 | 6.23 | 13.5 | 8.04 | 0.139 | -0.934 | 0.460 | 0.517 | 0.489 |
Download Data |
Period Mean (original grids) [Pg] |
Model Period Mean (intersection) [Pg] |
Benchmark Period Mean (intersection) [Pg] |
Model Period Mean (complement) [Pg] |
Benchmark Period Mean (complement) [Pg] |
Bias [kg m-2] |
Bias Score [1] |
Spatial Distribution Score [1] |
Overall Score [1] |
|||
|---|---|---|---|---|---|---|---|---|---|---|---|---|
| Benchmark | [-] | 349. | ||||||||||
| CLM50 | [-] | 562. | 374. | 347. | 186. | 2.11 | 1.08 | 0.501 | 0.765 | 0.633 | ||
| CTSM51 | [-] | 611. | 396. | 347. | 212. | 2.11 | 1.44 | 0.493 | 0.722 | 0.607 | ||
| DeadVeg | [-] | 834. | 552. | 347. | 280. | 2.11 | 3.76 | 0.443 | 0.501 | 0.472 |
Download Data |
Period Mean (original grids) [Pg] |
Model Period Mean (intersection) [Pg] |
Benchmark Period Mean (intersection) [Pg] |
Model Period Mean (complement) [Pg] |
Benchmark Period Mean (complement) [Pg] |
Bias [kg m-2] |
Bias Score [1] |
Spatial Distribution Score [1] |
Overall Score [1] |
|||
|---|---|---|---|---|---|---|---|---|---|---|---|---|
| Benchmark | [-] | 2.53 | ||||||||||
| CLM50 | [-] | 1.98 | 0.270 | 2.53 | 1.73 | 0.00250 | -1.01 | 0.467 | 0.0333 | 0.250 | ||
| CTSM51 | [-] | 2.58 | 0.280 | 2.53 | 2.31 | 0.00250 | -1.01 | 0.472 | 0.0407 | 0.256 | ||
| DeadVeg | [-] | 3.26 | 0.364 | 2.53 | 2.91 | 0.00250 | -0.973 | 0.480 | 0.0613 | 0.271 |
Download Data |
Period Mean (original grids) [Pg] |
Model Period Mean (intersection) [Pg] |
Benchmark Period Mean (intersection) [Pg] |
Model Period Mean (complement) [Pg] |
Benchmark Period Mean (complement) [Pg] |
Bias [kg m-2] |
Bias Score [1] |
Spatial Distribution Score [1] |
Overall Score [1] |
|||
|---|---|---|---|---|---|---|---|---|---|---|---|---|
| Benchmark | [-] | 11.1 | ||||||||||
| CLM50 | [-] | 12.1 | 11.1 | 10.9 | 0.641 | 0.149 | 1.57 | 0.490 | 0.685 | 0.588 | ||
| CTSM51 | [-] | 13.1 | 12.1 | 10.9 | 0.697 | 0.149 | 1.97 | 0.486 | 0.638 | 0.562 | ||
| DeadVeg | [-] | 15.5 | 14.5 | 10.9 | 0.656 | 0.149 | 2.81 | 0.468 | 0.536 | 0.502 |
Download Data |
Period Mean (original grids) [Pg] |
Model Period Mean (intersection) [Pg] |
Benchmark Period Mean (intersection) [Pg] |
Model Period Mean (complement) [Pg] |
Benchmark Period Mean (complement) [Pg] |
Bias [kg m-2] |
Bias Score [1] |
Spatial Distribution Score [1] |
Overall Score [1] |
|||
|---|---|---|---|---|---|---|---|---|---|---|---|---|
| Benchmark | [-] | 1.55 | ||||||||||
| CLM50 | [-] | 17.6 | 3.13 | 1.52 | 14.4 | 0.0247 | 3.01 | 0.375 | 0.567 | 0.471 | ||
| CTSM51 | [-] | 18.7 | 3.94 | 1.52 | 14.6 | 0.0247 | 4.14 | 0.325 | 0.488 | 0.407 | ||
| DeadVeg | [-] | 20.5 | 5.28 | 1.52 | 15.1 | 0.0247 | 5.81 | 0.286 | 0.295 | 0.291 |
Download Data |
Period Mean (original grids) [Pg] |
Model Period Mean (intersection) [Pg] |
Benchmark Period Mean (intersection) [Pg] |
Model Period Mean (complement) [Pg] |
Benchmark Period Mean (complement) [Pg] |
Bias [kg m-2] |
Bias Score [1] |
Spatial Distribution Score [1] |
Overall Score [1] |
|||
|---|---|---|---|---|---|---|---|---|---|---|---|---|
| Benchmark | [-] | 0.219 | ||||||||||
| CLM50 | [-] | 4.57 | 0.136 | 0.219 | 4.48 | -0.275 | 0.603 | 0.132 | 0.367 | |||
| CTSM51 | [-] | 7.90 | 0.183 | 0.219 | 7.76 | -0.130 | 0.596 | 0.272 | 0.434 | |||
| DeadVeg | [-] | 9.12 | 0.237 | 0.219 | 8.93 | 0.0377 | 0.580 | 0.487 | 0.534 |
Download Data |
Period Mean (original grids) [Pg] |
Model Period Mean (intersection) [Pg] |
Benchmark Period Mean (intersection) [Pg] |
Model Period Mean (complement) [Pg] |
Benchmark Period Mean (complement) [Pg] |
Bias [kg m-2] |
Bias Score [1] |
Spatial Distribution Score [1] |
Overall Score [1] |
|||
|---|---|---|---|---|---|---|---|---|---|---|---|---|
| Benchmark | [-] | 100. | ||||||||||
| CLM50 | [-] | 152. | 151. | 100. | 0.461 | 0.0690 | 6.49 | 0.543 | 0.837 | 0.690 | ||
| CTSM51 | [-] | 159. | 158. | 100. | 0.493 | 0.0690 | 7.33 | 0.519 | 0.779 | 0.649 | ||
| DeadVeg | [-] | 235. | 234. | 100. | 0.561 | 0.0690 | 16.4 | 0.281 | 0.524 | 0.403 |
Download Data |
Period Mean (original grids) [Pg] |
Model Period Mean (intersection) [Pg] |
Benchmark Period Mean (intersection) [Pg] |
Model Period Mean (complement) [Pg] |
Benchmark Period Mean (complement) [Pg] |
Bias [kg m-2] |
Bias Score [1] |
Spatial Distribution Score [1] |
Overall Score [1] |
|||
|---|---|---|---|---|---|---|---|---|---|---|---|---|
| Benchmark | [-] | 18.4 | ||||||||||
| CLM50 | [-] | 27.4 | 27.5 | 18.4 | 0.402 | 0.0281 | 1.63 | 0.514 | 0.510 | 0.512 | ||
| CTSM51 | [-] | 28.6 | 28.6 | 18.4 | 0.427 | 0.0281 | 1.81 | 0.492 | 0.502 | 0.497 | ||
| DeadVeg | [-] | 38.8 | 39.0 | 18.4 | 0.461 | 0.0281 | 3.35 | 0.409 | 0.481 | 0.445 |
Download Data |
Period Mean (original grids) [Pg] |
Model Period Mean (intersection) [Pg] |
Benchmark Period Mean (intersection) [Pg] |
Model Period Mean (complement) [Pg] |
Benchmark Period Mean (complement) [Pg] |
Bias [kg m-2] |
Bias Score [1] |
Spatial Distribution Score [1] |
Overall Score [1] |
|||
|---|---|---|---|---|---|---|---|---|---|---|---|---|
| Benchmark | [-] | 7.28 | ||||||||||
| CLM50 | [-] | 7.18 | 7.04 | 7.15 | 0.161 | 0.128 | 0.747 | 0.517 | 0.484 | 0.501 | ||
| CTSM51 | [-] | 7.85 | 7.76 | 7.15 | 0.153 | 0.128 | 1.06 | 0.505 | 0.417 | 0.461 | ||
| DeadVeg | [-] | 8.33 | 8.22 | 7.15 | 0.162 | 0.128 | 1.40 | 0.494 | 0.330 | 0.412 |
Temporally integrated period mean