Mean State
Download Data |
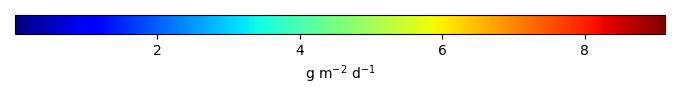
Period Mean (original grids) [g m-2 d-1] |
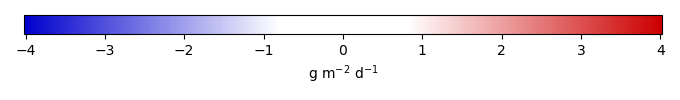
Bias [g m-2 d-1] |
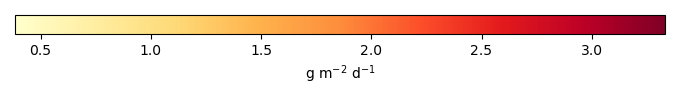
RMSE [g m-2 d-1] |
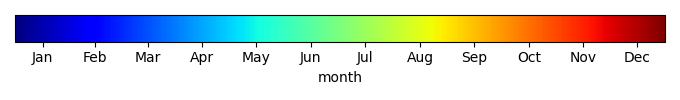
Phase Shift [months] |
Bias Score [1] |
RMSE Score [1] |
Seasonal Cycle Score [1] |
Overall Score [1] |
|||
|---|---|---|---|---|---|---|---|---|---|---|---|
| Benchmark | [-] | 4.46 | |||||||||
| CLM50 | [-] | 8.17 | 3.71 | 4.27 | 1.51 | 0.184 | 0.284 | 0.818 | 0.393 | ||
| CTSM51 | [-] | 7.71 | 3.25 | 3.97 | 1.51 | 0.189 | 0.247 | 0.818 | 0.375 | ||
| DeadVeg | [-] | 7.14 | 2.68 | 3.35 | 2.02 | 0.207 | 0.269 | 0.656 | 0.350 |
Download Data |
Period Mean (original grids) [g m-2 d-1] |
Bias [g m-2 d-1] |
RMSE [g m-2 d-1] |
Phase Shift [months] |
Bias Score [1] |
RMSE Score [1] |
Seasonal Cycle Score [1] |
Overall Score [1] |
|||
|---|---|---|---|---|---|---|---|---|---|---|---|
| Benchmark | [-] | 3.18 | |||||||||
| CLM50 | [-] | 1.24 | -1.94 | 2.93 | 0.00 | 0.0868 | 0.00 | 1.00 | 0.272 | ||
| CTSM51 | [-] | 1.26 | -1.92 | 2.88 | 0.00 | 0.0877 | 0.00 | 1.00 | 0.272 | ||
| DeadVeg | [-] | 1.45 | -1.73 | 2.77 | 0.508 | 0.158 | 0.00 | 0.953 | 0.278 |
Download Data |
Period Mean (original grids) [g m-2 d-1] |
Bias [g m-2 d-1] |
RMSE [g m-2 d-1] |
Phase Shift [months] |
Bias Score [1] |
RMSE Score [1] |
Seasonal Cycle Score [1] |
Overall Score [1] |
|||
|---|---|---|---|---|---|---|---|---|---|---|---|
| Benchmark | [-] | 5.73 | |||||||||
| CLM50 | [-] | 0.718 | -5.01 | 6.10 | 2.02 | 0.00 | 0.00 | 0.752 | 0.188 | ||
| CTSM51 | [-] | 0.554 | -5.17 | 6.24 | 2.02 | 0.00 | 0.00 | 0.752 | 0.188 | ||
| DeadVeg | [-] | 0.687 | -5.04 | 6.12 | 2.02 | 0.00 | 0.00 | 0.752 | 0.188 |
Download Data |
Period Mean (original grids) [g m-2 d-1] |
Bias [g m-2 d-1] |
RMSE [g m-2 d-1] |
Phase Shift [months] |
Bias Score [1] |
RMSE Score [1] |
Seasonal Cycle Score [1] |
Overall Score [1] |
|||
|---|---|---|---|---|---|---|---|---|---|---|---|
| Benchmark | [-] | 0.768 | |||||||||
| CLM50 | [-] | 1.29 | 0.518 | 1.45 | 0.517 | 0.126 | 0.00 | 0.963 | 0.272 | ||
| CTSM51 | [-] | 1.17 | 0.405 | 1.46 | 0.00 | 0.389 | 0.0137 | 1.00 | 0.354 | ||
| DeadVeg | [-] | 2.34 | 1.58 | 3.20 | 0.517 | 0.00 | 0.00 | 0.963 | 0.241 |
Download Data |
Period Mean (original grids) [g m-2 d-1] |
Bias [g m-2 d-1] |
RMSE [g m-2 d-1] |
Phase Shift [months] |
Bias Score [1] |
RMSE Score [1] |
Seasonal Cycle Score [1] |
Overall Score [1] |
|||
|---|---|---|---|---|---|---|---|---|---|---|---|
| Benchmark | [-] | 4.40 | |||||||||
| CLM50 | [-] | 6.07 | 1.67 | 2.01 | 1.02 | 0.298 | 0.563 | 0.933 | 0.589 | ||
| CTSM51 | [-] | 6.31 | 1.91 | 2.22 | 1.02 | 0.197 | 0.563 | 0.933 | 0.564 | ||
| DeadVeg | [-] | 7.32 | 2.92 | 3.18 | 1.02 | 0.00 | 0.493 | 0.933 | 0.480 |
Download Data |
Period Mean (original grids) [g m-2 d-1] |
Bias [g m-2 d-1] |
RMSE [g m-2 d-1] |
Phase Shift [months] |
Bias Score [1] |
RMSE Score [1] |
Seasonal Cycle Score [1] |
Overall Score [1] |
|||
|---|---|---|---|---|---|---|---|---|---|---|---|
| Benchmark | [-] | 2.73 | |||||||||
| CLM50 | [-] | 2.37 | -0.360 | 1.25 | 0.508 | 0.578 | 0.106 | 0.981 | 0.443 | ||
| CTSM51 | [-] | 2.32 | -0.407 | 1.36 | 0.00 | 0.432 | 0.0772 | 1.00 | 0.397 | ||
| DeadVeg | [-] | 3.13 | 0.403 | 1.74 | 0.00 | 0.578 | 0.0691 | 1.00 | 0.429 |
Download Data |
Period Mean (original grids) [g m-2 d-1] |
Bias [g m-2 d-1] |
RMSE [g m-2 d-1] |
Phase Shift [months] |
Bias Score [1] |
RMSE Score [1] |
Seasonal Cycle Score [1] |
Overall Score [1] |
|||
|---|---|---|---|---|---|---|---|---|---|---|---|
| Benchmark | [-] | 1.99 | |||||||||
| CLM50 | [-] | 2.73 | 0.734 | 1.36 | 0.857 | 0.350 | 0.308 | 0.895 | 0.465 | ||
| CTSM51 | [-] | 2.96 | 0.965 | 1.58 | 0.857 | 0.148 | 0.264 | 0.895 | 0.393 | ||
| DeadVeg | [-] | 3.07 | 1.08 | 1.66 | 0.772 | 0.158 | 0.247 | 0.906 | 0.389 |
Download Data |
Period Mean (original grids) [g m-2 d-1] |
Bias [g m-2 d-1] |
RMSE [g m-2 d-1] |
Phase Shift [months] |
Bias Score [1] |
RMSE Score [1] |
Seasonal Cycle Score [1] |
Overall Score [1] |
|||
|---|---|---|---|---|---|---|---|---|---|---|---|
| Benchmark | [-] | 2.50 | |||||||||
| CLM50 | [-] | 2.74 | 0.324 | 2.41 | 1.51 | 0.265 | 0.138 | 0.837 | 0.344 | ||
| CTSM51 | [-] | 2.27 | -0.154 | 2.24 | 1.33 | 0.207 | 0.153 | 0.870 | 0.346 | ||
| DeadVeg | [-] | 2.67 | 0.252 | 2.53 | 1.33 | 0.262 | 0.111 | 0.857 | 0.335 |
Download Data |
Period Mean (original grids) [g m-2 d-1] |
Bias [g m-2 d-1] |
RMSE [g m-2 d-1] |
Phase Shift [months] |
Bias Score [1] |
RMSE Score [1] |
Seasonal Cycle Score [1] |
Overall Score [1] |
|||
|---|---|---|---|---|---|---|---|---|---|---|---|
| Benchmark | [-] | 3.05 | |||||||||
| CLM50 | [-] | 3.00 | -0.0496 | 1.66 | 0.694 | 0.400 | 0.129 | 0.948 | 0.402 | ||
| CTSM51 | [-] | 2.99 | -0.0585 | 1.65 | 0.571 | 0.377 | 0.140 | 0.956 | 0.403 | ||
| DeadVeg | [-] | 2.94 | -0.107 | 1.77 | 0.664 | 0.338 | 0.128 | 0.951 | 0.386 |
Download Data |
Period Mean (original grids) [g m-2 d-1] |
Bias [g m-2 d-1] |
RMSE [g m-2 d-1] |
Phase Shift [months] |
Bias Score [1] |
RMSE Score [1] |
Seasonal Cycle Score [1] |
Overall Score [1] |
|||
|---|---|---|---|---|---|---|---|---|---|---|---|
| Benchmark | [-] | 2.71 | |||||||||
| CLM50 | [-] | 2.76 | 0.0626 | 1.86 | 0.926 | 0.357 | 0.152 | 0.894 | 0.389 | ||
| CTSM51 | [-] | 2.76 | 0.0602 | 1.84 | 0.882 | 0.340 | 0.156 | 0.896 | 0.387 | ||
| DeadVeg | [-] | 2.92 | 0.217 | 1.94 | 0.912 | 0.345 | 0.151 | 0.894 | 0.385 |
Download Data |
Period Mean (original grids) [g m-2 d-1] |
Bias [g m-2 d-1] |
RMSE [g m-2 d-1] |
Phase Shift [months] |
Bias Score [1] |
RMSE Score [1] |
Seasonal Cycle Score [1] |
Overall Score [1] |
|||
|---|---|---|---|---|---|---|---|---|---|---|---|
| Benchmark | [-] | 0.724 | |||||||||
| CLM50 | [-] | 1.88 | 1.16 | 2.24 | 0.339 | 0.0867 | 0.00 | 0.980 | 0.267 | ||
| CTSM51 | [-] | 1.74 | 1.01 | 2.04 | 0.339 | 0.197 | 0.00 | 0.980 | 0.294 | ||
| DeadVeg | [-] | 2.00 | 1.27 | 2.56 | 0.678 | 0.00 | 0.00 | 0.924 | 0.231 |
Download Data |
Period Mean (original grids) [g m-2 d-1] |
Bias [g m-2 d-1] |
RMSE [g m-2 d-1] |
Phase Shift [months] |
Bias Score [1] |
RMSE Score [1] |
Seasonal Cycle Score [1] |
Overall Score [1] |
|||
|---|---|---|---|---|---|---|---|---|---|---|---|
| Benchmark | [-] | 6.56 | |||||||||
| CLM50 | [-] | 8.23 | 1.66 | 3.20 | 3.57 | 0.630 | 0.477 | 0.303 | 0.472 | ||
| CTSM51 | [-] | 8.37 | 1.81 | 3.21 | 2.55 | 0.640 | 0.495 | 0.485 | 0.529 | ||
| DeadVeg | [-] | 9.18 | 2.62 | 3.45 | 1.53 | 0.543 | 0.598 | 0.671 | 0.602 |
Download Data |
Period Mean (original grids) [g m-2 d-1] |
Bias [g m-2 d-1] |
RMSE [g m-2 d-1] |
Phase Shift [months] |
Bias Score [1] |
RMSE Score [1] |
Seasonal Cycle Score [1] |
Overall Score [1] |
|||
|---|---|---|---|---|---|---|---|---|---|---|---|
| Benchmark | [-] | 2.55 | |||||||||
| CLM50 | [-] | 2.66 | 0.104 | 1.63 | 0.582 | 0.450 | 0.192 | 0.948 | 0.446 | ||
| CTSM51 | [-] | 2.65 | 0.0961 | 1.61 | 0.582 | 0.443 | 0.203 | 0.948 | 0.449 | ||
| DeadVeg | [-] | 2.51 | -0.0387 | 1.62 | 0.829 | 0.447 | 0.192 | 0.916 | 0.437 |
Download Data |
Period Mean (original grids) [g m-2 d-1] |
Bias [g m-2 d-1] |
RMSE [g m-2 d-1] |
Phase Shift [months] |
Bias Score [1] |
RMSE Score [1] |
Seasonal Cycle Score [1] |
Overall Score [1] |
|||
|---|---|---|---|---|---|---|---|---|---|---|---|
| Benchmark | [-] | 1.98 | |||||||||
| CLM50 | [-] | 2.93 | 0.947 | 1.84 | 0.276 | 0.281 | 0.0475 | 0.986 | 0.340 | ||
| CTSM51 | [-] | 3.03 | 1.05 | 1.89 | 0.343 | 0.271 | 0.0406 | 0.980 | 0.333 | ||
| DeadVeg | [-] | 3.30 | 1.32 | 2.10 | 0.343 | 0.243 | 0.0331 | 0.978 | 0.322 |
Download Data |
Period Mean (original grids) [g m-2 d-1] |
Bias [g m-2 d-1] |
RMSE [g m-2 d-1] |
Phase Shift [months] |
Bias Score [1] |
RMSE Score [1] |
Seasonal Cycle Score [1] |
Overall Score [1] |
|||
|---|---|---|---|---|---|---|---|---|---|---|---|
| Benchmark | [-] | 1.97 | |||||||||
| CLM50 | [-] | 1.57 | -0.406 | 1.72 | 1.24 | 0.249 | 0.121 | 0.853 | 0.336 | ||
| CTSM51 | [-] | 1.84 | -0.128 | 1.61 | 1.46 | 0.306 | 0.129 | 0.770 | 0.334 | ||
| DeadVeg | [-] | 2.17 | 0.201 | 1.68 | 1.20 | 0.239 | 0.135 | 0.779 | 0.322 |
Download Data |
Period Mean (original grids) [g m-2 d-1] |
Bias [g m-2 d-1] |
RMSE [g m-2 d-1] |
Phase Shift [months] |
Bias Score [1] |
RMSE Score [1] |
Seasonal Cycle Score [1] |
Overall Score [1] |
|||
|---|---|---|---|---|---|---|---|---|---|---|---|
| Benchmark | [-] | 9.78 | |||||||||
| CLM50 | [-] | 6.83 | -2.95 | 3.84 | 2.02 | 0.277 | 0.137 | 0.739 | 0.322 | ||
| CTSM51 | [-] | 6.84 | -2.94 | 3.96 | 2.02 | 0.318 | 0.115 | 0.739 | 0.322 | ||
| DeadVeg | [-] | 9.87 | 0.0928 | 2.25 | 1.68 | 0.716 | 0.172 | 0.819 | 0.469 |
Download Data |
Period Mean (original grids) [g m-2 d-1] |
Bias [g m-2 d-1] |
RMSE [g m-2 d-1] |
Phase Shift [months] |
Bias Score [1] |
RMSE Score [1] |
Seasonal Cycle Score [1] |
Overall Score [1] |
|||
|---|---|---|---|---|---|---|---|---|---|---|---|
| Benchmark | [-] | 5.79 | |||||||||
| CLM50 | [-] | 6.23 | 0.447 | 3.30 | 2.02 | 0.812 | 0.00 | 0.752 | 0.391 | ||
| CTSM51 | [-] | 6.07 | 0.289 | 3.30 | 2.02 | 0.879 | 0.00 | 0.752 | 0.408 | ||
| DeadVeg | [-] | 5.79 | 0.00947 | 3.27 | 2.02 | 0.996 | 0.00 | 0.752 | 0.437 |
Download Data |
Period Mean (original grids) [g m-2 d-1] |
Bias [g m-2 d-1] |
RMSE [g m-2 d-1] |
Phase Shift [months] |
Bias Score [1] |
RMSE Score [1] |
Seasonal Cycle Score [1] |
Overall Score [1] |
|||
|---|---|---|---|---|---|---|---|---|---|---|---|
| Benchmark | [-] | 6.23 | |||||||||
| CLM50 | [-] | 2.31 | -3.92 | 5.30 | 0.983 | 0.00 | 0.00 | 0.937 | 0.234 | ||
| CTSM51 | [-] | 2.61 | -3.62 | 5.00 | 0.983 | 0.00 | 0.00 | 0.937 | 0.234 | ||
| DeadVeg | [-] | 2.87 | -3.36 | 5.23 | 0.00 | 0.00 | 0.00 | 1.00 | 0.250 |
Temporally integrated period mean