Mean State
Download Data |
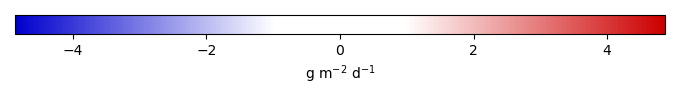
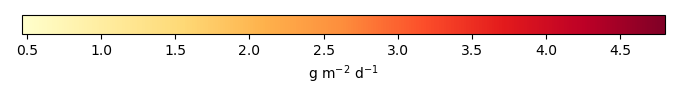
Period Mean (original grids) [g m-2 d-1] |
Bias [g m-2 d-1] |
RMSE [g m-2 d-1] |
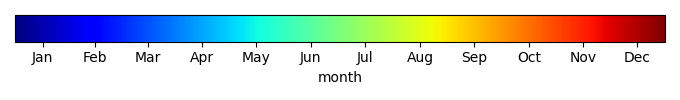
Phase Shift [months] |
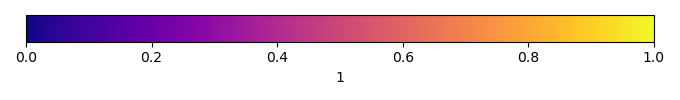
Bias Score [1] |
RMSE Score [1] |
Seasonal Cycle Score [1] |
Overall Score [1] |
|||
|---|---|---|---|---|---|---|---|---|---|---|---|
| Benchmark | [-] | 4.37 | |||||||||
| CLM50 | [-] | 8.31 | 3.94 | 5.40 | 1.01 | 0.438 | 0.383 | 0.935 | 0.535 | ||
| CTSM51 | [-] | 7.85 | 3.48 | 5.11 | 1.52 | 0.459 | 0.378 | 0.817 | 0.508 | ||
| DeadVeg | [-] | 7.48 | 3.11 | 4.70 | 3.01 | 0.475 | 0.380 | 0.584 | 0.455 |
Download Data |
Period Mean (original grids) [g m-2 d-1] |
Bias [g m-2 d-1] |
RMSE [g m-2 d-1] |
Phase Shift [months] |
Bias Score [1] |
RMSE Score [1] |
Seasonal Cycle Score [1] |
Overall Score [1] |
|||
|---|---|---|---|---|---|---|---|---|---|---|---|
| Benchmark | [-] | 3.11 | |||||||||
| CLM50 | [-] | 1.28 | -1.83 | 3.34 | 0.508 | 0.551 | 0.397 | 0.964 | 0.577 | ||
| CTSM51 | [-] | 1.30 | -1.81 | 3.44 | 0.508 | 0.555 | 0.382 | 0.964 | 0.571 | ||
| DeadVeg | [-] | 1.47 | -1.64 | 3.18 | 1.02 | 0.587 | 0.417 | 0.933 | 0.588 |
Download Data |
Period Mean (original grids) [g m-2 d-1] |
Bias [g m-2 d-1] |
RMSE [g m-2 d-1] |
Phase Shift [months] |
Bias Score [1] |
RMSE Score [1] |
Seasonal Cycle Score [1] |
Overall Score [1] |
|||
|---|---|---|---|---|---|---|---|---|---|---|---|
| Benchmark | [-] | 3.77 | |||||||||
| CLM50 | [-] | 0.970 | -2.80 | 3.94 | 1.03 | 0.378 | 0.381 | 0.930 | 0.518 | ||
| CTSM51 | [-] | 0.765 | -3.00 | 4.09 | 1.03 | 0.352 | 0.379 | 0.930 | 0.510 | ||
| DeadVeg | [-] | 0.962 | -2.80 | 3.93 | 1.03 | 0.377 | 0.383 | 0.930 | 0.518 |
Download Data |
Period Mean (original grids) [g m-2 d-1] |
Bias [g m-2 d-1] |
RMSE [g m-2 d-1] |
Phase Shift [months] |
Bias Score [1] |
RMSE Score [1] |
Seasonal Cycle Score [1] |
Overall Score [1] |
|||
|---|---|---|---|---|---|---|---|---|---|---|---|
| Benchmark | [-] | 1.41 | |||||||||
| CLM50 | [-] | 1.33 | -0.0786 | 2.21 | 0.508 | 0.753 | 0.298 | 0.976 | 0.582 | ||
| CTSM51 | [-] | 1.19 | -0.221 | 2.51 | 0.508 | 0.585 | 0.313 | 0.976 | 0.547 | ||
| DeadVeg | [-] | 2.36 | 0.953 | 3.75 | 0.508 | 0.713 | 0.163 | 0.976 | 0.504 |
Download Data |
Period Mean (original grids) [g m-2 d-1] |
Bias [g m-2 d-1] |
RMSE [g m-2 d-1] |
Phase Shift [months] |
Bias Score [1] |
RMSE Score [1] |
Seasonal Cycle Score [1] |
Overall Score [1] |
|||
|---|---|---|---|---|---|---|---|---|---|---|---|
| Benchmark | [-] | 7.09 | |||||||||
| CLM50 | [-] | 6.55 | -0.540 | 1.57 | 1.02 | 0.459 | 0.116 | 0.933 | 0.406 | ||
| CTSM51 | [-] | 6.78 | -0.315 | 1.53 | 1.02 | 0.635 | 0.113 | 0.933 | 0.448 | ||
| DeadVeg | [-] | 7.85 | 0.759 | 2.05 | 1.02 | 0.335 | 0.0677 | 0.933 | 0.351 |
Download Data |
Period Mean (original grids) [g m-2 d-1] |
Bias [g m-2 d-1] |
RMSE [g m-2 d-1] |
Phase Shift [months] |
Bias Score [1] |
RMSE Score [1] |
Seasonal Cycle Score [1] |
Overall Score [1] |
|||
|---|---|---|---|---|---|---|---|---|---|---|---|
| Benchmark | [-] | 2.94 | |||||||||
| CLM50 | [-] | 2.48 | -0.455 | 1.45 | 0.00 | 0.853 | 0.630 | 1.00 | 0.778 | ||
| CTSM51 | [-] | 2.46 | -0.473 | 1.61 | 0.00 | 0.848 | 0.603 | 1.00 | 0.764 | ||
| DeadVeg | [-] | 3.49 | 0.555 | 2.48 | 0.508 | 0.840 | 0.532 | 0.978 | 0.720 |
Download Data |
Period Mean (original grids) [g m-2 d-1] |
Bias [g m-2 d-1] |
RMSE [g m-2 d-1] |
Phase Shift [months] |
Bias Score [1] |
RMSE Score [1] |
Seasonal Cycle Score [1] |
Overall Score [1] |
|||
|---|---|---|---|---|---|---|---|---|---|---|---|
| Benchmark | [-] | 2.37 | |||||||||
| CLM50 | [-] | 2.99 | 0.615 | 1.66 | 1.02 | 0.730 | 0.505 | 0.851 | 0.648 | ||
| CTSM51 | [-] | 3.18 | 0.806 | 1.81 | 1.19 | 0.700 | 0.492 | 0.823 | 0.627 | ||
| DeadVeg | [-] | 3.40 | 1.03 | 2.10 | 1.10 | 0.630 | 0.447 | 0.813 | 0.584 |
Download Data |
Period Mean (original grids) [g m-2 d-1] |
Bias [g m-2 d-1] |
RMSE [g m-2 d-1] |
Phase Shift [months] |
Bias Score [1] |
RMSE Score [1] |
Seasonal Cycle Score [1] |
Overall Score [1] |
|||
|---|---|---|---|---|---|---|---|---|---|---|---|
| Benchmark | [-] | 3.19 | |||||||||
| CLM50 | [-] | 2.87 | -0.200 | 2.96 | 1.70 | 0.323 | 0.302 | 0.815 | 0.436 | ||
| CTSM51 | [-] | 2.42 | -0.641 | 2.82 | 1.75 | 0.347 | 0.313 | 0.803 | 0.444 | ||
| DeadVeg | [-] | 2.88 | -0.190 | 3.06 | 1.74 | 0.361 | 0.272 | 0.803 | 0.427 |
Download Data |
Period Mean (original grids) [g m-2 d-1] |
Bias [g m-2 d-1] |
RMSE [g m-2 d-1] |
Phase Shift [months] |
Bias Score [1] |
RMSE Score [1] |
Seasonal Cycle Score [1] |
Overall Score [1] |
|||
|---|---|---|---|---|---|---|---|---|---|---|---|
| Benchmark | [-] | 3.92 | |||||||||
| CLM50 | [-] | 3.26 | -0.658 | 2.70 | 0.708 | 0.673 | 0.514 | 0.956 | 0.664 | ||
| CTSM51 | [-] | 3.24 | -0.677 | 2.67 | 0.692 | 0.673 | 0.520 | 0.957 | 0.667 | ||
| DeadVeg | [-] | 3.43 | -0.485 | 2.88 | 0.616 | 0.672 | 0.500 | 0.960 | 0.658 |
Download Data |
Period Mean (original grids) [g m-2 d-1] |
Bias [g m-2 d-1] |
RMSE [g m-2 d-1] |
Phase Shift [months] |
Bias Score [1] |
RMSE Score [1] |
Seasonal Cycle Score [1] |
Overall Score [1] |
|||
|---|---|---|---|---|---|---|---|---|---|---|---|
| Benchmark | [-] | 3.35 | |||||||||
| CLM50 | [-] | 2.96 | -0.378 | 2.61 | 1.04 | 0.598 | 0.456 | 0.874 | 0.596 | ||
| CTSM51 | [-] | 2.96 | -0.376 | 2.56 | 1.03 | 0.612 | 0.461 | 0.875 | 0.603 | ||
| DeadVeg | [-] | 3.27 | -0.0735 | 2.72 | 1.03 | 0.625 | 0.444 | 0.882 | 0.599 |
Download Data |
Period Mean (original grids) [g m-2 d-1] |
Bias [g m-2 d-1] |
RMSE [g m-2 d-1] |
Phase Shift [months] |
Bias Score [1] |
RMSE Score [1] |
Seasonal Cycle Score [1] |
Overall Score [1] |
|||
|---|---|---|---|---|---|---|---|---|---|---|---|
| Benchmark | [-] | 0.829 | |||||||||
| CLM50 | [-] | 1.92 | 1.09 | 2.25 | 0.339 | 0.474 | 0.245 | 0.974 | 0.484 | ||
| CTSM51 | [-] | 1.75 | 0.921 | 2.04 | 0.339 | 0.557 | 0.285 | 0.974 | 0.525 | ||
| DeadVeg | [-] | 2.04 | 1.22 | 2.71 | 0.339 | 0.413 | 0.180 | 0.974 | 0.437 |
Download Data |
Period Mean (original grids) [g m-2 d-1] |
Bias [g m-2 d-1] |
RMSE [g m-2 d-1] |
Phase Shift [months] |
Bias Score [1] |
RMSE Score [1] |
Seasonal Cycle Score [1] |
Overall Score [1] |
|||
|---|---|---|---|---|---|---|---|---|---|---|---|
| Benchmark | [-] | 6.58 | |||||||||
| CLM50 | [-] | 8.37 | 1.79 | 3.37 | 3.57 | 0.455 | 0.287 | 0.369 | 0.350 | ||
| CTSM51 | [-] | 8.53 | 1.94 | 3.47 | 3.57 | 0.426 | 0.286 | 0.369 | 0.342 | ||
| DeadVeg | [-] | 9.42 | 2.84 | 3.90 | 1.53 | 0.294 | 0.365 | 0.720 | 0.436 |
Download Data |
Period Mean (original grids) [g m-2 d-1] |
Bias [g m-2 d-1] |
RMSE [g m-2 d-1] |
Phase Shift [months] |
Bias Score [1] |
RMSE Score [1] |
Seasonal Cycle Score [1] |
Overall Score [1] |
|||
|---|---|---|---|---|---|---|---|---|---|---|---|
| Benchmark | [-] | 3.42 | |||||||||
| CLM50 | [-] | 2.87 | -0.556 | 2.64 | 0.963 | 0.709 | 0.529 | 0.914 | 0.670 | ||
| CTSM51 | [-] | 2.85 | -0.570 | 2.60 | 0.826 | 0.709 | 0.536 | 0.935 | 0.679 | ||
| DeadVeg | [-] | 2.92 | -0.501 | 2.60 | 0.963 | 0.724 | 0.526 | 0.910 | 0.671 |
Download Data |
Period Mean (original grids) [g m-2 d-1] |
Bias [g m-2 d-1] |
RMSE [g m-2 d-1] |
Phase Shift [months] |
Bias Score [1] |
RMSE Score [1] |
Seasonal Cycle Score [1] |
Overall Score [1] |
|||
|---|---|---|---|---|---|---|---|---|---|---|---|
| Benchmark | [-] | 2.29 | |||||||||
| CLM50 | [-] | 3.11 | 0.826 | 2.02 | 0.407 | 0.697 | 0.511 | 0.967 | 0.671 | ||
| CTSM51 | [-] | 3.19 | 0.901 | 2.10 | 0.474 | 0.697 | 0.495 | 0.964 | 0.663 | ||
| DeadVeg | [-] | 3.45 | 1.16 | 2.45 | 0.949 | 0.662 | 0.443 | 0.939 | 0.622 |
Download Data |
Period Mean (original grids) [g m-2 d-1] |
Bias [g m-2 d-1] |
RMSE [g m-2 d-1] |
Phase Shift [months] |
Bias Score [1] |
RMSE Score [1] |
Seasonal Cycle Score [1] |
Overall Score [1] |
|||
|---|---|---|---|---|---|---|---|---|---|---|---|
| Benchmark | [-] | 2.33 | |||||||||
| CLM50 | [-] | 1.70 | -0.632 | 2.56 | 1.09 | 0.511 | 0.371 | 0.873 | 0.531 | ||
| CTSM51 | [-] | 2.03 | -0.301 | 2.32 | 1.09 | 0.614 | 0.397 | 0.874 | 0.570 | ||
| DeadVeg | [-] | 2.46 | 0.127 | 2.40 | 0.946 | 0.638 | 0.385 | 0.877 | 0.571 |
Download Data |
Period Mean (original grids) [g m-2 d-1] |
Bias [g m-2 d-1] |
RMSE [g m-2 d-1] |
Phase Shift [months] |
Bias Score [1] |
RMSE Score [1] |
Seasonal Cycle Score [1] |
Overall Score [1] |
|||
|---|---|---|---|---|---|---|---|---|---|---|---|
| Benchmark | [-] | 9.65 | |||||||||
| CLM50 | [-] | 7.04 | -2.61 | 3.21 | 4.03 | 0.283 | 0.311 | 0.342 | 0.312 | ||
| CTSM51 | [-] | 7.19 | -2.46 | 3.22 | 3.69 | 0.359 | 0.292 | 0.365 | 0.327 | ||
| DeadVeg | [-] | 10.2 | 0.552 | 1.86 | 4.03 | 0.737 | 0.346 | 0.342 | 0.443 |
Download Data |
Period Mean (original grids) [g m-2 d-1] |
Bias [g m-2 d-1] |
RMSE [g m-2 d-1] |
Phase Shift [months] |
Bias Score [1] |
RMSE Score [1] |
Seasonal Cycle Score [1] |
Overall Score [1] |
|||
|---|---|---|---|---|---|---|---|---|---|---|---|
| Benchmark | [-] | 6.98 | |||||||||
| CLM50 | [-] | 6.39 | -0.591 | 1.58 | 0.00 | 0.730 | 0.450 | 1.00 | 0.658 | ||
| CTSM51 | [-] | 6.24 | -0.739 | 1.63 | 0.00 | 0.675 | 0.455 | 1.00 | 0.647 | ||
| DeadVeg | [-] | 6.03 | -0.949 | 1.82 | 0.00 | 0.604 | 0.438 | 1.00 | 0.620 |
Download Data |
Period Mean (original grids) [g m-2 d-1] |
Bias [g m-2 d-1] |
RMSE [g m-2 d-1] |
Phase Shift [months] |
Bias Score [1] |
RMSE Score [1] |
Seasonal Cycle Score [1] |
Overall Score [1] |
|||
|---|---|---|---|---|---|---|---|---|---|---|---|
| Benchmark | [-] | 8.99 | |||||||||
| CLM50 | [-] | 2.55 | -6.43 | 7.30 | 4.02 | 0.0996 | 0.339 | 0.259 | 0.259 | ||
| CTSM51 | [-] | 2.88 | -6.10 | 6.92 | 4.02 | 0.112 | 0.365 | 0.259 | 0.275 | ||
| DeadVeg | [-] | 3.24 | -5.75 | 7.13 | 1.02 | 0.128 | 0.365 | 0.933 | 0.447 |
Temporally integrated period mean