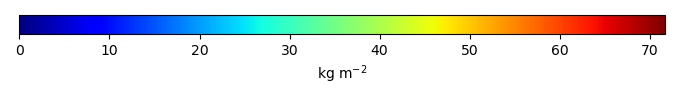
Mean State
Download Data |
Period Mean (original grids) [Pg] |
Model Period Mean (intersection) [Pg] |
Benchmark Period Mean (intersection) [Pg] |
Model Period Mean (complement) [Pg] |
Benchmark Period Mean (complement) [Pg] |
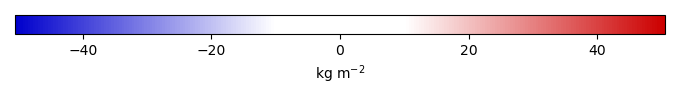
Bias [kg m-2] |
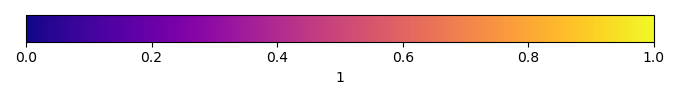
Bias Score [1] |
Spatial Distribution Score [1] |
Overall Score [1] |
|||
|---|---|---|---|---|---|---|---|---|---|---|---|---|
| Benchmark | [-] | 76.5 | ||||||||||
| CLM50 | [-] | 69.5 | 61.3 | 76.1 | 8.09 | 0.362 | -4.25 | 0.527 | 0.507 | 0.517 | ||
| CTSM51 | [-] | 89.7 | 83.5 | 76.1 | 6.79 | 0.362 | 3.50 | 0.491 | 0.440 | 0.465 | ||
| DeadVeg | [-] | 149. | 140. | 76.1 | 8.81 | 0.362 | 24.1 | 0.419 | 0.243 | 0.331 |
Download Data |
Period Mean (original grids) [Pg] |
Model Period Mean (intersection) [Pg] |
Benchmark Period Mean (intersection) [Pg] |
Model Period Mean (complement) [Pg] |
Benchmark Period Mean (complement) [Pg] |
Bias [kg m-2] |
Bias Score [1] |
Spatial Distribution Score [1] |
Overall Score [1] |
|||
|---|---|---|---|---|---|---|---|---|---|---|---|---|
| Benchmark | [-] | 113. | ||||||||||
| CLM50 | [-] | 139. | 76.1 | 113. | 59.9 | 0.00185 | -7.87 | 0.530 | 0.832 | 0.681 | ||
| CTSM51 | [-] | 194. | 122. | 113. | 68.5 | 0.00185 | 1.56 | 0.498 | 0.723 | 0.610 | ||
| DeadVeg | [-] | 192. | 133. | 113. | 55.0 | 0.00185 | 4.21 | 0.598 | 0.716 | 0.657 |
Download Data |
Period Mean (original grids) [Pg] |
Model Period Mean (intersection) [Pg] |
Benchmark Period Mean (intersection) [Pg] |
Model Period Mean (complement) [Pg] |
Benchmark Period Mean (complement) [Pg] |
Bias [kg m-2] |
Bias Score [1] |
Spatial Distribution Score [1] |
Overall Score [1] |
|||
|---|---|---|---|---|---|---|---|---|---|---|---|---|
| Benchmark | [-] | 12.2 | ||||||||||
| CLM50 | [-] | 119. | 6.40 | 12.2 | 116. | -5.84 | 0.567 | 0.863 | 0.715 | |||
| CTSM51 | [-] | 119. | 9.08 | 12.2 | 112. | -2.76 | 0.563 | 0.444 | 0.504 | |||
| DeadVeg | [-] | 169. | 41.9 | 12.2 | 131. | 28.3 | 0.435 | 0.0408 | 0.238 |
Download Data |
Period Mean (original grids) [Pg] |
Model Period Mean (intersection) [Pg] |
Benchmark Period Mean (intersection) [Pg] |
Model Period Mean (complement) [Pg] |
Benchmark Period Mean (complement) [Pg] |
Bias [kg m-2] |
Bias Score [1] |
Spatial Distribution Score [1] |
Overall Score [1] |
|||
|---|---|---|---|---|---|---|---|---|---|---|---|---|
| Benchmark | [-] | 97.3 | ||||||||||
| CLM50 | [-] | 92.1 | 85.0 | 97.2 | 8.38 | 0.0996 | -3.55 | 0.558 | 0.593 | 0.576 | ||
| CTSM51 | [-] | 113. | 105. | 97.2 | 8.87 | 0.0996 | 2.69 | 0.605 | 0.656 | 0.630 | ||
| DeadVeg | [-] | 171. | 160. | 97.2 | 12.1 | 0.0996 | 20.2 | 0.503 | 0.294 | 0.399 |
Download Data |
Period Mean (original grids) [Pg] |
Model Period Mean (intersection) [Pg] |
Benchmark Period Mean (intersection) [Pg] |
Model Period Mean (complement) [Pg] |
Benchmark Period Mean (complement) [Pg] |
Bias [kg m-2] |
Bias Score [1] |
Spatial Distribution Score [1] |
Overall Score [1] |
|||
|---|---|---|---|---|---|---|---|---|---|---|---|---|
| Benchmark | [-] | 5.12 | ||||||||||
| CLM50 | [-] | 45.9 | 2.88 | 5.12 | 42.4 | -8.41 | 0.535 | 0.585 | 0.560 | |||
| CTSM51 | [-] | 49.9 | 3.10 | 5.12 | 46.1 | -7.64 | 0.565 | 0.782 | 0.673 | |||
| DeadVeg | [-] | 44.1 | 3.96 | 5.12 | 39.6 | -4.40 | 0.584 | 0.557 | 0.570 |
Download Data |
Period Mean (original grids) [Pg] |
Model Period Mean (intersection) [Pg] |
Benchmark Period Mean (intersection) [Pg] |
Model Period Mean (complement) [Pg] |
Benchmark Period Mean (complement) [Pg] |
Bias [kg m-2] |
Bias Score [1] |
Spatial Distribution Score [1] |
Overall Score [1] |
|||
|---|---|---|---|---|---|---|---|---|---|---|---|---|
| Benchmark | [-] | 473. | ||||||||||
| CLM50 | [-] | 1.07e+03 | 355. | 472. | 714. | 0.940 | -4.96 | 0.532 | 0.788 | 0.660 | ||
| CTSM51 | [-] | 1.19e+03 | 446. | 472. | 739. | 0.940 | -0.877 | 0.534 | 0.762 | 0.648 | ||
| DeadVeg | [-] | 1.45e+03 | 702. | 472. | 743. | 0.940 | 10.9 | 0.514 | 0.409 | 0.462 |
Download Data |
Period Mean (original grids) [Pg] |
Model Period Mean (intersection) [Pg] |
Benchmark Period Mean (intersection) [Pg] |
Model Period Mean (complement) [Pg] |
Benchmark Period Mean (complement) [Pg] |
Bias [kg m-2] |
Bias Score [1] |
Spatial Distribution Score [1] |
Overall Score [1] |
|||
|---|---|---|---|---|---|---|---|---|---|---|---|---|
| Benchmark | [-] | 116. | ||||||||||
| CLM50 | [-] | 89.4 | 83.9 | 116. | 5.06 | 0.373 | -4.73 | 0.424 | 0.741 | 0.583 | ||
| CTSM51 | [-] | 87.2 | 81.8 | 116. | 4.52 | 0.373 | -4.95 | 0.443 | 0.744 | 0.594 | ||
| DeadVeg | [-] | 194. | 184. | 116. | 9.97 | 0.373 | 12.8 | 0.391 | 0.309 | 0.350 |
Download Data |
Period Mean (original grids) [Pg] |
Model Period Mean (intersection) [Pg] |
Benchmark Period Mean (intersection) [Pg] |
Model Period Mean (complement) [Pg] |
Benchmark Period Mean (complement) [Pg] |
Bias [kg m-2] |
Bias Score [1] |
Spatial Distribution Score [1] |
Overall Score [1] |
|||
|---|---|---|---|---|---|---|---|---|---|---|---|---|
| Benchmark | [-] | 0.0131 | ||||||||||
| CLM50 | [-] | 38.6 | 0.0226 | 0.0131 | 37.9 | 4.34 | 0.480 | 2.68e-23 | 0.240 | |||
| CTSM51 | [-] | 37.3 | 0.0205 | 0.0131 | 36.6 | 3.39 | 0.563 | 2.99e-22 | 0.282 | |||
| DeadVeg | [-] | 28.7 | 0.0145 | 0.0131 | 28.0 | 0.592 | 0.906 | 4.61e-23 | 0.453 |
Download Data |
Period Mean (original grids) [Pg] |
Model Period Mean (intersection) [Pg] |
Benchmark Period Mean (intersection) [Pg] |
Model Period Mean (complement) [Pg] |
Benchmark Period Mean (complement) [Pg] |
Bias [kg m-2] |
Bias Score [1] |
Spatial Distribution Score [1] |
Overall Score [1] |
|||
|---|---|---|---|---|---|---|---|---|---|---|---|---|
| Benchmark | [-] | 46.1 | ||||||||||
| CLM50 | [-] | 82.6 | 38.3 | 46.1 | 44.8 | 0.00725 | -3.81 | 0.501 | 0.568 | 0.534 | ||
| CTSM51 | [-] | 92.1 | 40.8 | 46.1 | 52.2 | 0.00725 | -2.57 | 0.518 | 0.692 | 0.605 | ||
| DeadVeg | [-] | 76.4 | 38.9 | 46.1 | 37.6 | 0.00725 | -3.68 | 0.536 | 0.770 | 0.653 |
Download Data |
Period Mean (original grids) [Pg] |
Model Period Mean (intersection) [Pg] |
Benchmark Period Mean (intersection) [Pg] |
Model Period Mean (complement) [Pg] |
Benchmark Period Mean (complement) [Pg] |
Bias [kg m-2] |
Bias Score [1] |
Spatial Distribution Score [1] |
Overall Score [1] |
|||
|---|---|---|---|---|---|---|---|---|---|---|---|---|
| Benchmark | [-] | 0.232 | ||||||||||
| CLM50 | [-] | 14.2 | 0.336 | 0.232 | 14.6 | 0.994 | 0.480 | 0.833 | 0.657 | |||
| CTSM51 | [-] | 18.8 | 0.759 | 0.232 | 18.8 | 8.20 | 0.332 | 0.311 | 0.321 | |||
| DeadVeg | [-] | 18.7 | 0.664 | 0.232 | 18.6 | 6.96 | 0.252 | 0.642 | 0.447 |
Temporally integrated period mean