Mean State
Download Data |
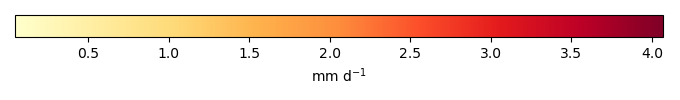
Period Mean (original grids) [mm d-1] |
Model Period Mean (intersection) [mm d-1] |
Benchmark Period Mean (intersection) [mm d-1] |
Model Period Mean (complement) [mm d-1] |
Benchmark Period Mean (complement) [mm d-1] |
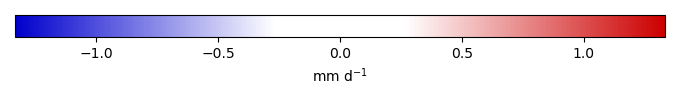
Bias [mm d-1] |
RMSE [mm d-1] |
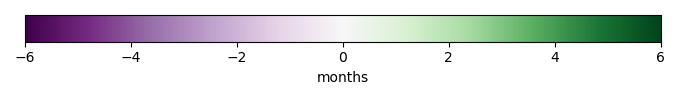
Phase Shift [months] |
Bias Score [1] |
RMSE Score [1] |
Seasonal Cycle Score [1] |
Spatial Distribution Score [1] |
Overall Score [1] |
|||
|---|---|---|---|---|---|---|---|---|---|---|---|---|---|---|---|---|
| Benchmark | [-] | 3.59 | ||||||||||||||
| CLM50 | [-] | 3.56 | 3.58 | 3.60 | 3.60 | -0.0198 | 0.978 | 1.16 | 0.615 | 0.639 | 0.822 | 0.989 | 0.741 | |||
| CTSM51 | [-] | 3.56 | 3.58 | 3.60 | 3.60 | -0.0198 | 0.978 | 1.16 | 0.615 | 0.639 | 0.822 | 0.989 | 0.741 | |||
| DeadVeg | [-] | 3.61 | 3.63 | 3.59 | 3.57 | 0.0560 | 0.957 | 1.11 | 0.620 | 0.649 | 0.839 | 0.986 | 0.749 |
Download Data |
Period Mean (original grids) [mm d-1] |
Model Period Mean (intersection) [mm d-1] |
Benchmark Period Mean (intersection) [mm d-1] |
Model Period Mean (complement) [mm d-1] |
Benchmark Period Mean (complement) [mm d-1] |
Bias [mm d-1] |
RMSE [mm d-1] |
Phase Shift [months] |
Bias Score [1] |
RMSE Score [1] |
Seasonal Cycle Score [1] |
Spatial Distribution Score [1] |
Overall Score [1] |
|||
|---|---|---|---|---|---|---|---|---|---|---|---|---|---|---|---|---|
| Benchmark | [-] | 2.26 | ||||||||||||||
| CLM50 | [-] | 2.35 | 2.31 | 2.24 | 3.41 | 0.0834 | 0.689 | 0.241 | 0.584 | 0.651 | 0.975 | 0.981 | 0.768 | |||
| CTSM51 | [-] | 2.35 | 2.31 | 2.24 | 3.41 | 0.0834 | 0.689 | 0.241 | 0.584 | 0.651 | 0.975 | 0.981 | 0.768 | |||
| DeadVeg | [-] | 2.39 | 2.36 | 2.24 | 3.40 | 0.126 | 0.682 | 0.230 | 0.569 | 0.650 | 0.977 | 0.981 | 0.765 |
Download Data |
Period Mean (original grids) [mm d-1] |
Model Period Mean (intersection) [mm d-1] |
Benchmark Period Mean (intersection) [mm d-1] |
Model Period Mean (complement) [mm d-1] |
Benchmark Period Mean (complement) [mm d-1] |
Bias [mm d-1] |
RMSE [mm d-1] |
Phase Shift [months] |
Bias Score [1] |
RMSE Score [1] |
Seasonal Cycle Score [1] |
Spatial Distribution Score [1] |
Overall Score [1] |
|||
|---|---|---|---|---|---|---|---|---|---|---|---|---|---|---|---|---|
| Benchmark | [-] | 2.31 | ||||||||||||||
| CLM50 | [-] | 2.37 | 2.37 | 2.30 | 2.63 | 0.0533 | 0.744 | 0.728 | 0.675 | 0.703 | 0.905 | 0.984 | 0.794 | |||
| CTSM51 | [-] | 2.37 | 2.37 | 2.30 | 2.63 | 0.0533 | 0.744 | 0.728 | 0.675 | 0.703 | 0.905 | 0.984 | 0.794 | |||
| DeadVeg | [-] | 2.35 | 2.34 | 2.30 | 2.62 | 0.0490 | 0.674 | 0.737 | 0.700 | 0.718 | 0.909 | 0.989 | 0.807 |
Download Data |
Period Mean (original grids) [mm d-1] |
Model Period Mean (intersection) [mm d-1] |
Benchmark Period Mean (intersection) [mm d-1] |
Model Period Mean (complement) [mm d-1] |
Benchmark Period Mean (complement) [mm d-1] |
Bias [mm d-1] |
RMSE [mm d-1] |
Phase Shift [months] |
Bias Score [1] |
RMSE Score [1] |
Seasonal Cycle Score [1] |
Spatial Distribution Score [1] |
Overall Score [1] |
|||
|---|---|---|---|---|---|---|---|---|---|---|---|---|---|---|---|---|
| Benchmark | [-] | 0.964 | ||||||||||||||
| CLM50 | [-] | 1.12 | 1.12 | 0.951 | 1.08 | 0.208 | 0.355 | 0.864 | 0.582 | 0.701 | 0.893 | 0.915 | 0.759 | |||
| CTSM51 | [-] | 1.12 | 1.12 | 0.951 | 1.08 | 0.208 | 0.355 | 0.864 | 0.582 | 0.701 | 0.893 | 0.915 | 0.759 | |||
| DeadVeg | [-] | 0.979 | 0.979 | 0.954 | 1.08 | 0.0441 | 0.256 | 0.501 | 0.746 | 0.699 | 0.953 | 0.993 | 0.818 |
Download Data |
Period Mean (original grids) [mm d-1] |
Model Period Mean (intersection) [mm d-1] |
Benchmark Period Mean (intersection) [mm d-1] |
Model Period Mean (complement) [mm d-1] |
Benchmark Period Mean (complement) [mm d-1] |
Bias [mm d-1] |
RMSE [mm d-1] |
Phase Shift [months] |
Bias Score [1] |
RMSE Score [1] |
Seasonal Cycle Score [1] |
Spatial Distribution Score [1] |
Overall Score [1] |
|||
|---|---|---|---|---|---|---|---|---|---|---|---|---|---|---|---|---|
| Benchmark | [-] | 6.90 | ||||||||||||||
| CLM50 | [-] | 8.04 | 8.05 | 6.99 | 6.58 | 0.601 | 2.13 | 1.41 | 0.517 | 0.635 | 0.792 | 0.736 | 0.663 | |||
| CTSM51 | [-] | 8.04 | 8.05 | 6.99 | 6.58 | 0.601 | 2.13 | 1.41 | 0.517 | 0.635 | 0.792 | 0.736 | 0.663 | |||
| DeadVeg | [-] | 7.79 | 7.80 | 6.99 | 6.59 | 0.569 | 1.88 | 1.65 | 0.568 | 0.652 | 0.758 | 0.858 | 0.697 |
Download Data |
Period Mean (original grids) [mm d-1] |
Model Period Mean (intersection) [mm d-1] |
Benchmark Period Mean (intersection) [mm d-1] |
Model Period Mean (complement) [mm d-1] |
Benchmark Period Mean (complement) [mm d-1] |
Bias [mm d-1] |
RMSE [mm d-1] |
Phase Shift [months] |
Bias Score [1] |
RMSE Score [1] |
Seasonal Cycle Score [1] |
Spatial Distribution Score [1] |
Overall Score [1] |
|||
|---|---|---|---|---|---|---|---|---|---|---|---|---|---|---|---|---|
| Benchmark | [-] | 1.37 | ||||||||||||||
| CLM50 | [-] | 1.47 | 1.47 | 1.36 | 1.94 | 0.127 | 0.235 | 0.338 | 0.739 | 0.830 | 0.969 | 0.947 | 0.863 | |||
| CTSM51 | [-] | 1.47 | 1.47 | 1.36 | 1.94 | 0.127 | 0.235 | 0.338 | 0.739 | 0.830 | 0.969 | 0.947 | 0.863 | |||
| DeadVeg | [-] | 1.47 | 1.48 | 1.36 | 1.94 | 0.123 | 0.229 | 0.299 | 0.767 | 0.812 | 0.979 | 0.991 | 0.872 |
Download Data |
Period Mean (original grids) [mm d-1] |
Model Period Mean (intersection) [mm d-1] |
Benchmark Period Mean (intersection) [mm d-1] |
Model Period Mean (complement) [mm d-1] |
Benchmark Period Mean (complement) [mm d-1] |
Bias [mm d-1] |
RMSE [mm d-1] |
Phase Shift [months] |
Bias Score [1] |
RMSE Score [1] |
Seasonal Cycle Score [1] |
Spatial Distribution Score [1] |
Overall Score [1] |
|||
|---|---|---|---|---|---|---|---|---|---|---|---|---|---|---|---|---|
| Benchmark | [-] | 1.57 | ||||||||||||||
| CLM50 | [-] | 1.43 | 1.44 | 1.52 | 3.94 | 0.0355 | 0.459 | 0.798 | 0.672 | 0.737 | 0.881 | 0.975 | 0.800 | |||
| CTSM51 | [-] | 1.43 | 1.44 | 1.52 | 3.94 | 0.0355 | 0.459 | 0.798 | 0.672 | 0.737 | 0.881 | 0.975 | 0.800 | |||
| DeadVeg | [-] | 1.44 | 1.44 | 1.53 | 3.96 | 0.0322 | 0.420 | 0.596 | 0.693 | 0.752 | 0.916 | 0.982 | 0.819 |
Download Data |
Period Mean (original grids) [mm d-1] |
Model Period Mean (intersection) [mm d-1] |
Benchmark Period Mean (intersection) [mm d-1] |
Model Period Mean (complement) [mm d-1] |
Benchmark Period Mean (complement) [mm d-1] |
Bias [mm d-1] |
RMSE [mm d-1] |
Phase Shift [months] |
Bias Score [1] |
RMSE Score [1] |
Seasonal Cycle Score [1] |
Spatial Distribution Score [1] |
Overall Score [1] |
|||
|---|---|---|---|---|---|---|---|---|---|---|---|---|---|---|---|---|
| Benchmark | [-] | 3.60 | ||||||||||||||
| CLM50 | [-] | 3.73 | 3.71 | 3.51 | 4.93 | 0.409 | 1.99 | 0.801 | 0.489 | 0.477 | 0.904 | 0.869 | 0.643 | |||
| CTSM51 | [-] | 3.73 | 3.71 | 3.51 | 4.93 | 0.409 | 1.99 | 0.801 | 0.489 | 0.477 | 0.904 | 0.869 | 0.643 | |||
| DeadVeg | [-] | 3.57 | 3.57 | 3.51 | 4.92 | 0.364 | 1.77 | 0.844 | 0.540 | 0.517 | 0.892 | 0.904 | 0.674 |
Download Data |
Period Mean (original grids) [mm d-1] |
Model Period Mean (intersection) [mm d-1] |
Benchmark Period Mean (intersection) [mm d-1] |
Model Period Mean (complement) [mm d-1] |
Benchmark Period Mean (complement) [mm d-1] |
Bias [mm d-1] |
RMSE [mm d-1] |
Phase Shift [months] |
Bias Score [1] |
RMSE Score [1] |
Seasonal Cycle Score [1] |
Spatial Distribution Score [1] |
Overall Score [1] |
|||
|---|---|---|---|---|---|---|---|---|---|---|---|---|---|---|---|---|
| Benchmark | [-] | 0.979 | ||||||||||||||
| CLM50 | [-] | 1.29 | 1.30 | 0.989 | 0.721 | 0.296 | 0.374 | 1.19 | 0.475 | 0.738 | 0.845 | 0.909 | 0.741 | |||
| CTSM51 | [-] | 1.29 | 1.30 | 0.989 | 0.721 | 0.296 | 0.374 | 1.19 | 0.475 | 0.738 | 0.845 | 0.909 | 0.741 | |||
| DeadVeg | [-] | 1.11 | 1.12 | 0.990 | 0.721 | 0.116 | 0.215 | 0.356 | 0.727 | 0.790 | 0.970 | 0.995 | 0.854 |
Download Data |
Period Mean (original grids) [mm d-1] |
Model Period Mean (intersection) [mm d-1] |
Benchmark Period Mean (intersection) [mm d-1] |
Model Period Mean (complement) [mm d-1] |
Benchmark Period Mean (complement) [mm d-1] |
Bias [mm d-1] |
RMSE [mm d-1] |
Phase Shift [months] |
Bias Score [1] |
RMSE Score [1] |
Seasonal Cycle Score [1] |
Spatial Distribution Score [1] |
Overall Score [1] |
|||
|---|---|---|---|---|---|---|---|---|---|---|---|---|---|---|---|---|
| Benchmark | [-] | 1.61 | ||||||||||||||
| CLM50 | [-] | 1.47 | 1.47 | 1.55 | 2.59 | 0.0710 | 0.480 | 0.711 | 0.674 | 0.742 | 0.904 | 0.916 | 0.796 | |||
| CTSM51 | [-] | 1.47 | 1.47 | 1.55 | 2.59 | 0.0710 | 0.480 | 0.711 | 0.674 | 0.742 | 0.904 | 0.916 | 0.796 | |||
| DeadVeg | [-] | 1.43 | 1.43 | 1.54 | 2.57 | 0.0614 | 0.457 | 0.677 | 0.683 | 0.753 | 0.911 | 0.913 | 0.803 |
Download Data |
Period Mean (original grids) [mm d-1] |
Model Period Mean (intersection) [mm d-1] |
Benchmark Period Mean (intersection) [mm d-1] |
Model Period Mean (complement) [mm d-1] |
Benchmark Period Mean (complement) [mm d-1] |
Bias [mm d-1] |
RMSE [mm d-1] |
Phase Shift [months] |
Bias Score [1] |
RMSE Score [1] |
Seasonal Cycle Score [1] |
Spatial Distribution Score [1] |
Overall Score [1] |
|||
|---|---|---|---|---|---|---|---|---|---|---|---|---|---|---|---|---|
| Benchmark | [-] | 1.95 | ||||||||||||||
| CLM50 | [-] | 2.34 | 2.34 | 1.95 | 2.04 | 0.384 | 0.598 | 1.02 | 0.529 | 0.740 | 0.844 | 0.797 | 0.730 | |||
| CTSM51 | [-] | 2.34 | 2.34 | 1.95 | 2.04 | 0.384 | 0.598 | 1.02 | 0.529 | 0.740 | 0.844 | 0.797 | 0.730 | |||
| DeadVeg | [-] | 2.15 | 2.15 | 1.94 | 2.02 | 0.246 | 0.463 | 0.770 | 0.632 | 0.794 | 0.892 | 0.830 | 0.788 |
Download Data |
Period Mean (original grids) [mm d-1] |
Model Period Mean (intersection) [mm d-1] |
Benchmark Period Mean (intersection) [mm d-1] |
Model Period Mean (complement) [mm d-1] |
Benchmark Period Mean (complement) [mm d-1] |
Bias [mm d-1] |
RMSE [mm d-1] |
Phase Shift [months] |
Bias Score [1] |
RMSE Score [1] |
Seasonal Cycle Score [1] |
Spatial Distribution Score [1] |
Overall Score [1] |
|||
|---|---|---|---|---|---|---|---|---|---|---|---|---|---|---|---|---|
| Benchmark | [-] | 2.05 | ||||||||||||||
| CLM50 | [-] | 2.08 | 2.08 | 1.99 | 1.11 | 3.04 | 0.187 | 0.695 | 1.07 | 0.619 | 0.712 | 0.845 | 0.937 | 0.765 | ||
| CTSM51 | [-] | 2.08 | 2.08 | 1.99 | 1.11 | 3.04 | 0.187 | 0.695 | 1.07 | 0.619 | 0.712 | 0.845 | 0.937 | 0.765 | ||
| DeadVeg | [-] | 2.25 | 2.25 | 2.00 | 1.09 | 3.03 | 0.346 | 0.783 | 0.881 | 0.656 | 0.728 | 0.880 | 0.903 | 0.779 |
Download Data |
Period Mean (original grids) [mm d-1] |
Model Period Mean (intersection) [mm d-1] |
Benchmark Period Mean (intersection) [mm d-1] |
Model Period Mean (complement) [mm d-1] |
Benchmark Period Mean (complement) [mm d-1] |
Bias [mm d-1] |
RMSE [mm d-1] |
Phase Shift [months] |
Bias Score [1] |
RMSE Score [1] |
Seasonal Cycle Score [1] |
Spatial Distribution Score [1] |
Overall Score [1] |
|||
|---|---|---|---|---|---|---|---|---|---|---|---|---|---|---|---|---|
| Benchmark | [-] | 0.386 | ||||||||||||||
| CLM50 | [-] | 0.353 | 0.355 | 0.376 | 0.672 | -0.000274 | 0.238 | 1.22 | 0.753 | 0.803 | 0.815 | 0.934 | 0.822 | |||
| CTSM51 | [-] | 0.353 | 0.355 | 0.376 | 0.672 | -0.000274 | 0.238 | 1.22 | 0.753 | 0.803 | 0.815 | 0.934 | 0.822 | |||
| DeadVeg | [-] | 0.393 | 0.396 | 0.375 | 0.672 | 0.0430 | 0.224 | 1.23 | 0.767 | 0.815 | 0.814 | 0.944 | 0.831 |
Download Data |
Period Mean (original grids) [mm d-1] |
Model Period Mean (intersection) [mm d-1] |
Benchmark Period Mean (intersection) [mm d-1] |
Model Period Mean (complement) [mm d-1] |
Benchmark Period Mean (complement) [mm d-1] |
Bias [mm d-1] |
RMSE [mm d-1] |
Phase Shift [months] |
Bias Score [1] |
RMSE Score [1] |
Seasonal Cycle Score [1] |
Spatial Distribution Score [1] |
Overall Score [1] |
|||
|---|---|---|---|---|---|---|---|---|---|---|---|---|---|---|---|---|
| Benchmark | [-] | 1.04 | ||||||||||||||
| CLM50 | [-] | 1.20 | 1.20 | 1.04 | 0.544 | 1.15 | 0.193 | 0.447 | 0.650 | 0.581 | 0.667 | 0.928 | 0.864 | 0.741 | ||
| CTSM51 | [-] | 1.20 | 1.20 | 1.04 | 0.544 | 1.15 | 0.193 | 0.447 | 0.650 | 0.581 | 0.667 | 0.928 | 0.864 | 0.741 | ||
| DeadVeg | [-] | 1.07 | 1.06 | 1.04 | 0.354 | 1.15 | 0.0294 | 0.336 | 0.549 | 0.694 | 0.693 | 0.945 | 0.971 | 0.799 |
Download Data |
Period Mean (original grids) [mm d-1] |
Model Period Mean (intersection) [mm d-1] |
Benchmark Period Mean (intersection) [mm d-1] |
Model Period Mean (complement) [mm d-1] |
Benchmark Period Mean (complement) [mm d-1] |
Bias [mm d-1] |
RMSE [mm d-1] |
Phase Shift [months] |
Bias Score [1] |
RMSE Score [1] |
Seasonal Cycle Score [1] |
Spatial Distribution Score [1] |
Overall Score [1] |
|||
|---|---|---|---|---|---|---|---|---|---|---|---|---|---|---|---|---|
| Benchmark | [-] | 2.68 | ||||||||||||||
| CLM50 | [-] | 3.02 | 3.04 | 2.58 | 3.29 | 0.701 | 1.33 | 1.09 | 0.488 | 0.591 | 0.841 | 0.859 | 0.674 | |||
| CTSM51 | [-] | 3.02 | 3.04 | 2.58 | 3.29 | 0.701 | 1.33 | 1.09 | 0.488 | 0.591 | 0.841 | 0.859 | 0.674 | |||
| DeadVeg | [-] | 2.93 | 2.94 | 2.56 | 3.26 | 0.623 | 1.27 | 1.04 | 0.502 | 0.600 | 0.846 | 0.890 | 0.688 |
Download Data |
Period Mean (original grids) [mm d-1] |
Model Period Mean (intersection) [mm d-1] |
Benchmark Period Mean (intersection) [mm d-1] |
Model Period Mean (complement) [mm d-1] |
Benchmark Period Mean (complement) [mm d-1] |
Bias [mm d-1] |
RMSE [mm d-1] |
Phase Shift [months] |
Bias Score [1] |
RMSE Score [1] |
Seasonal Cycle Score [1] |
Spatial Distribution Score [1] |
Overall Score [1] |
|||
|---|---|---|---|---|---|---|---|---|---|---|---|---|---|---|---|---|
| Benchmark | [-] | 2.74 | ||||||||||||||
| CLM50 | [-] | 3.05 | 3.07 | 2.71 | 3.28 | 0.399 | 0.518 | 0.995 | 0.499 | 0.811 | 0.859 | 0.987 | 0.793 | |||
| CTSM51 | [-] | 3.05 | 3.07 | 2.71 | 3.28 | 0.399 | 0.518 | 0.995 | 0.499 | 0.811 | 0.859 | 0.987 | 0.793 | |||
| DeadVeg | [-] | 2.92 | 2.94 | 2.71 | 3.27 | 0.279 | 0.419 | 0.986 | 0.633 | 0.825 | 0.856 | 0.989 | 0.825 |
Download Data |
Period Mean (original grids) [mm d-1] |
Model Period Mean (intersection) [mm d-1] |
Benchmark Period Mean (intersection) [mm d-1] |
Model Period Mean (complement) [mm d-1] |
Benchmark Period Mean (complement) [mm d-1] |
Bias [mm d-1] |
RMSE [mm d-1] |
Phase Shift [months] |
Bias Score [1] |
RMSE Score [1] |
Seasonal Cycle Score [1] |
Spatial Distribution Score [1] |
Overall Score [1] |
|||
|---|---|---|---|---|---|---|---|---|---|---|---|---|---|---|---|---|
| Benchmark | [-] | 2.03 | ||||||||||||||
| CLM50 | [-] | 2.15 | 2.16 | 2.00 | 3.28 | 0.304 | 0.603 | 0.850 | 0.597 | 0.720 | 0.884 | 0.855 | 0.755 | |||
| CTSM51 | [-] | 2.15 | 2.16 | 2.00 | 3.28 | 0.304 | 0.603 | 0.850 | 0.597 | 0.720 | 0.884 | 0.855 | 0.755 | |||
| DeadVeg | [-] | 2.12 | 2.12 | 1.98 | 3.24 | 0.277 | 0.567 | 0.764 | 0.619 | 0.733 | 0.899 | 0.901 | 0.777 |
Download Data |
Period Mean (original grids) [mm d-1] |
Model Period Mean (intersection) [mm d-1] |
Benchmark Period Mean (intersection) [mm d-1] |
Model Period Mean (complement) [mm d-1] |
Benchmark Period Mean (complement) [mm d-1] |
Bias [mm d-1] |
RMSE [mm d-1] |
Phase Shift [months] |
Bias Score [1] |
RMSE Score [1] |
Seasonal Cycle Score [1] |
Spatial Distribution Score [1] |
Overall Score [1] |
|||
|---|---|---|---|---|---|---|---|---|---|---|---|---|---|---|---|---|
| Benchmark | [-] | 1.05 | ||||||||||||||
| CLM50 | [-] | 1.28 | 1.29 | 1.04 | 1.98 | 0.290 | 0.505 | 0.949 | 0.559 | 0.724 | 0.857 | 0.747 | 0.722 | |||
| CTSM51 | [-] | 1.28 | 1.29 | 1.04 | 1.98 | 0.290 | 0.505 | 0.949 | 0.559 | 0.724 | 0.857 | 0.747 | 0.722 | |||
| DeadVeg | [-] | 1.26 | 1.27 | 1.04 | 1.98 | 0.278 | 0.473 | 0.797 | 0.578 | 0.734 | 0.886 | 0.781 | 0.743 |
Download Data |
Period Mean (original grids) [mm d-1] |
Model Period Mean (intersection) [mm d-1] |
Benchmark Period Mean (intersection) [mm d-1] |
Model Period Mean (complement) [mm d-1] |
Benchmark Period Mean (complement) [mm d-1] |
Bias [mm d-1] |
RMSE [mm d-1] |
Phase Shift [months] |
Bias Score [1] |
RMSE Score [1] |
Seasonal Cycle Score [1] |
Spatial Distribution Score [1] |
Overall Score [1] |
|||
|---|---|---|---|---|---|---|---|---|---|---|---|---|---|---|---|---|
| Benchmark | [-] | 5.44 | ||||||||||||||
| CLM50 | [-] | 6.13 | 6.13 | 5.50 | 4.10 | 0.679 | 1.51 | 0.750 | 0.601 | 0.692 | 0.916 | 0.904 | 0.761 | |||
| CTSM51 | [-] | 6.13 | 6.13 | 5.50 | 4.10 | 0.679 | 1.51 | 0.750 | 0.601 | 0.692 | 0.916 | 0.904 | 0.761 | |||
| DeadVeg | [-] | 6.13 | 6.13 | 5.47 | 4.07 | 0.686 | 1.44 | 0.732 | 0.591 | 0.699 | 0.915 | 0.963 | 0.773 |
Download Data |
Period Mean (original grids) [mm d-1] |
Model Period Mean (intersection) [mm d-1] |
Benchmark Period Mean (intersection) [mm d-1] |
Model Period Mean (complement) [mm d-1] |
Benchmark Period Mean (complement) [mm d-1] |
Bias [mm d-1] |
RMSE [mm d-1] |
Phase Shift [months] |
Bias Score [1] |
RMSE Score [1] |
Seasonal Cycle Score [1] |
Spatial Distribution Score [1] |
Overall Score [1] |
|||
|---|---|---|---|---|---|---|---|---|---|---|---|---|---|---|---|---|
| Benchmark | [-] | 3.25 | ||||||||||||||
| CLM50 | [-] | 3.35 | 3.34 | 3.27 | 3.03 | 0.0831 | 0.646 | 0.695 | 0.717 | 0.786 | 0.912 | 0.957 | 0.832 | |||
| CTSM51 | [-] | 3.35 | 3.34 | 3.27 | 3.03 | 0.0831 | 0.646 | 0.695 | 0.717 | 0.786 | 0.912 | 0.957 | 0.832 | |||
| DeadVeg | [-] | 3.25 | 3.24 | 3.26 | 3.01 | -0.000337 | 0.656 | 0.743 | 0.701 | 0.789 | 0.911 | 0.935 | 0.825 |
Download Data |
Period Mean (original grids) [mm d-1] |
Model Period Mean (intersection) [mm d-1] |
Benchmark Period Mean (intersection) [mm d-1] |
Model Period Mean (complement) [mm d-1] |
Benchmark Period Mean (complement) [mm d-1] |
Bias [mm d-1] |
RMSE [mm d-1] |
Phase Shift [months] |
Bias Score [1] |
RMSE Score [1] |
Seasonal Cycle Score [1] |
Spatial Distribution Score [1] |
Overall Score [1] |
|||
|---|---|---|---|---|---|---|---|---|---|---|---|---|---|---|---|---|
| Benchmark | [-] | 1.26 | ||||||||||||||
| CLM50 | [-] | 1.55 | 1.56 | 1.27 | 1.16 | 0.357 | 0.918 | 0.947 | 0.409 | 0.591 | 0.872 | 0.548 | 0.602 | |||
| CTSM51 | [-] | 1.55 | 1.56 | 1.27 | 1.16 | 0.357 | 0.918 | 0.947 | 0.409 | 0.591 | 0.872 | 0.548 | 0.602 | |||
| DeadVeg | [-] | 1.43 | 1.44 | 1.27 | 1.15 | 0.299 | 0.983 | 0.907 | 0.372 | 0.566 | 0.888 | 0.529 | 0.584 |
Temporally integrated period mean