Mean State
Download Data |
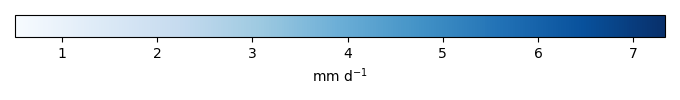
Period Mean (original grids) [mm d-1] |
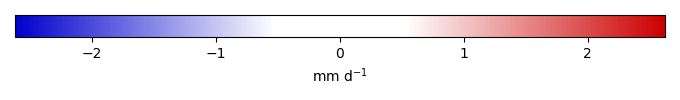
Bias [mm d-1] |
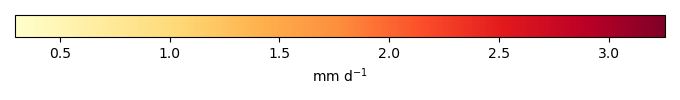
RMSE [mm d-1] |
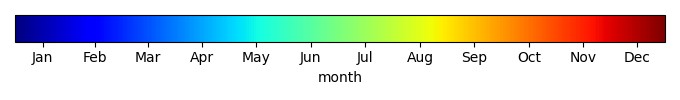
Phase Shift [months] |
Bias Score [1] |
RMSE Score [1] |
Seasonal Cycle Score [1] |
Overall Score [1] |
|||
|---|---|---|---|---|---|---|---|---|---|---|---|
| Benchmark | [-] | 4.82 | |||||||||
| CLM50 | [-] | 4.30 | -0.516 | 2.35 | 0.00 | 0.683 | 0.135 | 1.00 | 0.488 | ||
| CTSM51 | [-] | 4.30 | -0.516 | 2.35 | 0.00 | 0.683 | 0.135 | 1.00 | 0.488 | ||
| DeadVeg | [-] | 4.30 | -0.521 | 2.27 | 0.00 | 0.681 | 0.161 | 1.00 | 0.501 |
Download Data |
Period Mean (original grids) [mm d-1] |
Bias [mm d-1] |
RMSE [mm d-1] |
Phase Shift [months] |
Bias Score [1] |
RMSE Score [1] |
Seasonal Cycle Score [1] |
Overall Score [1] |
|||
|---|---|---|---|---|---|---|---|---|---|---|---|
| Benchmark | [-] | 0.768 | |||||||||
| CLM50 | [-] | 0.947 | 0.179 | 1.12 | 1.02 | 0.606 | 0.00 | 0.932 | 0.385 | ||
| CTSM51 | [-] | 0.947 | 0.179 | 1.12 | 1.02 | 0.606 | 0.00 | 0.932 | 0.385 | ||
| DeadVeg | [-] | 0.946 | 0.177 | 0.844 | 1.02 | 0.612 | 0.141 | 0.932 | 0.457 |
Download Data |
Period Mean (original grids) [mm d-1] |
Bias [mm d-1] |
RMSE [mm d-1] |
Phase Shift [months] |
Bias Score [1] |
RMSE Score [1] |
Seasonal Cycle Score [1] |
Overall Score [1] |
|||
|---|---|---|---|---|---|---|---|---|---|---|---|
| Benchmark | [-] | 1.59 | |||||||||
| CLM50 | [-] | 2.43 | 0.837 | 2.15 | 0.00 | 0.482 | 0.296 | 1.00 | 0.519 | ||
| CTSM51 | [-] | 2.43 | 0.837 | 2.15 | 0.00 | 0.482 | 0.296 | 1.00 | 0.519 | ||
| DeadVeg | [-] | 2.24 | 0.648 | 1.73 | 0.00 | 0.599 | 0.422 | 1.00 | 0.611 |
Download Data |
Period Mean (original grids) [mm d-1] |
Bias [mm d-1] |
RMSE [mm d-1] |
Phase Shift [months] |
Bias Score [1] |
RMSE Score [1] |
Seasonal Cycle Score [1] |
Overall Score [1] |
|||
|---|---|---|---|---|---|---|---|---|---|---|---|
| Benchmark | [-] | 0.431 | |||||||||
| CLM50 | [-] | 0.807 | 0.376 | 0.822 | 2.55 | 0.468 | 0.0381 | 0.572 | 0.279 | ||
| CTSM51 | [-] | 0.807 | 0.376 | 0.822 | 2.55 | 0.468 | 0.0381 | 0.572 | 0.279 | ||
| DeadVeg | [-] | 0.541 | 0.110 | 0.528 | 0.517 | 0.826 | 0.188 | 0.979 | 0.545 |
Download Data |
Period Mean (original grids) [mm d-1] |
Bias [mm d-1] |
RMSE [mm d-1] |
Phase Shift [months] |
Bias Score [1] |
RMSE Score [1] |
Seasonal Cycle Score [1] |
Overall Score [1] |
|||
|---|---|---|---|---|---|---|---|---|---|---|---|
| Benchmark | [-] | 5.11 | |||||||||
| CLM50 | [-] | 6.02 | 0.913 | 3.12 | 1.02 | 0.436 | 0.00 | 0.933 | 0.342 | ||
| CTSM51 | [-] | 6.02 | 0.913 | 3.12 | 1.02 | 0.436 | 0.00 | 0.933 | 0.342 | ||
| DeadVeg | [-] | 5.95 | 0.840 | 2.90 | 1.02 | 0.481 | 0.00 | 0.933 | 0.353 |
Download Data |
Period Mean (original grids) [mm d-1] |
Bias [mm d-1] |
RMSE [mm d-1] |
Phase Shift [months] |
Bias Score [1] |
RMSE Score [1] |
Seasonal Cycle Score [1] |
Overall Score [1] |
|||
|---|---|---|---|---|---|---|---|---|---|---|---|
| Benchmark | [-] | 1.30 | |||||||||
| CLM50 | [-] | 1.68 | 0.380 | 0.914 | 1.02 | 0.407 | 0.246 | 0.933 | 0.458 | ||
| CTSM51 | [-] | 1.68 | 0.380 | 0.914 | 1.02 | 0.407 | 0.246 | 0.933 | 0.458 | ||
| DeadVeg | [-] | 1.73 | 0.426 | 0.903 | 1.02 | 0.399 | 0.290 | 0.933 | 0.478 |
Download Data |
Period Mean (original grids) [mm d-1] |
Bias [mm d-1] |
RMSE [mm d-1] |
Phase Shift [months] |
Bias Score [1] |
RMSE Score [1] |
Seasonal Cycle Score [1] |
Overall Score [1] |
|||
|---|---|---|---|---|---|---|---|---|---|---|---|
| Benchmark | [-] | 1.95 | |||||||||
| CLM50 | [-] | 2.31 | 0.360 | 0.906 | 1.11 | 0.431 | 0.279 | 0.821 | 0.452 | ||
| CTSM51 | [-] | 2.31 | 0.360 | 0.906 | 1.11 | 0.431 | 0.279 | 0.821 | 0.452 | ||
| DeadVeg | [-] | 2.28 | 0.339 | 0.986 | 1.11 | 0.368 | 0.223 | 0.858 | 0.418 |
Download Data |
Period Mean (original grids) [mm d-1] |
Bias [mm d-1] |
RMSE [mm d-1] |
Phase Shift [months] |
Bias Score [1] |
RMSE Score [1] |
Seasonal Cycle Score [1] |
Overall Score [1] |
|||
|---|---|---|---|---|---|---|---|---|---|---|---|
| Benchmark | [-] | 2.65 | |||||||||
| CLM50 | [-] | 2.18 | -0.316 | 1.68 | 1.42 | 0.527 | 0.185 | 0.776 | 0.418 | ||
| CTSM51 | [-] | 2.18 | -0.316 | 1.68 | 1.42 | 0.527 | 0.185 | 0.776 | 0.418 | ||
| DeadVeg | [-] | 2.13 | -0.364 | 1.70 | 1.15 | 0.554 | 0.177 | 0.802 | 0.428 |
Download Data |
Period Mean (original grids) [mm d-1] |
Bias [mm d-1] |
RMSE [mm d-1] |
Phase Shift [months] |
Bias Score [1] |
RMSE Score [1] |
Seasonal Cycle Score [1] |
Overall Score [1] |
|||
|---|---|---|---|---|---|---|---|---|---|---|---|
| Benchmark | [-] | 2.35 | |||||||||
| CLM50 | [-] | 2.39 | 0.0355 | 1.20 | 1.45 | 0.421 | 0.187 | 0.777 | 0.393 | ||
| CTSM51 | [-] | 2.39 | 0.0355 | 1.20 | 1.45 | 0.421 | 0.187 | 0.777 | 0.393 | ||
| DeadVeg | [-] | 2.21 | -0.144 | 1.24 | 1.05 | 0.408 | 0.186 | 0.852 | 0.408 |
Download Data |
Period Mean (original grids) [mm d-1] |
Bias [mm d-1] |
RMSE [mm d-1] |
Phase Shift [months] |
Bias Score [1] |
RMSE Score [1] |
Seasonal Cycle Score [1] |
Overall Score [1] |
|||
|---|---|---|---|---|---|---|---|---|---|---|---|
| Benchmark | [-] | 2.16 | |||||||||
| CLM50 | [-] | 2.26 | 0.114 | 1.24 | 1.30 | 0.451 | 0.191 | 0.806 | 0.410 | ||
| CTSM51 | [-] | 2.26 | 0.114 | 1.24 | 1.30 | 0.451 | 0.191 | 0.806 | 0.410 | ||
| DeadVeg | [-] | 2.17 | 0.0234 | 1.21 | 1.08 | 0.482 | 0.206 | 0.840 | 0.433 |
Download Data |
Period Mean (original grids) [mm d-1] |
Bias [mm d-1] |
RMSE [mm d-1] |
Phase Shift [months] |
Bias Score [1] |
RMSE Score [1] |
Seasonal Cycle Score [1] |
Overall Score [1] |
|||
|---|---|---|---|---|---|---|---|---|---|---|---|
| Benchmark | [-] | 0.621 | |||||||||
| CLM50 | [-] | 0.734 | 0.112 | 0.627 | 0.344 | 0.622 | 0.301 | 0.989 | 0.553 | ||
| CTSM51 | [-] | 0.734 | 0.112 | 0.627 | 0.344 | 0.622 | 0.301 | 0.989 | 0.553 | ||
| DeadVeg | [-] | 0.674 | 0.0529 | 0.580 | 0.689 | 0.869 | 0.255 | 0.962 | 0.585 |
Download Data |
Period Mean (original grids) [mm d-1] |
Bias [mm d-1] |
RMSE [mm d-1] |
Phase Shift [months] |
Bias Score [1] |
RMSE Score [1] |
Seasonal Cycle Score [1] |
Overall Score [1] |
|||
|---|---|---|---|---|---|---|---|---|---|---|---|
| Benchmark | [-] | 6.24 | |||||||||
| CLM50 | [-] | 7.94 | 1.70 | 3.70 | 0.00 | 0.459 | 0.320 | 1.00 | 0.525 | ||
| CTSM51 | [-] | 7.94 | 1.70 | 3.70 | 0.00 | 0.459 | 0.320 | 1.00 | 0.525 | ||
| DeadVeg | [-] | 6.05 | -0.196 | 2.34 | 0.00 | 0.937 | 0.474 | 1.00 | 0.721 |
Download Data |
Period Mean (original grids) [mm d-1] |
Bias [mm d-1] |
RMSE [mm d-1] |
Phase Shift [months] |
Bias Score [1] |
RMSE Score [1] |
Seasonal Cycle Score [1] |
Overall Score [1] |
|||
|---|---|---|---|---|---|---|---|---|---|---|---|
| Benchmark | [-] | 2.29 | |||||||||
| CLM50 | [-] | 2.60 | 0.309 | 1.14 | 1.81 | 0.522 | 0.200 | 0.721 | 0.411 | ||
| CTSM51 | [-] | 2.60 | 0.309 | 1.14 | 1.81 | 0.522 | 0.200 | 0.721 | 0.411 | ||
| DeadVeg | [-] | 2.49 | 0.198 | 1.06 | 1.82 | 0.594 | 0.244 | 0.712 | 0.449 |
Download Data |
Period Mean (original grids) [mm d-1] |
Bias [mm d-1] |
RMSE [mm d-1] |
Phase Shift [months] |
Bias Score [1] |
RMSE Score [1] |
Seasonal Cycle Score [1] |
Overall Score [1] |
|||
|---|---|---|---|---|---|---|---|---|---|---|---|
| Benchmark | [-] | 1.11 | |||||||||
| CLM50 | [-] | 1.54 | 0.431 | 0.922 | 1.23 | 0.466 | 0.203 | 0.840 | 0.428 | ||
| CTSM51 | [-] | 1.54 | 0.431 | 0.922 | 1.23 | 0.466 | 0.203 | 0.840 | 0.428 | ||
| DeadVeg | [-] | 1.46 | 0.350 | 0.854 | 1.23 | 0.528 | 0.208 | 0.840 | 0.446 |
Download Data |
Period Mean (original grids) [mm d-1] |
Bias [mm d-1] |
RMSE [mm d-1] |
Phase Shift [months] |
Bias Score [1] |
RMSE Score [1] |
Seasonal Cycle Score [1] |
Overall Score [1] |
|||
|---|---|---|---|---|---|---|---|---|---|---|---|
| Benchmark | [-] | 1.31 | |||||||||
| CLM50 | [-] | 1.18 | -0.127 | 0.866 | 0.546 | 0.401 | 0.254 | 0.933 | 0.461 | ||
| CTSM51 | [-] | 1.18 | -0.127 | 0.866 | 0.546 | 0.401 | 0.254 | 0.933 | 0.461 | ||
| DeadVeg | [-] | 1.38 | 0.0721 | 0.954 | 0.253 | 0.406 | 0.225 | 0.959 | 0.454 |
Download Data |
Period Mean (original grids) [mm d-1] |
Bias [mm d-1] |
RMSE [mm d-1] |
Phase Shift [months] |
Bias Score [1] |
RMSE Score [1] |
Seasonal Cycle Score [1] |
Overall Score [1] |
|||
|---|---|---|---|---|---|---|---|---|---|---|---|
| Benchmark | [-] | 6.63 | |||||||||
| CLM50 | [-] | 6.12 | -0.506 | 2.94 | 0.678 | 0.259 | 0.0208 | 0.961 | 0.315 | ||
| CTSM51 | [-] | 6.12 | -0.506 | 2.94 | 0.678 | 0.259 | 0.0208 | 0.961 | 0.315 | ||
| DeadVeg | [-] | 6.47 | -0.155 | 3.00 | 0.678 | 0.181 | 0.0846 | 0.961 | 0.328 |
Download Data |
Period Mean (original grids) [mm d-1] |
Bias [mm d-1] |
RMSE [mm d-1] |
Phase Shift [months] |
Bias Score [1] |
RMSE Score [1] |
Seasonal Cycle Score [1] |
Overall Score [1] |
|||
|---|---|---|---|---|---|---|---|---|---|---|---|
| Benchmark | [-] | 3.88 | |||||||||
| CLM50 | [-] | 5.01 | 1.13 | 2.34 | 3.07 | 0.303 | 0.163 | 0.494 | 0.281 | ||
| CTSM51 | [-] | 5.01 | 1.13 | 2.34 | 3.07 | 0.303 | 0.163 | 0.494 | 0.281 | ||
| DeadVeg | [-] | 4.45 | 0.565 | 1.57 | 3.07 | 0.651 | 0.418 | 0.494 | 0.495 |
Download Data |
Period Mean (original grids) [mm d-1] |
Bias [mm d-1] |
RMSE [mm d-1] |
Phase Shift [months] |
Bias Score [1] |
RMSE Score [1] |
Seasonal Cycle Score [1] |
Overall Score [1] |
|||
|---|---|---|---|---|---|---|---|---|---|---|---|
| Benchmark | [-] | 0.989 | |||||||||
| CLM50 | [-] | 1.95 | 0.961 | 1.27 | 0.983 | 0.00 | 0.00 | 0.937 | 0.234 | ||
| CTSM51 | [-] | 1.95 | 0.961 | 1.27 | 0.983 | 0.00 | 0.00 | 0.937 | 0.234 | ||
| DeadVeg | [-] | 1.61 | 0.619 | 0.835 | 0.983 | 0.167 | 0.228 | 0.937 | 0.390 |
Temporally integrated period mean