Mean State
Download Data |
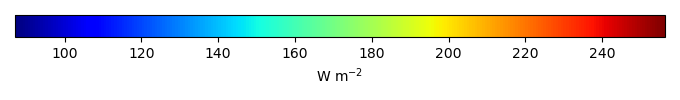
Period Mean (original grids) [W m-2] |
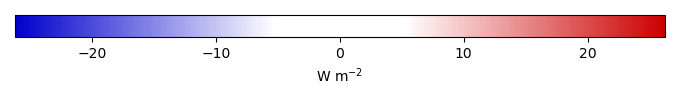
Bias [W m-2] |
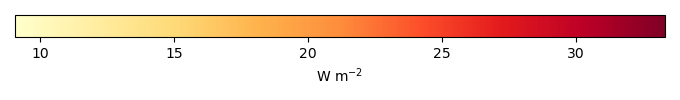
RMSE [W m-2] |
Phase Shift [months] |
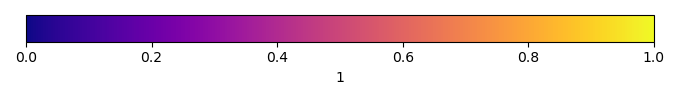
Bias Score [1] |
RMSE Score [1] |
Seasonal Cycle Score [1] |
Overall Score [1] |
|||
|---|---|---|---|---|---|---|---|---|---|---|---|
| Benchmark | [-] | 152. | |||||||||
| CLM50 | [-] | 203. | 51.2 | 55.3 | 0.492 | 0.188 | 0.489 | 0.968 | 0.534 | ||
| CTSM51 | [-] | 203. | 51.2 | 55.3 | 0.492 | 0.188 | 0.489 | 0.968 | 0.534 | ||
| DeadVeg | [-] | 159. | 7.32 | 36.5 | 1.02 | 0.449 | 0.462 | 0.933 | 0.577 |
Download Data |
Period Mean (original grids) [W m-2] |
Bias [W m-2] |
RMSE [W m-2] |
Phase Shift [months] |
Bias Score [1] |
RMSE Score [1] |
Seasonal Cycle Score [1] |
Overall Score [1] |
|||
|---|---|---|---|---|---|---|---|---|---|---|---|
| Benchmark | [-] | 221. | |||||||||
| CLM50 | [-] | 247. | 26.0 | 61.0 | 2.04 | 0.729 | 0.360 | 0.713 | 0.540 | ||
| CTSM51 | [-] | 247. | 26.0 | 61.0 | 2.04 | 0.729 | 0.360 | 0.713 | 0.540 | ||
| DeadVeg | [-] | 251. | 29.5 | 76.0 | 2.04 | 0.342 | 0.355 | 0.713 | 0.441 |
Download Data |
Period Mean (original grids) [W m-2] |
Bias [W m-2] |
RMSE [W m-2] |
Phase Shift [months] |
Bias Score [1] |
RMSE Score [1] |
Seasonal Cycle Score [1] |
Overall Score [1] |
|||
|---|---|---|---|---|---|---|---|---|---|---|---|
| Benchmark | [-] | 228. | |||||||||
| CLM50 | [-] | 245. | 16.5 | 23.8 | 1.02 | 0.528 | 0.524 | 0.933 | 0.627 | ||
| CTSM51 | [-] | 245. | 16.5 | 23.8 | 1.02 | 0.528 | 0.524 | 0.933 | 0.627 | ||
| DeadVeg | [-] | 241. | 13.4 | 33.6 | 3.07 | 0.596 | 0.301 | 0.494 | 0.423 |
Download Data |
Period Mean (original grids) [W m-2] |
Bias [W m-2] |
RMSE [W m-2] |
Phase Shift [months] |
Bias Score [1] |
RMSE Score [1] |
Seasonal Cycle Score [1] |
Overall Score [1] |
|||
|---|---|---|---|---|---|---|---|---|---|---|---|
| Benchmark | [-] | 100. | |||||||||
| CLM50 | [-] | 98.1 | -2.23 | 20.0 | 0.508 | 0.977 | 0.812 | 0.966 | 0.892 | ||
| CTSM51 | [-] | 98.1 | -2.23 | 20.0 | 0.508 | 0.977 | 0.812 | 0.966 | 0.892 | ||
| DeadVeg | [-] | 94.2 | -6.12 | 16.7 | 0.508 | 0.937 | 0.849 | 0.966 | 0.901 |
Download Data |
Period Mean (original grids) [W m-2] |
Bias [W m-2] |
RMSE [W m-2] |
Phase Shift [months] |
Bias Score [1] |
RMSE Score [1] |
Seasonal Cycle Score [1] |
Overall Score [1] |
|||
|---|---|---|---|---|---|---|---|---|---|---|---|
| Benchmark | [-] | 198. | |||||||||
| CLM50 | [-] | 198. | -0.00857 | 16.3 | 0.00 | 1.00 | 0.402 | 1.00 | 0.701 | ||
| CTSM51 | [-] | 198. | -0.00857 | 16.3 | 0.00 | 1.00 | 0.402 | 1.00 | 0.701 | ||
| DeadVeg | [-] | 191. | -6.87 | 27.8 | 0.00 | 0.680 | 0.224 | 1.00 | 0.532 |
Download Data |
Period Mean (original grids) [W m-2] |
Bias [W m-2] |
RMSE [W m-2] |
Phase Shift [months] |
Bias Score [1] |
RMSE Score [1] |
Seasonal Cycle Score [1] |
Overall Score [1] |
|||
|---|---|---|---|---|---|---|---|---|---|---|---|
| Benchmark | [-] | 117. | |||||||||
| CLM50 | [-] | 123. | 5.59 | 12.7 | 0.00 | 0.934 | 0.870 | 1.00 | 0.919 | ||
| CTSM51 | [-] | 123. | 5.59 | 12.7 | 0.00 | 0.934 | 0.870 | 1.00 | 0.919 | ||
| DeadVeg | [-] | 129. | 11.8 | 20.4 | 0.00 | 0.867 | 0.823 | 1.00 | 0.879 |
Download Data |
Period Mean (original grids) [W m-2] |
Bias [W m-2] |
RMSE [W m-2] |
Phase Shift [months] |
Bias Score [1] |
RMSE Score [1] |
Seasonal Cycle Score [1] |
Overall Score [1] |
|||
|---|---|---|---|---|---|---|---|---|---|---|---|
| Benchmark | [-] | 170. | |||||||||
| CLM50 | [-] | 174. | 3.85 | 17.8 | 0.933 | 0.864 | 0.735 | 0.903 | 0.809 | ||
| CTSM51 | [-] | 174. | 3.85 | 17.8 | 0.933 | 0.864 | 0.735 | 0.903 | 0.809 | ||
| DeadVeg | [-] | 179. | 8.23 | 25.9 | 1.10 | 0.769 | 0.668 | 0.882 | 0.747 |
Download Data |
Period Mean (original grids) [W m-2] |
Bias [W m-2] |
RMSE [W m-2] |
Phase Shift [months] |
Bias Score [1] |
RMSE Score [1] |
Seasonal Cycle Score [1] |
Overall Score [1] |
|||
|---|---|---|---|---|---|---|---|---|---|---|---|
| Benchmark | [-] | 223. | |||||||||
| CLM50 | [-] | 224. | -0.265 | 18.1 | 0.513 | 0.855 | 0.724 | 0.952 | 0.813 | ||
| CTSM51 | [-] | 224. | -0.265 | 18.1 | 0.513 | 0.855 | 0.724 | 0.952 | 0.813 | ||
| DeadVeg | [-] | 235. | 10.8 | 24.6 | 0.421 | 0.801 | 0.668 | 0.966 | 0.776 |
Download Data |
Period Mean (original grids) [W m-2] |
Bias [W m-2] |
RMSE [W m-2] |
Phase Shift [months] |
Bias Score [1] |
RMSE Score [1] |
Seasonal Cycle Score [1] |
Overall Score [1] |
|||
|---|---|---|---|---|---|---|---|---|---|---|---|
| Benchmark | [-] | 143. | |||||||||
| CLM50 | [-] | 141. | -1.47 | 17.3 | 0.246 | 0.927 | 0.819 | 0.984 | 0.887 | ||
| CTSM51 | [-] | 141. | -1.47 | 17.3 | 0.246 | 0.927 | 0.819 | 0.984 | 0.887 | ||
| DeadVeg | [-] | 154. | 11.7 | 23.3 | 0.354 | 0.847 | 0.798 | 0.977 | 0.855 |
Download Data |
Period Mean (original grids) [W m-2] |
Bias [W m-2] |
RMSE [W m-2] |
Phase Shift [months] |
Bias Score [1] |
RMSE Score [1] |
Seasonal Cycle Score [1] |
Overall Score [1] |
|||
|---|---|---|---|---|---|---|---|---|---|---|---|
| Benchmark | [-] | 167. | |||||||||
| CLM50 | [-] | 166. | -0.841 | 18.3 | 0.336 | 0.889 | 0.792 | 0.973 | 0.861 | ||
| CTSM51 | [-] | 166. | -0.841 | 18.3 | 0.336 | 0.889 | 0.792 | 0.973 | 0.861 | ||
| DeadVeg | [-] | 173. | 6.20 | 23.6 | 0.557 | 0.832 | 0.756 | 0.957 | 0.825 |
Download Data |
Period Mean (original grids) [W m-2] |
Bias [W m-2] |
RMSE [W m-2] |
Phase Shift [months] |
Bias Score [1] |
RMSE Score [1] |
Seasonal Cycle Score [1] |
Overall Score [1] |
|||
|---|---|---|---|---|---|---|---|---|---|---|---|
| Benchmark | [-] | 107. | |||||||||
| CLM50 | [-] | 99.4 | -7.88 | 24.2 | 0.678 | 0.919 | 0.793 | 0.955 | 0.865 | ||
| CTSM51 | [-] | 99.4 | -7.88 | 24.2 | 0.678 | 0.919 | 0.793 | 0.955 | 0.865 | ||
| DeadVeg | [-] | 96.0 | -11.3 | 22.6 | 0.678 | 0.888 | 0.813 | 0.955 | 0.867 |
Download Data |
Period Mean (original grids) [W m-2] |
Bias [W m-2] |
RMSE [W m-2] |
Phase Shift [months] |
Bias Score [1] |
RMSE Score [1] |
Seasonal Cycle Score [1] |
Overall Score [1] |
|||
|---|---|---|---|---|---|---|---|---|---|---|---|
| Benchmark | [-] | 177. | |||||||||
| CLM50 | [-] | 195. | 18.4 | 26.3 | 0.00 | 0.581 | 0.601 | 1.00 | 0.696 | ||
| CTSM51 | [-] | 195. | 18.4 | 26.3 | 0.00 | 0.581 | 0.601 | 1.00 | 0.696 | ||
| DeadVeg | [-] | 239. | 62.2 | 75.2 | 1.02 | 0.159 | 0.378 | 0.933 | 0.462 |
Download Data |
Period Mean (original grids) [W m-2] |
Bias [W m-2] |
RMSE [W m-2] |
Phase Shift [months] |
Bias Score [1] |
RMSE Score [1] |
Seasonal Cycle Score [1] |
Overall Score [1] |
|||
|---|---|---|---|---|---|---|---|---|---|---|---|
| Benchmark | [-] | 165. | |||||||||
| CLM50 | [-] | 161. | -3.98 | 17.1 | 0.357 | 0.905 | 0.816 | 0.976 | 0.878 | ||
| CTSM51 | [-] | 161. | -3.98 | 17.1 | 0.357 | 0.905 | 0.816 | 0.976 | 0.878 | ||
| DeadVeg | [-] | 169. | 4.16 | 18.3 | 0.687 | 0.894 | 0.800 | 0.954 | 0.862 |
Download Data |
Period Mean (original grids) [W m-2] |
Bias [W m-2] |
RMSE [W m-2] |
Phase Shift [months] |
Bias Score [1] |
RMSE Score [1] |
Seasonal Cycle Score [1] |
Overall Score [1] |
|||
|---|---|---|---|---|---|---|---|---|---|---|---|
| Benchmark | [-] | 129. | |||||||||
| CLM50 | [-] | 133. | 4.07 | 13.7 | 0.00 | 0.941 | 0.855 | 1.00 | 0.913 | ||
| CTSM51 | [-] | 133. | 4.07 | 13.7 | 0.00 | 0.941 | 0.855 | 1.00 | 0.913 | ||
| DeadVeg | [-] | 138. | 8.82 | 18.9 | 0.339 | 0.894 | 0.815 | 0.978 | 0.876 |
Download Data |
Period Mean (original grids) [W m-2] |
Bias [W m-2] |
RMSE [W m-2] |
Phase Shift [months] |
Bias Score [1] |
RMSE Score [1] |
Seasonal Cycle Score [1] |
Overall Score [1] |
|||
|---|---|---|---|---|---|---|---|---|---|---|---|
| Benchmark | [-] | 211. | |||||||||
| CLM50 | [-] | 203. | -7.81 | 16.5 | 0.182 | 0.902 | 0.842 | 0.988 | 0.893 | ||
| CTSM51 | [-] | 203. | -7.81 | 16.5 | 0.182 | 0.902 | 0.842 | 0.988 | 0.893 | ||
| DeadVeg | [-] | 198. | -12.4 | 23.8 | 0.690 | 0.856 | 0.790 | 0.954 | 0.848 |
Download Data |
Period Mean (original grids) [W m-2] |
Bias [W m-2] |
RMSE [W m-2] |
Phase Shift [months] |
Bias Score [1] |
RMSE Score [1] |
Seasonal Cycle Score [1] |
Overall Score [1] |
|||
|---|---|---|---|---|---|---|---|---|---|---|---|
| Benchmark | [-] | 195. | |||||||||
| CLM50 | [-] | 211. | 16.2 | 24.8 | 0.339 | 0.635 | 0.585 | 0.978 | 0.696 | ||
| CTSM51 | [-] | 211. | 16.2 | 24.8 | 0.339 | 0.635 | 0.585 | 0.978 | 0.696 | ||
| DeadVeg | [-] | 203. | 8.93 | 30.4 | 0.339 | 0.611 | 0.511 | 0.978 | 0.653 |
Download Data |
Period Mean (original grids) [W m-2] |
Bias [W m-2] |
RMSE [W m-2] |
Phase Shift [months] |
Bias Score [1] |
RMSE Score [1] |
Seasonal Cycle Score [1] |
Overall Score [1] |
|||
|---|---|---|---|---|---|---|---|---|---|---|---|
| Benchmark | [-] | 195. | |||||||||
| CLM50 | [-] | 202. | 6.74 | 17.8 | 0.00 | 0.894 | 0.745 | 1.00 | 0.846 | ||
| CTSM51 | [-] | 202. | 6.74 | 17.8 | 0.00 | 0.894 | 0.745 | 1.00 | 0.846 | ||
| DeadVeg | [-] | 216. | 20.6 | 30.2 | 1.03 | 0.710 | 0.749 | 0.930 | 0.784 |
Download Data |
Period Mean (original grids) [W m-2] |
Bias [W m-2] |
RMSE [W m-2] |
Phase Shift [months] |
Bias Score [1] |
RMSE Score [1] |
Seasonal Cycle Score [1] |
Overall Score [1] |
|||
|---|---|---|---|---|---|---|---|---|---|---|---|
| Benchmark | [-] | 239. | |||||||||
| CLM50 | [-] | 218. | -20.8 | 25.4 | 1.03 | 0.755 | 0.796 | 0.930 | 0.819 | ||
| CTSM51 | [-] | 218. | -20.8 | 25.4 | 1.03 | 0.755 | 0.796 | 0.930 | 0.819 | ||
| DeadVeg | [-] | 225. | -13.5 | 16.4 | 1.03 | 0.833 | 0.769 | 0.930 | 0.825 |
Temporally integrated period mean