Mean State
Download Data |
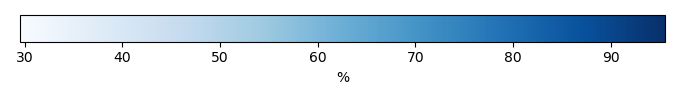
Period Mean (original grids) [%] |
Model Period Mean (intersection) [%] |
Benchmark Period Mean (intersection) [%] |
Model Period Mean (complement) [%] |
Benchmark Period Mean (complement) [%] |
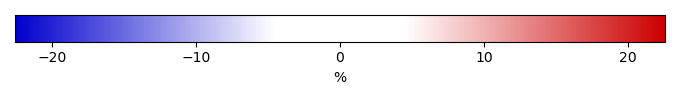
Bias [%] |
RMSE [%] |
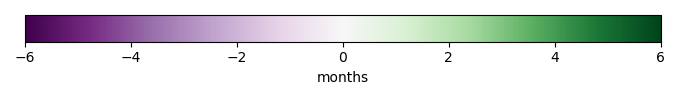
Phase Shift [months] |
Bias Score [1] |
RMSE Score [1] |
Seasonal Cycle Score [1] |
Spatial Distribution Score [1] |
Overall Score [1] |
|||
|---|---|---|---|---|---|---|---|---|---|---|---|---|---|---|---|---|
| Benchmark | [-] | 75.1 | ||||||||||||||
| CLM50 | [-] | 69.1 | 69.2 | 74.2 | 92.4 | -4.20 | 12.4 | 2.35 | 0.271 | 0.259 | 0.631 | 0.822 | 0.448 | |||
| CTSM51 | [-] | 70.5 | 70.7 | 74.2 | 92.4 | -2.75 | 11.2 | 2.36 | 0.291 | 0.279 | 0.628 | 0.807 | 0.457 | |||
| DeadVeg | [-] | 76.6 | 76.5 | 74.2 | 92.4 | 2.71 | 6.07 | 1.51 | 0.359 | 0.618 | 0.775 | 0.978 | 0.670 |
Download Data |
Period Mean (original grids) [%] |
Model Period Mean (intersection) [%] |
Benchmark Period Mean (intersection) [%] |
Model Period Mean (complement) [%] |
Benchmark Period Mean (complement) [%] |
Bias [%] |
RMSE [%] |
Phase Shift [months] |
Bias Score [1] |
RMSE Score [1] |
Seasonal Cycle Score [1] |
Spatial Distribution Score [1] |
Overall Score [1] |
|||
|---|---|---|---|---|---|---|---|---|---|---|---|---|---|---|---|---|
| Benchmark | [-] | 53.2 | ||||||||||||||
| CLM50 | [-] | 51.2 | 50.6 | 52.6 | 90.4 | -1.80 | 9.22 | 0.507 | 0.743 | 0.623 | 0.953 | 0.996 | 0.788 | |||
| CTSM51 | [-] | 52.9 | 52.3 | 52.6 | 90.4 | -0.0842 | 8.56 | 0.516 | 0.751 | 0.647 | 0.952 | 0.997 | 0.799 | |||
| DeadVeg | [-] | 54.1 | 53.7 | 52.6 | 90.4 | 1.28 | 5.74 | 0.249 | 0.782 | 0.775 | 0.975 | 0.988 | 0.859 |
Download Data |
Period Mean (original grids) [%] |
Model Period Mean (intersection) [%] |
Benchmark Period Mean (intersection) [%] |
Model Period Mean (complement) [%] |
Benchmark Period Mean (complement) [%] |
Bias [%] |
RMSE [%] |
Phase Shift [months] |
Bias Score [1] |
RMSE Score [1] |
Seasonal Cycle Score [1] |
Spatial Distribution Score [1] |
Overall Score [1] |
|||
|---|---|---|---|---|---|---|---|---|---|---|---|---|---|---|---|---|
| Benchmark | [-] | 68.1 | ||||||||||||||
| CLM50 | [-] | 61.6 | 61.5 | 67.1 | 91.2 | -4.19 | 10.8 | 1.17 | 0.429 | 0.461 | 0.847 | 0.989 | 0.638 | |||
| CTSM51 | [-] | 62.8 | 62.7 | 67.1 | 91.2 | -3.05 | 10.5 | 1.17 | 0.429 | 0.461 | 0.849 | 0.988 | 0.638 | |||
| DeadVeg | [-] | 63.5 | 63.5 | 67.0 | 91.2 | -2.39 | 6.11 | 0.957 | 0.543 | 0.692 | 0.872 | 0.975 | 0.755 |
Download Data |
Period Mean (original grids) [%] |
Model Period Mean (intersection) [%] |
Benchmark Period Mean (intersection) [%] |
Model Period Mean (complement) [%] |
Benchmark Period Mean (complement) [%] |
Bias [%] |
RMSE [%] |
Phase Shift [months] |
Bias Score [1] |
RMSE Score [1] |
Seasonal Cycle Score [1] |
Spatial Distribution Score [1] |
Overall Score [1] |
|||
|---|---|---|---|---|---|---|---|---|---|---|---|---|---|---|---|---|
| Benchmark | [-] | 72.7 | ||||||||||||||
| CLM50 | [-] | 88.6 | 88.5 | 70.9 | 92.6 | 17.8 | 24.8 | 2.57 | 0.381 | 0.419 | 0.580 | 0.109 | 0.382 | |||
| CTSM51 | [-] | 89.7 | 89.7 | 70.9 | 92.6 | 19.0 | 25.2 | 3.03 | 0.354 | 0.433 | 0.509 | 0.0946 | 0.365 | |||
| DeadVeg | [-] | 83.4 | 83.4 | 71.1 | 92.5 | 12.7 | 19.2 | 3.22 | 0.486 | 0.513 | 0.465 | 0.249 | 0.445 |
Download Data |
Period Mean (original grids) [%] |
Model Period Mean (intersection) [%] |
Benchmark Period Mean (intersection) [%] |
Model Period Mean (complement) [%] |
Benchmark Period Mean (complement) [%] |
Bias [%] |
RMSE [%] |
Phase Shift [months] |
Bias Score [1] |
RMSE Score [1] |
Seasonal Cycle Score [1] |
Spatial Distribution Score [1] |
Overall Score [1] |
|||
|---|---|---|---|---|---|---|---|---|---|---|---|---|---|---|---|---|
| Benchmark | [-] | 86.2 | ||||||||||||||
| CLM50 | [-] | 85.6 | 85.7 | 84.5 | 92.0 | 0.331 | 6.59 | 2.40 | 0.294 | 0.437 | 0.620 | 0.472 | 0.452 | |||
| CTSM51 | [-] | 86.2 | 86.2 | 84.5 | 92.0 | 1.10 | 6.48 | 2.38 | 0.277 | 0.445 | 0.626 | 0.468 | 0.452 | |||
| DeadVeg | [-] | 85.5 | 85.6 | 84.5 | 92.0 | 0.296 | 6.07 | 2.20 | 0.261 | 0.560 | 0.651 | 0.674 | 0.541 |
Download Data |
Period Mean (original grids) [%] |
Model Period Mean (intersection) [%] |
Benchmark Period Mean (intersection) [%] |
Model Period Mean (complement) [%] |
Benchmark Period Mean (complement) [%] |
Bias [%] |
RMSE [%] |
Phase Shift [months] |
Bias Score [1] |
RMSE Score [1] |
Seasonal Cycle Score [1] |
Spatial Distribution Score [1] |
Overall Score [1] |
|||
|---|---|---|---|---|---|---|---|---|---|---|---|---|---|---|---|---|
| Benchmark | [-] | 72.9 | ||||||||||||||
| CLM50 | [-] | 82.6 | 82.7 | 72.6 | 89.8 | 10.1 | 17.6 | 2.08 | 0.540 | 0.396 | 0.690 | 0.379 | 0.480 | |||
| CTSM51 | [-] | 84.6 | 84.6 | 72.6 | 89.8 | 12.0 | 17.8 | 1.99 | 0.468 | 0.426 | 0.705 | 0.342 | 0.473 | |||
| DeadVeg | [-] | 80.9 | 80.9 | 72.7 | 89.8 | 8.20 | 11.4 | 2.16 | 0.584 | 0.630 | 0.669 | 0.489 | 0.600 |
Download Data |
Period Mean (original grids) [%] |
Model Period Mean (intersection) [%] |
Benchmark Period Mean (intersection) [%] |
Model Period Mean (complement) [%] |
Benchmark Period Mean (complement) [%] |
Bias [%] |
RMSE [%] |
Phase Shift [months] |
Bias Score [1] |
RMSE Score [1] |
Seasonal Cycle Score [1] |
Spatial Distribution Score [1] |
Overall Score [1] |
|||
|---|---|---|---|---|---|---|---|---|---|---|---|---|---|---|---|---|
| Benchmark | [-] | 57.3 | ||||||||||||||
| CLM50 | [-] | 65.1 | 65.3 | 56.7 | 89.9 | 9.28 | 20.7 | 1.71 | 0.452 | 0.444 | 0.735 | 0.807 | 0.576 | |||
| CTSM51 | [-] | 66.6 | 66.8 | 56.7 | 89.9 | 10.8 | 20.7 | 1.74 | 0.439 | 0.456 | 0.731 | 0.819 | 0.580 | |||
| DeadVeg | [-] | 64.7 | 64.8 | 56.7 | 89.9 | 8.61 | 12.5 | 1.26 | 0.564 | 0.655 | 0.823 | 0.664 | 0.672 |
Download Data |
Period Mean (original grids) [%] |
Model Period Mean (intersection) [%] |
Benchmark Period Mean (intersection) [%] |
Model Period Mean (complement) [%] |
Benchmark Period Mean (complement) [%] |
Bias [%] |
RMSE [%] |
Phase Shift [months] |
Bias Score [1] |
RMSE Score [1] |
Seasonal Cycle Score [1] |
Spatial Distribution Score [1] |
Overall Score [1] |
|||
|---|---|---|---|---|---|---|---|---|---|---|---|---|---|---|---|---|
| Benchmark | [-] | 67.0 | ||||||||||||||
| CLM50 | [-] | 62.4 | 62.1 | 65.2 | 91.8 | -0.719 | 12.4 | 1.22 | 0.517 | 0.477 | 0.825 | 0.984 | 0.656 | |||
| CTSM51 | [-] | 65.1 | 64.8 | 65.2 | 91.8 | 1.81 | 11.5 | 1.33 | 0.535 | 0.499 | 0.806 | 0.976 | 0.663 | |||
| DeadVeg | [-] | 66.3 | 66.3 | 65.1 | 91.8 | 2.81 | 7.82 | 0.889 | 0.581 | 0.690 | 0.875 | 0.874 | 0.742 |
Download Data |
Period Mean (original grids) [%] |
Model Period Mean (intersection) [%] |
Benchmark Period Mean (intersection) [%] |
Model Period Mean (complement) [%] |
Benchmark Period Mean (complement) [%] |
Bias [%] |
RMSE [%] |
Phase Shift [months] |
Bias Score [1] |
RMSE Score [1] |
Seasonal Cycle Score [1] |
Spatial Distribution Score [1] |
Overall Score [1] |
|||
|---|---|---|---|---|---|---|---|---|---|---|---|---|---|---|---|---|
| Benchmark | [-] | 77.4 | ||||||||||||||
| CLM50 | [-] | 88.9 | 88.8 | 76.6 | 93.1 | 12.4 | 18.1 | 2.07 | 0.471 | 0.450 | 0.674 | 0.210 | 0.451 | |||
| CTSM51 | [-] | 90.4 | 90.3 | 76.6 | 93.1 | 13.8 | 18.5 | 2.47 | 0.423 | 0.471 | 0.608 | 0.167 | 0.428 | |||
| DeadVeg | [-] | 86.3 | 86.2 | 76.7 | 93.0 | 9.77 | 13.9 | 2.98 | 0.538 | 0.579 | 0.489 | 0.304 | 0.498 |
Download Data |
Period Mean (original grids) [%] |
Model Period Mean (intersection) [%] |
Benchmark Period Mean (intersection) [%] |
Model Period Mean (complement) [%] |
Benchmark Period Mean (complement) [%] |
Bias [%] |
RMSE [%] |
Phase Shift [months] |
Bias Score [1] |
RMSE Score [1] |
Seasonal Cycle Score [1] |
Spatial Distribution Score [1] |
Overall Score [1] |
|||
|---|---|---|---|---|---|---|---|---|---|---|---|---|---|---|---|---|
| Benchmark | [-] | 55.2 | ||||||||||||||
| CLM50 | [-] | 50.1 | 50.1 | 52.7 | 87.7 | 0.0961 | 7.25 | 0.497 | 0.571 | 0.635 | 0.928 | 0.992 | 0.752 | |||
| CTSM51 | [-] | 51.4 | 51.3 | 52.7 | 87.7 | 1.30 | 7.44 | 0.515 | 0.567 | 0.622 | 0.925 | 0.992 | 0.746 | |||
| DeadVeg | [-] | 49.3 | 49.2 | 52.6 | 87.7 | -1.37 | 5.36 | 0.503 | 0.663 | 0.761 | 0.923 | 0.956 | 0.813 |
Download Data |
Period Mean (original grids) [%] |
Model Period Mean (intersection) [%] |
Benchmark Period Mean (intersection) [%] |
Model Period Mean (complement) [%] |
Benchmark Period Mean (complement) [%] |
Bias [%] |
RMSE [%] |
Phase Shift [months] |
Bias Score [1] |
RMSE Score [1] |
Seasonal Cycle Score [1] |
Spatial Distribution Score [1] |
Overall Score [1] |
|||
|---|---|---|---|---|---|---|---|---|---|---|---|---|---|---|---|---|
| Benchmark | [-] | 78.5 | ||||||||||||||
| CLM50 | [-] | 77.7 | 77.7 | 77.4 | 90.0 | 0.169 | 8.78 | 0.823 | 0.592 | 0.507 | 0.902 | 0.983 | 0.698 | |||
| CTSM51 | [-] | 79.8 | 79.8 | 77.4 | 90.0 | 2.17 | 8.91 | 0.807 | 0.551 | 0.521 | 0.908 | 0.959 | 0.692 | |||
| DeadVeg | [-] | 78.6 | 78.6 | 77.4 | 90.0 | 1.10 | 5.58 | 0.648 | 0.644 | 0.732 | 0.930 | 0.839 | 0.775 |
Download Data |
Period Mean (original grids) [%] |
Model Period Mean (intersection) [%] |
Benchmark Period Mean (intersection) [%] |
Model Period Mean (complement) [%] |
Benchmark Period Mean (complement) [%] |
Bias [%] |
RMSE [%] |
Phase Shift [months] |
Bias Score [1] |
RMSE Score [1] |
Seasonal Cycle Score [1] |
Spatial Distribution Score [1] |
Overall Score [1] |
|||
|---|---|---|---|---|---|---|---|---|---|---|---|---|---|---|---|---|
| Benchmark | [-] | 68.9 | ||||||||||||||
| CLM50 | [-] | 69.7 | 69.7 | 67.8 | 91.0 | 2.80 | 12.6 | 1.51 | 0.435 | 0.452 | 0.782 | 0.977 | 0.620 | |||
| CTSM51 | [-] | 70.9 | 70.9 | 67.8 | 91.0 | 3.98 | 12.5 | 1.52 | 0.421 | 0.463 | 0.780 | 0.973 | 0.620 | |||
| DeadVeg | [-] | 69.8 | 69.8 | 67.8 | 91.0 | 2.68 | 8.73 | 1.47 | 0.488 | 0.651 | 0.775 | 0.914 | 0.696 |
Download Data |
Period Mean (original grids) [%] |
Model Period Mean (intersection) [%] |
Benchmark Period Mean (intersection) [%] |
Model Period Mean (complement) [%] |
Benchmark Period Mean (complement) [%] |
Bias [%] |
RMSE [%] |
Phase Shift [months] |
Bias Score [1] |
RMSE Score [1] |
Seasonal Cycle Score [1] |
Spatial Distribution Score [1] |
Overall Score [1] |
|||
|---|---|---|---|---|---|---|---|---|---|---|---|---|---|---|---|---|
| Benchmark | [-] | 44.5 | ||||||||||||||
| CLM50 | [-] | 41.4 | 41.5 | 42.8 | 88.5 | 0.213 | 12.6 | 0.778 | 0.415 | 0.412 | 0.892 | 0.878 | 0.602 | |||
| CTSM51 | [-] | 42.0 | 42.0 | 42.8 | 88.5 | 0.769 | 12.6 | 0.770 | 0.413 | 0.412 | 0.893 | 0.897 | 0.605 | |||
| DeadVeg | [-] | 48.6 | 48.6 | 42.8 | 88.5 | 6.85 | 11.0 | 0.805 | 0.398 | 0.600 | 0.893 | 0.885 | 0.675 |
Download Data |
Period Mean (original grids) [%] |
Model Period Mean (intersection) [%] |
Benchmark Period Mean (intersection) [%] |
Model Period Mean (complement) [%] |
Benchmark Period Mean (complement) [%] |
Bias [%] |
RMSE [%] |
Phase Shift [months] |
Bias Score [1] |
RMSE Score [1] |
Seasonal Cycle Score [1] |
Spatial Distribution Score [1] |
Overall Score [1] |
|||
|---|---|---|---|---|---|---|---|---|---|---|---|---|---|---|---|---|
| Benchmark | [-] | 83.0 | ||||||||||||||
| CLM50 | [-] | 88.7 | 88.7 | 82.3 | 92.8 | 6.86 | 14.4 | 2.48 | 0.558 | 0.391 | 0.612 | 0.393 | 0.469 | |||
| CTSM51 | [-] | 89.6 | 89.6 | 82.3 | 92.8 | 7.74 | 14.4 | 2.44 | 0.522 | 0.409 | 0.623 | 0.322 | 0.457 | |||
| DeadVeg | [-] | 79.1 | 79.0 | 82.4 | 92.8 | -2.91 | 11.9 | 2.51 | 0.524 | 0.508 | 0.595 | 0.667 | 0.560 |
Download Data |
Period Mean (original grids) [%] |
Model Period Mean (intersection) [%] |
Benchmark Period Mean (intersection) [%] |
Model Period Mean (complement) [%] |
Benchmark Period Mean (complement) [%] |
Bias [%] |
RMSE [%] |
Phase Shift [months] |
Bias Score [1] |
RMSE Score [1] |
Seasonal Cycle Score [1] |
Spatial Distribution Score [1] |
Overall Score [1] |
|||
|---|---|---|---|---|---|---|---|---|---|---|---|---|---|---|---|---|
| Benchmark | [-] | 72.3 | ||||||||||||||
| CLM50 | [-] | 67.0 | 67.1 | 68.5 | 91.4 | 0.602 | 9.86 | 1.68 | 0.366 | 0.489 | 0.743 | 0.936 | 0.605 | |||
| CTSM51 | [-] | 68.3 | 68.4 | 68.5 | 91.4 | 1.81 | 10.1 | 1.70 | 0.350 | 0.489 | 0.741 | 0.916 | 0.597 | |||
| DeadVeg | [-] | 65.5 | 65.5 | 68.4 | 91.4 | -0.367 | 7.29 | 1.26 | 0.465 | 0.643 | 0.810 | 0.930 | 0.698 |
Download Data |
Period Mean (original grids) [%] |
Model Period Mean (intersection) [%] |
Benchmark Period Mean (intersection) [%] |
Model Period Mean (complement) [%] |
Benchmark Period Mean (complement) [%] |
Bias [%] |
RMSE [%] |
Phase Shift [months] |
Bias Score [1] |
RMSE Score [1] |
Seasonal Cycle Score [1] |
Spatial Distribution Score [1] |
Overall Score [1] |
|||
|---|---|---|---|---|---|---|---|---|---|---|---|---|---|---|---|---|
| Benchmark | [-] | 73.0 | ||||||||||||||
| CLM50 | [-] | 76.6 | 76.6 | 72.2 | 91.3 | 4.41 | 8.98 | 2.32 | 0.445 | 0.433 | 0.633 | 0.898 | 0.568 | |||
| CTSM51 | [-] | 77.8 | 77.8 | 72.2 | 91.3 | 5.63 | 9.54 | 2.31 | 0.396 | 0.440 | 0.635 | 0.904 | 0.563 | |||
| DeadVeg | [-] | 72.8 | 72.9 | 72.1 | 91.2 | 1.07 | 4.53 | 2.40 | 0.675 | 0.689 | 0.588 | 0.759 | 0.680 |
Download Data |
Period Mean (original grids) [%] |
Model Period Mean (intersection) [%] |
Benchmark Period Mean (intersection) [%] |
Model Period Mean (complement) [%] |
Benchmark Period Mean (complement) [%] |
Bias [%] |
RMSE [%] |
Phase Shift [months] |
Bias Score [1] |
RMSE Score [1] |
Seasonal Cycle Score [1] |
Spatial Distribution Score [1] |
Overall Score [1] |
|||
|---|---|---|---|---|---|---|---|---|---|---|---|---|---|---|---|---|
| Benchmark | [-] | 79.5 | ||||||||||||||
| CLM50 | [-] | 82.1 | 82.1 | 79.0 | 90.4 | 3.16 | 7.74 | 0.984 | 0.700 | 0.575 | 0.895 | 0.891 | 0.727 | |||
| CTSM51 | [-] | 83.3 | 83.3 | 79.0 | 90.4 | 4.38 | 8.10 | 0.949 | 0.647 | 0.587 | 0.901 | 0.835 | 0.712 | |||
| DeadVeg | [-] | 76.4 | 76.5 | 79.1 | 90.4 | -2.43 | 7.90 | 1.35 | 0.717 | 0.556 | 0.819 | 0.854 | 0.700 |
Download Data |
Period Mean (original grids) [%] |
Model Period Mean (intersection) [%] |
Benchmark Period Mean (intersection) [%] |
Model Period Mean (complement) [%] |
Benchmark Period Mean (complement) [%] |
Bias [%] |
RMSE [%] |
Phase Shift [months] |
Bias Score [1] |
RMSE Score [1] |
Seasonal Cycle Score [1] |
Spatial Distribution Score [1] |
Overall Score [1] |
|||
|---|---|---|---|---|---|---|---|---|---|---|---|---|---|---|---|---|
| Benchmark | [-] | 56.3 | ||||||||||||||
| CLM50 | [-] | 64.0 | 64.1 | 55.8 | 90.5 | 8.48 | 13.1 | 1.12 | 0.455 | 0.492 | 0.857 | 0.988 | 0.657 | |||
| CTSM51 | [-] | 65.7 | 65.7 | 55.8 | 90.5 | 10.1 | 14.0 | 1.02 | 0.409 | 0.499 | 0.873 | 0.992 | 0.654 | |||
| DeadVeg | [-] | 56.9 | 57.1 | 55.7 | 90.5 | 1.80 | 5.66 | 1.21 | 0.723 | 0.717 | 0.842 | 0.955 | 0.791 |
Download Data |
Period Mean (original grids) [%] |
Model Period Mean (intersection) [%] |
Benchmark Period Mean (intersection) [%] |
Model Period Mean (complement) [%] |
Benchmark Period Mean (complement) [%] |
Bias [%] |
RMSE [%] |
Phase Shift [months] |
Bias Score [1] |
RMSE Score [1] |
Seasonal Cycle Score [1] |
Spatial Distribution Score [1] |
Overall Score [1] |
|||
|---|---|---|---|---|---|---|---|---|---|---|---|---|---|---|---|---|
| Benchmark | [-] | 82.0 | ||||||||||||||
| CLM50 | [-] | 80.7 | 80.7 | 81.7 | 92.4 | -1.01 | 9.81 | 1.68 | 0.299 | 0.287 | 0.766 | 0.923 | 0.512 | |||
| CTSM51 | [-] | 81.6 | 81.6 | 81.7 | 92.4 | -0.0907 | 9.30 | 1.70 | 0.301 | 0.304 | 0.765 | 0.959 | 0.527 | |||
| DeadVeg | [-] | 86.5 | 86.5 | 81.7 | 92.4 | 4.60 | 6.18 | 0.897 | 0.295 | 0.678 | 0.886 | 0.998 | 0.707 |
Download Data |
Period Mean (original grids) [%] |
Model Period Mean (intersection) [%] |
Benchmark Period Mean (intersection) [%] |
Model Period Mean (complement) [%] |
Benchmark Period Mean (complement) [%] |
Bias [%] |
RMSE [%] |
Phase Shift [months] |
Bias Score [1] |
RMSE Score [1] |
Seasonal Cycle Score [1] |
Spatial Distribution Score [1] |
Overall Score [1] |
|||
|---|---|---|---|---|---|---|---|---|---|---|---|---|---|---|---|---|
| Benchmark | [-] | 72.6 | ||||||||||||||
| CLM50 | [-] | 72.1 | 71.9 | 71.9 | 93.0 | 0.462 | 11.0 | 1.44 | 0.358 | 0.426 | 0.814 | 0.857 | 0.576 | |||
| CTSM51 | [-] | 73.2 | 73.1 | 71.9 | 93.0 | 1.59 | 10.8 | 1.43 | 0.362 | 0.442 | 0.814 | 0.876 | 0.587 | |||
| DeadVeg | [-] | 74.0 | 73.8 | 71.9 | 93.0 | 2.14 | 4.88 | 0.837 | 0.576 | 0.726 | 0.896 | 0.992 | 0.783 |
Download Data |
Period Mean (original grids) [%] |
Model Period Mean (intersection) [%] |
Benchmark Period Mean (intersection) [%] |
Model Period Mean (complement) [%] |
Benchmark Period Mean (complement) [%] |
Bias [%] |
RMSE [%] |
Phase Shift [months] |
Bias Score [1] |
RMSE Score [1] |
Seasonal Cycle Score [1] |
Spatial Distribution Score [1] |
Overall Score [1] |
|||
|---|---|---|---|---|---|---|---|---|---|---|---|---|---|---|---|---|
| Benchmark | [-] | 61.9 | ||||||||||||||
| CLM50 | [-] | 63.1 | 63.3 | 58.6 | 90.7 | 6.30 | 16.9 | 1.12 | 0.257 | 0.492 | 0.849 | 0.929 | 0.604 | |||
| CTSM51 | [-] | 64.2 | 64.4 | 58.6 | 90.7 | 7.31 | 17.2 | 1.14 | 0.258 | 0.480 | 0.847 | 0.931 | 0.599 | |||
| DeadVeg | [-] | 58.2 | 58.3 | 58.7 | 90.7 | 1.71 | 10.9 | 1.16 | 0.399 | 0.645 | 0.839 | 0.846 | 0.675 |
Temporally integrated period mean