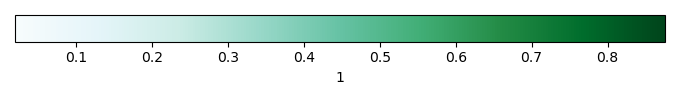
Mean State
Download Data |
Period Mean (original grids) [1] |
Model Period Mean (intersection) [1] |
Benchmark Period Mean (intersection) [1] |
Model Period Mean (complement) [1] |
Benchmark Period Mean (complement) [1] |
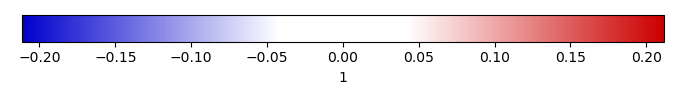
Bias [1] |
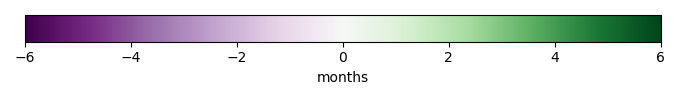
Phase Shift [months] |
Bias Score [1] |
Seasonal Cycle Score [1] |
Spatial Distribution Score [1] |
Overall Score [1] |
|||
|---|---|---|---|---|---|---|---|---|---|---|---|---|---|---|
| Benchmark | [-] | 0.564 | ||||||||||||
| CLM50 | [-] | 0.600 | 0.609 | 0.566 | 0.514 | 0.593 | 0.0403 | 2.64 | 0.534 | 0.581 | 0.980 | 0.698 | ||
| CTSM51 | [-] | 0.619 | 0.629 | 0.566 | 0.503 | 0.593 | 0.0590 | 2.72 | 0.435 | 0.565 | 0.957 | 0.653 | ||
| DeadVeg | [-] | 0.628 | 0.637 | 0.564 | 0.536 | 0.591 | 0.0708 | 2.26 | 0.411 | 0.700 | 0.944 | 0.685 |
Download Data |
Period Mean (original grids) [1] |
Model Period Mean (intersection) [1] |
Benchmark Period Mean (intersection) [1] |
Model Period Mean (complement) [1] |
Benchmark Period Mean (complement) [1] |
Bias [1] |
Phase Shift [months] |
Bias Score [1] |
Seasonal Cycle Score [1] |
Spatial Distribution Score [1] |
Overall Score [1] |
|||
|---|---|---|---|---|---|---|---|---|---|---|---|---|---|---|
| Benchmark | [-] | 0.438 | ||||||||||||
| CLM50 | [-] | 0.468 | 0.465 | 0.440 | 0.354 | 0.396 | 0.0334 | 1.39 | 0.770 | 0.771 | 0.953 | 0.831 | ||
| CTSM51 | [-] | 0.449 | 0.447 | 0.440 | 0.341 | 0.396 | 0.0146 | 1.55 | 0.760 | 0.748 | 0.950 | 0.819 | ||
| DeadVeg | [-] | 0.463 | 0.461 | 0.438 | 0.346 | 0.398 | 0.0304 | 1.46 | 0.720 | 0.739 | 0.981 | 0.813 |
Download Data |
Period Mean (original grids) [1] |
Model Period Mean (intersection) [1] |
Benchmark Period Mean (intersection) [1] |
Model Period Mean (complement) [1] |
Benchmark Period Mean (complement) [1] |
Bias [1] |
Phase Shift [months] |
Bias Score [1] |
Seasonal Cycle Score [1] |
Spatial Distribution Score [1] |
Overall Score [1] |
|||
|---|---|---|---|---|---|---|---|---|---|---|---|---|---|---|
| Benchmark | [-] | 0.476 | ||||||||||||
| CLM50 | [-] | 0.470 | 0.472 | 0.479 | 0.453 | 0.393 | -0.00848 | 1.86 | 0.690 | 0.700 | 0.862 | 0.750 | ||
| CTSM51 | [-] | 0.450 | 0.451 | 0.479 | 0.438 | 0.393 | -0.0295 | 1.54 | 0.652 | 0.771 | 0.879 | 0.767 | ||
| DeadVeg | [-] | 0.446 | 0.446 | 0.476 | 0.438 | 0.393 | -0.0300 | 0.995 | 0.612 | 0.888 | 0.805 | 0.768 |
Download Data |
Period Mean (original grids) [1] |
Model Period Mean (intersection) [1] |
Benchmark Period Mean (intersection) [1] |
Model Period Mean (complement) [1] |
Benchmark Period Mean (complement) [1] |
Bias [1] |
Phase Shift [months] |
Bias Score [1] |
Seasonal Cycle Score [1] |
Spatial Distribution Score [1] |
Overall Score [1] |
|||
|---|---|---|---|---|---|---|---|---|---|---|---|---|---|---|
| Benchmark | [-] | 0.499 | ||||||||||||
| CLM50 | [-] | 0.525 | 0.532 | 0.501 | 0.485 | 0.437 | 0.0304 | 0.972 | 0.518 | 0.889 | 0.534 | 0.647 | ||
| CTSM51 | [-] | 0.547 | 0.553 | 0.501 | 0.508 | 0.437 | 0.0520 | 1.03 | 0.458 | 0.882 | 0.427 | 0.589 | ||
| DeadVeg | [-] | 0.565 | 0.568 | 0.499 | 0.554 | 0.434 | 0.0693 | 0.826 | 0.479 | 0.915 | 0.639 | 0.678 |
Download Data |
Period Mean (original grids) [1] |
Model Period Mean (intersection) [1] |
Benchmark Period Mean (intersection) [1] |
Model Period Mean (complement) [1] |
Benchmark Period Mean (complement) [1] |
Bias [1] |
Phase Shift [months] |
Bias Score [1] |
Seasonal Cycle Score [1] |
Spatial Distribution Score [1] |
Overall Score [1] |
|||
|---|---|---|---|---|---|---|---|---|---|---|---|---|---|---|
| Benchmark | [-] | 0.723 | ||||||||||||
| CLM50 | [-] | 0.779 | 0.784 | 0.735 | 0.774 | 0.569 | 0.0498 | 1.66 | 0.387 | 0.753 | 0.860 | 0.667 | ||
| CTSM51 | [-] | 0.808 | 0.825 | 0.735 | 0.788 | 0.569 | 0.0887 | 1.76 | 0.258 | 0.734 | 0.973 | 0.655 | ||
| DeadVeg | [-] | 0.743 | 0.756 | 0.729 | 0.728 | 0.562 | 0.0252 | 1.88 | 0.456 | 0.729 | 0.958 | 0.714 |
Download Data |
Period Mean (original grids) [1] |
Model Period Mean (intersection) [1] |
Benchmark Period Mean (intersection) [1] |
Model Period Mean (complement) [1] |
Benchmark Period Mean (complement) [1] |
Bias [1] |
Phase Shift [months] |
Bias Score [1] |
Seasonal Cycle Score [1] |
Spatial Distribution Score [1] |
Overall Score [1] |
|||
|---|---|---|---|---|---|---|---|---|---|---|---|---|---|---|
| Benchmark | [-] | 0.577 | ||||||||||||
| CLM50 | [-] | 0.558 | 0.559 | 0.577 | 0.475 | 0.475 | -0.0165 | 0.862 | 0.625 | 0.909 | 0.656 | 0.730 | ||
| CTSM51 | [-] | 0.571 | 0.573 | 0.577 | 0.474 | 0.475 | -0.00224 | 0.921 | 0.630 | 0.903 | 0.638 | 0.723 | ||
| DeadVeg | [-] | 0.554 | 0.555 | 0.577 | 0.501 | 0.475 | -0.0215 | 0.889 | 0.577 | 0.891 | 0.876 | 0.781 |
Download Data |
Period Mean (original grids) [1] |
Model Period Mean (intersection) [1] |
Benchmark Period Mean (intersection) [1] |
Model Period Mean (complement) [1] |
Benchmark Period Mean (complement) [1] |
Bias [1] |
Phase Shift [months] |
Bias Score [1] |
Seasonal Cycle Score [1] |
Spatial Distribution Score [1] |
Overall Score [1] |
|||
|---|---|---|---|---|---|---|---|---|---|---|---|---|---|---|
| Benchmark | [-] | 0.458 | ||||||||||||
| CLM50 | [-] | 0.437 | 0.427 | 0.459 | 0.591 | 0.554 | -0.0316 | 1.49 | 0.585 | 0.820 | 0.957 | 0.788 | ||
| CTSM51 | [-] | 0.434 | 0.425 | 0.459 | 0.582 | 0.554 | -0.0342 | 1.49 | 0.583 | 0.828 | 0.957 | 0.789 | ||
| DeadVeg | [-] | 0.448 | 0.436 | 0.458 | 0.621 | 0.554 | -0.0224 | 1.54 | 0.596 | 0.831 | 0.988 | 0.805 |
Download Data |
Period Mean (original grids) [1] |
Model Period Mean (intersection) [1] |
Benchmark Period Mean (intersection) [1] |
Model Period Mean (complement) [1] |
Benchmark Period Mean (complement) [1] |
Bias [1] |
Phase Shift [months] |
Bias Score [1] |
Seasonal Cycle Score [1] |
Spatial Distribution Score [1] |
Overall Score [1] |
|||
|---|---|---|---|---|---|---|---|---|---|---|---|---|---|---|
| Benchmark | [-] | 0.546 | ||||||||||||
| CLM50 | [-] | 0.613 | 0.601 | 0.547 | 0.678 | 0.614 | 0.0539 | 2.01 | 0.604 | 0.691 | 0.983 | 0.759 | ||
| CTSM51 | [-] | 0.600 | 0.588 | 0.547 | 0.666 | 0.614 | 0.0411 | 1.84 | 0.641 | 0.729 | 0.990 | 0.787 | ||
| DeadVeg | [-] | 0.596 | 0.585 | 0.546 | 0.661 | 0.611 | 0.0403 | 1.50 | 0.676 | 0.797 | 0.989 | 0.821 |
Download Data |
Period Mean (original grids) [1] |
Model Period Mean (intersection) [1] |
Benchmark Period Mean (intersection) [1] |
Model Period Mean (complement) [1] |
Benchmark Period Mean (complement) [1] |
Bias [1] |
Phase Shift [months] |
Bias Score [1] |
Seasonal Cycle Score [1] |
Spatial Distribution Score [1] |
Overall Score [1] |
|||
|---|---|---|---|---|---|---|---|---|---|---|---|---|---|---|
| Benchmark | [-] | 0.532 | ||||||||||||
| CLM50 | [-] | 0.677 | 0.684 | 0.533 | 0.614 | 0.428 | 0.147 | 1.01 | 0.319 | 0.888 | 0.431 | 0.546 | ||
| CTSM51 | [-] | 0.711 | 0.719 | 0.533 | 0.637 | 0.438 | 0.180 | 1.41 | 0.263 | 0.821 | 0.384 | 0.490 | ||
| DeadVeg | [-] | 0.654 | 0.653 | 0.533 | 0.650 | 0.429 | 0.119 | 0.982 | 0.365 | 0.890 | 0.650 | 0.635 |
Download Data |
Period Mean (original grids) [1] |
Model Period Mean (intersection) [1] |
Benchmark Period Mean (intersection) [1] |
Model Period Mean (complement) [1] |
Benchmark Period Mean (complement) [1] |
Bias [1] |
Phase Shift [months] |
Bias Score [1] |
Seasonal Cycle Score [1] |
Spatial Distribution Score [1] |
Overall Score [1] |
|||
|---|---|---|---|---|---|---|---|---|---|---|---|---|---|---|
| Benchmark | [-] | 0.323 | ||||||||||||
| CLM50 | [-] | 0.371 | 0.345 | 0.327 | 0.522 | 0.460 | 0.0172 | 1.53 | 0.698 | 0.793 | 0.978 | 0.823 | ||
| CTSM51 | [-] | 0.372 | 0.348 | 0.327 | 0.508 | 0.460 | 0.0201 | 1.56 | 0.700 | 0.784 | 0.988 | 0.824 | ||
| DeadVeg | [-] | 0.350 | 0.325 | 0.322 | 0.491 | 0.456 | 0.00281 | 2.02 | 0.708 | 0.713 | 0.984 | 0.802 |
Download Data |
Period Mean (original grids) [1] |
Model Period Mean (intersection) [1] |
Benchmark Period Mean (intersection) [1] |
Model Period Mean (complement) [1] |
Benchmark Period Mean (complement) [1] |
Bias [1] |
Phase Shift [months] |
Bias Score [1] |
Seasonal Cycle Score [1] |
Spatial Distribution Score [1] |
Overall Score [1] |
|||
|---|---|---|---|---|---|---|---|---|---|---|---|---|---|---|
| Benchmark | [-] | 0.616 | ||||||||||||
| CLM50 | [-] | 0.578 | 0.602 | 0.617 | 0.487 | 0.523 | -0.0178 | 1.87 | 0.602 | 0.707 | 0.996 | 0.768 | ||
| CTSM51 | [-] | 0.576 | 0.599 | 0.617 | 0.490 | 0.523 | -0.0216 | 2.07 | 0.580 | 0.671 | 0.996 | 0.749 | ||
| DeadVeg | [-] | 0.526 | 0.535 | 0.616 | 0.496 | 0.528 | -0.0824 | 2.21 | 0.349 | 0.628 | 0.797 | 0.591 |
Download Data |
Period Mean (original grids) [1] |
Model Period Mean (intersection) [1] |
Benchmark Period Mean (intersection) [1] |
Model Period Mean (complement) [1] |
Benchmark Period Mean (complement) [1] |
Bias [1] |
Phase Shift [months] |
Bias Score [1] |
Seasonal Cycle Score [1] |
Spatial Distribution Score [1] |
Overall Score [1] |
|||
|---|---|---|---|---|---|---|---|---|---|---|---|---|---|---|
| Benchmark | [-] | 0.476 | ||||||||||||
| CLM50 | [-] | 0.490 | 0.485 | 0.478 | 0.522 | 0.459 | 0.00697 | 1.72 | 0.573 | 0.757 | 0.956 | 0.762 | ||
| CTSM51 | [-] | 0.493 | 0.488 | 0.478 | 0.522 | 0.459 | 0.0101 | 1.72 | 0.541 | 0.763 | 0.944 | 0.750 | ||
| DeadVeg | [-] | 0.483 | 0.476 | 0.477 | 0.533 | 0.455 | 0.000232 | 1.73 | 0.534 | 0.774 | 0.975 | 0.761 |
Download Data |
Period Mean (original grids) [1] |
Model Period Mean (intersection) [1] |
Benchmark Period Mean (intersection) [1] |
Model Period Mean (complement) [1] |
Benchmark Period Mean (complement) [1] |
Bias [1] |
Phase Shift [months] |
Bias Score [1] |
Seasonal Cycle Score [1] |
Spatial Distribution Score [1] |
Overall Score [1] |
|||
|---|---|---|---|---|---|---|---|---|---|---|---|---|---|---|
| Benchmark | [-] | 0.164 | ||||||||||||
| CLM50 | [-] | 0.149 | 0.146 | 0.165 | 0.210 | 0.169 | -0.0202 | 2.41 | 0.526 | 0.607 | 0.913 | 0.682 | ||
| CTSM51 | [-] | 0.150 | 0.147 | 0.165 | 0.212 | 0.169 | -0.0189 | 2.44 | 0.523 | 0.590 | 0.905 | 0.673 | ||
| DeadVeg | [-] | 0.172 | 0.167 | 0.164 | 0.247 | 0.169 | 0.00253 | 2.95 | 0.537 | 0.503 | 0.922 | 0.654 |
Download Data |
Period Mean (original grids) [1] |
Model Period Mean (intersection) [1] |
Benchmark Period Mean (intersection) [1] |
Model Period Mean (complement) [1] |
Benchmark Period Mean (complement) [1] |
Bias [1] |
Phase Shift [months] |
Bias Score [1] |
Seasonal Cycle Score [1] |
Spatial Distribution Score [1] |
Overall Score [1] |
|||
|---|---|---|---|---|---|---|---|---|---|---|---|---|---|---|
| Benchmark | [-] | 0.476 | ||||||||||||
| CLM50 | [-] | 0.542 | 0.564 | 0.476 | 0.473 | 0.407 | 0.0831 | 1.57 | 0.392 | 0.798 | 0.510 | 0.567 | ||
| CTSM51 | [-] | 0.553 | 0.576 | 0.476 | 0.481 | 0.427 | 0.0949 | 1.53 | 0.369 | 0.804 | 0.470 | 0.548 | ||
| DeadVeg | [-] | 0.535 | 0.544 | 0.476 | 0.511 | 0.405 | 0.0675 | 1.48 | 0.450 | 0.813 | 0.632 | 0.632 |
Download Data |
Period Mean (original grids) [1] |
Model Period Mean (intersection) [1] |
Benchmark Period Mean (intersection) [1] |
Model Period Mean (complement) [1] |
Benchmark Period Mean (complement) [1] |
Bias [1] |
Phase Shift [months] |
Bias Score [1] |
Seasonal Cycle Score [1] |
Spatial Distribution Score [1] |
Overall Score [1] |
|||
|---|---|---|---|---|---|---|---|---|---|---|---|---|---|---|
| Benchmark | [-] | 0.499 | ||||||||||||
| CLM50 | [-] | 0.535 | 0.526 | 0.497 | 0.557 | 0.506 | 0.0209 | 1.68 | 0.543 | 0.718 | 0.945 | 0.735 | ||
| CTSM51 | [-] | 0.539 | 0.532 | 0.497 | 0.554 | 0.506 | 0.0250 | 1.63 | 0.540 | 0.729 | 0.945 | 0.738 | ||
| DeadVeg | [-] | 0.515 | 0.508 | 0.499 | 0.531 | 0.505 | 0.00262 | 1.40 | 0.638 | 0.784 | 0.982 | 0.801 |
Download Data |
Period Mean (original grids) [1] |
Model Period Mean (intersection) [1] |
Benchmark Period Mean (intersection) [1] |
Model Period Mean (complement) [1] |
Benchmark Period Mean (complement) [1] |
Bias [1] |
Phase Shift [months] |
Bias Score [1] |
Seasonal Cycle Score [1] |
Spatial Distribution Score [1] |
Overall Score [1] |
|||
|---|---|---|---|---|---|---|---|---|---|---|---|---|---|---|
| Benchmark | [-] | 0.669 | ||||||||||||
| CLM50 | [-] | 0.651 | 0.653 | 0.671 | 0.645 | 0.523 | -0.0162 | 1.22 | 0.634 | 0.853 | 0.995 | 0.827 | ||
| CTSM51 | [-] | 0.649 | 0.652 | 0.671 | 0.639 | 0.523 | -0.0191 | 1.24 | 0.649 | 0.850 | 0.998 | 0.832 | ||
| DeadVeg | [-] | 0.596 | 0.594 | 0.670 | 0.616 | 0.519 | -0.0744 | 1.72 | 0.464 | 0.753 | 0.985 | 0.734 |
Download Data |
Period Mean (original grids) [1] |
Model Period Mean (intersection) [1] |
Benchmark Period Mean (intersection) [1] |
Model Period Mean (complement) [1] |
Benchmark Period Mean (complement) [1] |
Bias [1] |
Phase Shift [months] |
Bias Score [1] |
Seasonal Cycle Score [1] |
Spatial Distribution Score [1] |
Overall Score [1] |
|||
|---|---|---|---|---|---|---|---|---|---|---|---|---|---|---|
| Benchmark | [-] | 0.546 | ||||||||||||
| CLM50 | [-] | 0.563 | 0.567 | 0.547 | 0.535 | 0.443 | 0.0211 | 1.29 | 0.618 | 0.832 | 0.934 | 0.795 | ||
| CTSM51 | [-] | 0.574 | 0.578 | 0.547 | 0.546 | 0.438 | 0.0311 | 1.30 | 0.630 | 0.827 | 0.947 | 0.801 | ||
| DeadVeg | [-] | 0.508 | 0.506 | 0.546 | 0.541 | 0.446 | -0.0381 | 1.58 | 0.585 | 0.768 | 0.957 | 0.770 |
Download Data |
Period Mean (original grids) [1] |
Model Period Mean (intersection) [1] |
Benchmark Period Mean (intersection) [1] |
Model Period Mean (complement) [1] |
Benchmark Period Mean (complement) [1] |
Bias [1] |
Phase Shift [months] |
Bias Score [1] |
Seasonal Cycle Score [1] |
Spatial Distribution Score [1] |
Overall Score [1] |
|||
|---|---|---|---|---|---|---|---|---|---|---|---|---|---|---|
| Benchmark | [-] | 0.429 | ||||||||||||
| CLM50 | [-] | 0.369 | 0.374 | 0.429 | 0.361 | 0.426 | -0.0530 | 1.81 | 0.557 | 0.744 | 0.968 | 0.756 | ||
| CTSM51 | [-] | 0.377 | 0.382 | 0.429 | 0.379 | 0.426 | -0.0449 | 1.95 | 0.575 | 0.716 | 0.970 | 0.754 | ||
| DeadVeg | [-] | 0.389 | 0.392 | 0.429 | 0.413 | 0.423 | -0.0351 | 2.06 | 0.591 | 0.701 | 0.988 | 0.760 |
Download Data |
Period Mean (original grids) [1] |
Model Period Mean (intersection) [1] |
Benchmark Period Mean (intersection) [1] |
Model Period Mean (complement) [1] |
Benchmark Period Mean (complement) [1] |
Bias [1] |
Phase Shift [months] |
Bias Score [1] |
Seasonal Cycle Score [1] |
Spatial Distribution Score [1] |
Overall Score [1] |
|||
|---|---|---|---|---|---|---|---|---|---|---|---|---|---|---|
| Benchmark | [-] | 0.729 | ||||||||||||
| CLM50 | [-] | 0.772 | 0.776 | 0.732 | 0.687 | 0.590 | 0.0442 | 2.26 | 0.458 | 0.653 | 0.851 | 0.654 | ||
| CTSM51 | [-] | 0.800 | 0.807 | 0.732 | 0.682 | 0.590 | 0.0756 | 2.10 | 0.266 | 0.685 | 0.704 | 0.552 | ||
| DeadVeg | [-] | 0.778 | 0.784 | 0.729 | 0.684 | 0.590 | 0.0552 | 1.63 | 0.328 | 0.771 | 0.760 | 0.620 |
Download Data |
Period Mean (original grids) [1] |
Model Period Mean (intersection) [1] |
Benchmark Period Mean (intersection) [1] |
Model Period Mean (complement) [1] |
Benchmark Period Mean (complement) [1] |
Bias [1] |
Phase Shift [months] |
Bias Score [1] |
Seasonal Cycle Score [1] |
Spatial Distribution Score [1] |
Overall Score [1] |
|||
|---|---|---|---|---|---|---|---|---|---|---|---|---|---|---|
| Benchmark | [-] | 0.615 | ||||||||||||
| CLM50 | [-] | 0.609 | 0.606 | 0.616 | 0.641 | 0.625 | -0.0122 | 1.91 | 0.661 | 0.703 | 0.828 | 0.731 | ||
| CTSM51 | [-] | 0.596 | 0.593 | 0.616 | 0.623 | 0.625 | -0.0250 | 1.65 | 0.646 | 0.760 | 0.856 | 0.754 | ||
| DeadVeg | [-] | 0.580 | 0.578 | 0.615 | 0.600 | 0.625 | -0.0381 | 1.89 | 0.597 | 0.713 | 0.866 | 0.725 |
Download Data |
Period Mean (original grids) [1] |
Model Period Mean (intersection) [1] |
Benchmark Period Mean (intersection) [1] |
Model Period Mean (complement) [1] |
Benchmark Period Mean (complement) [1] |
Bias [1] |
Phase Shift [months] |
Bias Score [1] |
Seasonal Cycle Score [1] |
Spatial Distribution Score [1] |
Overall Score [1] |
|||
|---|---|---|---|---|---|---|---|---|---|---|---|---|---|---|
| Benchmark | [-] | 0.374 | ||||||||||||
| CLM50 | [-] | 0.313 | 0.324 | 0.374 | 0.271 | 0.318 | -0.0424 | 1.86 | 0.343 | 0.731 | 0.550 | 0.542 | ||
| CTSM51 | [-] | 0.322 | 0.334 | 0.374 | 0.279 | 0.318 | -0.0322 | 1.98 | 0.332 | 0.716 | 0.514 | 0.521 | ||
| DeadVeg | [-] | 0.290 | 0.299 | 0.375 | 0.239 | 0.316 | -0.0707 | 1.85 | 0.372 | 0.746 | 0.705 | 0.607 |
Temporally integrated period mean