Mean State
Download Data |
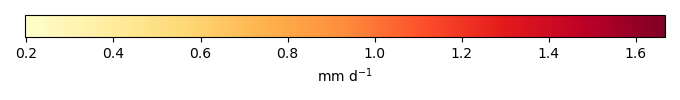
Period Mean (original grids) [mm d-1] |
Model Period Mean (intersection) [mm d-1] |
Benchmark Period Mean (intersection) [mm d-1] |
Model Period Mean (complement) [mm d-1] |
Benchmark Period Mean (complement) [mm d-1] |
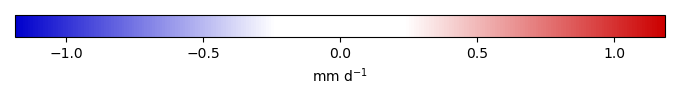
Bias [mm d-1] |
RMSE [mm d-1] |
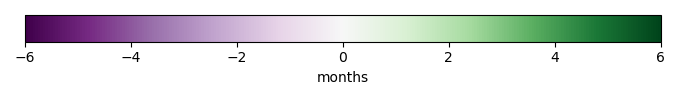
Phase Shift [months] |
Bias Score [1] |
RMSE Score [1] |
Seasonal Cycle Score [1] |
Spatial Distribution Score [1] |
Overall Score [1] |
|||
|---|---|---|---|---|---|---|---|---|---|---|---|---|---|---|---|---|
| Benchmark | [-] | 2.48 | ||||||||||||||
| CLM50 | [-] | 2.50 | 2.54 | 2.48 | 1.71 | 2.68 | 0.0449 | 0.725 | 3.04 | 0.580 | 0.594 | 0.495 | 0.974 | 0.647 | ||
| CTSM51 | [-] | 2.47 | 2.51 | 2.48 | 1.66 | 2.68 | 0.0132 | 0.715 | 2.98 | 0.580 | 0.604 | 0.504 | 0.972 | 0.653 | ||
| DeadVeg | [-] | 2.50 | 2.54 | 2.48 | 1.57 | 2.68 | 0.0457 | 0.665 | 2.67 | 0.595 | 0.635 | 0.562 | 0.976 | 0.680 |
Download Data |
Period Mean (original grids) [mm d-1] |
Model Period Mean (intersection) [mm d-1] |
Benchmark Period Mean (intersection) [mm d-1] |
Model Period Mean (complement) [mm d-1] |
Benchmark Period Mean (complement) [mm d-1] |
Bias [mm d-1] |
RMSE [mm d-1] |
Phase Shift [months] |
Bias Score [1] |
RMSE Score [1] |
Seasonal Cycle Score [1] |
Spatial Distribution Score [1] |
Overall Score [1] |
|||
|---|---|---|---|---|---|---|---|---|---|---|---|---|---|---|---|---|
| Benchmark | [-] | 1.21 | ||||||||||||||
| CLM50 | [-] | 1.63 | 1.63 | 1.21 | 0.742 | 2.59 | 0.423 | 1.01 | 1.38 | 0.333 | 0.424 | 0.808 | 0.824 | 0.563 | ||
| CTSM51 | [-] | 1.58 | 1.58 | 1.21 | 0.730 | 2.59 | 0.374 | 1.02 | 1.37 | 0.330 | 0.424 | 0.810 | 0.797 | 0.557 | ||
| DeadVeg | [-] | 1.61 | 1.62 | 1.21 | 0.685 | 2.59 | 0.407 | 0.994 | 1.17 | 0.323 | 0.473 | 0.842 | 0.839 | 0.590 |
Download Data |
Period Mean (original grids) [mm d-1] |
Model Period Mean (intersection) [mm d-1] |
Benchmark Period Mean (intersection) [mm d-1] |
Model Period Mean (complement) [mm d-1] |
Benchmark Period Mean (complement) [mm d-1] |
Bias [mm d-1] |
RMSE [mm d-1] |
Phase Shift [months] |
Bias Score [1] |
RMSE Score [1] |
Seasonal Cycle Score [1] |
Spatial Distribution Score [1] |
Overall Score [1] |
|||
|---|---|---|---|---|---|---|---|---|---|---|---|---|---|---|---|---|
| Benchmark | [-] | 1.66 | ||||||||||||||
| CLM50 | [-] | 1.78 | 1.77 | 1.66 | 1.76 | 2.05 | 0.125 | 0.865 | 1.74 | 0.507 | 0.472 | 0.762 | 0.933 | 0.629 | ||
| CTSM51 | [-] | 1.67 | 1.67 | 1.66 | 1.69 | 2.05 | 0.0157 | 0.853 | 1.72 | 0.499 | 0.492 | 0.766 | 0.904 | 0.631 | ||
| DeadVeg | [-] | 1.65 | 1.65 | 1.66 | 1.71 | 2.05 | 0.000628 | 0.793 | 1.47 | 0.537 | 0.508 | 0.814 | 0.936 | 0.661 |
Download Data |
Period Mean (original grids) [mm d-1] |
Model Period Mean (intersection) [mm d-1] |
Benchmark Period Mean (intersection) [mm d-1] |
Model Period Mean (complement) [mm d-1] |
Benchmark Period Mean (complement) [mm d-1] |
Bias [mm d-1] |
RMSE [mm d-1] |
Phase Shift [months] |
Bias Score [1] |
RMSE Score [1] |
Seasonal Cycle Score [1] |
Spatial Distribution Score [1] |
Overall Score [1] |
|||
|---|---|---|---|---|---|---|---|---|---|---|---|---|---|---|---|---|
| Benchmark | [-] | 0.854 | ||||||||||||||
| CLM50 | [-] | 0.524 | 0.534 | 0.854 | 0.386 | 1.06 | -0.327 | 0.531 | 0.372 | 0.162 | 0.233 | 0.974 | 0.969 | 0.514 | ||
| CTSM51 | [-] | 0.491 | 0.499 | 0.854 | 0.373 | 1.06 | -0.359 | 0.577 | 0.354 | 0.144 | 0.187 | 0.976 | 0.967 | 0.492 | ||
| DeadVeg | [-] | 0.558 | 0.564 | 0.854 | 0.468 | 1.06 | -0.292 | 0.423 | 0.527 | 0.137 | 0.423 | 0.964 | 0.956 | 0.581 |
Download Data |
Period Mean (original grids) [mm d-1] |
Model Period Mean (intersection) [mm d-1] |
Benchmark Period Mean (intersection) [mm d-1] |
Model Period Mean (complement) [mm d-1] |
Benchmark Period Mean (complement) [mm d-1] |
Bias [mm d-1] |
RMSE [mm d-1] |
Phase Shift [months] |
Bias Score [1] |
RMSE Score [1] |
Seasonal Cycle Score [1] |
Spatial Distribution Score [1] |
Overall Score [1] |
|||
|---|---|---|---|---|---|---|---|---|---|---|---|---|---|---|---|---|
| Benchmark | [-] | 3.76 | ||||||||||||||
| CLM50 | [-] | 3.44 | 3.41 | 3.76 | 3.57 | 3.92 | -0.314 | 0.509 | 2.62 | 0.510 | 0.754 | 0.578 | 0.974 | 0.714 | ||
| CTSM51 | [-] | 3.44 | 3.41 | 3.76 | 3.53 | 3.92 | -0.317 | 0.511 | 2.59 | 0.506 | 0.762 | 0.583 | 0.933 | 0.709 | ||
| DeadVeg | [-] | 3.62 | 3.62 | 3.76 | 3.59 | 3.92 | -0.142 | 0.624 | 2.97 | 0.498 | 0.643 | 0.509 | 0.691 | 0.597 |
Download Data |
Period Mean (original grids) [mm d-1] |
Model Period Mean (intersection) [mm d-1] |
Benchmark Period Mean (intersection) [mm d-1] |
Model Period Mean (complement) [mm d-1] |
Benchmark Period Mean (complement) [mm d-1] |
Bias [mm d-1] |
RMSE [mm d-1] |
Phase Shift [months] |
Bias Score [1] |
RMSE Score [1] |
Seasonal Cycle Score [1] |
Spatial Distribution Score [1] |
Overall Score [1] |
|||
|---|---|---|---|---|---|---|---|---|---|---|---|---|---|---|---|---|
| Benchmark | [-] | 1.12 | ||||||||||||||
| CLM50 | [-] | 0.883 | 0.881 | 1.11 | 0.864 | 1.40 | -0.233 | 0.445 | 0.494 | 0.316 | 0.393 | 0.967 | 0.899 | 0.594 | ||
| CTSM51 | [-] | 0.881 | 0.880 | 1.11 | 0.827 | 1.40 | -0.235 | 0.427 | 0.498 | 0.287 | 0.425 | 0.966 | 0.958 | 0.612 | ||
| DeadVeg | [-] | 0.860 | 0.857 | 1.11 | 0.851 | 1.40 | -0.258 | 0.429 | 0.718 | 0.220 | 0.440 | 0.952 | 0.994 | 0.609 |
Download Data |
Period Mean (original grids) [mm d-1] |
Model Period Mean (intersection) [mm d-1] |
Benchmark Period Mean (intersection) [mm d-1] |
Model Period Mean (complement) [mm d-1] |
Benchmark Period Mean (complement) [mm d-1] |
Bias [mm d-1] |
RMSE [mm d-1] |
Phase Shift [months] |
Bias Score [1] |
RMSE Score [1] |
Seasonal Cycle Score [1] |
Spatial Distribution Score [1] |
Overall Score [1] |
|||
|---|---|---|---|---|---|---|---|---|---|---|---|---|---|---|---|---|
| Benchmark | [-] | 1.17 | ||||||||||||||
| CLM50 | [-] | 0.959 | 1.05 | 1.17 | 0.549 | 1.94 | -0.102 | 0.665 | 1.42 | 0.551 | 0.350 | 0.795 | 0.926 | 0.594 | ||
| CTSM51 | [-] | 0.942 | 1.03 | 1.17 | 0.537 | 1.94 | -0.123 | 0.681 | 1.45 | 0.527 | 0.347 | 0.788 | 0.896 | 0.581 | ||
| DeadVeg | [-] | 0.982 | 1.07 | 1.17 | 0.593 | 1.94 | -0.0867 | 0.684 | 1.55 | 0.550 | 0.319 | 0.769 | 0.915 | 0.574 |
Download Data |
Period Mean (original grids) [mm d-1] |
Model Period Mean (intersection) [mm d-1] |
Benchmark Period Mean (intersection) [mm d-1] |
Model Period Mean (complement) [mm d-1] |
Benchmark Period Mean (complement) [mm d-1] |
Bias [mm d-1] |
RMSE [mm d-1] |
Phase Shift [months] |
Bias Score [1] |
RMSE Score [1] |
Seasonal Cycle Score [1] |
Spatial Distribution Score [1] |
Overall Score [1] |
|||
|---|---|---|---|---|---|---|---|---|---|---|---|---|---|---|---|---|
| Benchmark | [-] | 2.11 | ||||||||||||||
| CLM50 | [-] | 2.04 | 2.09 | 2.10 | 1.55 | 3.39 | 0.0547 | 1.02 | 2.40 | 0.452 | 0.379 | 0.625 | 0.855 | 0.538 | ||
| CTSM51 | [-] | 1.95 | 2.00 | 2.10 | 1.49 | 3.39 | -0.0364 | 0.980 | 2.29 | 0.450 | 0.411 | 0.646 | 0.820 | 0.547 | ||
| DeadVeg | [-] | 1.98 | 2.05 | 2.10 | 1.44 | 3.39 | 0.00123 | 0.978 | 2.20 | 0.467 | 0.386 | 0.663 | 0.814 | 0.543 |
Download Data |
Period Mean (original grids) [mm d-1] |
Model Period Mean (intersection) [mm d-1] |
Benchmark Period Mean (intersection) [mm d-1] |
Model Period Mean (complement) [mm d-1] |
Benchmark Period Mean (complement) [mm d-1] |
Bias [mm d-1] |
RMSE [mm d-1] |
Phase Shift [months] |
Bias Score [1] |
RMSE Score [1] |
Seasonal Cycle Score [1] |
Spatial Distribution Score [1] |
Overall Score [1] |
|||
|---|---|---|---|---|---|---|---|---|---|---|---|---|---|---|---|---|
| Benchmark | [-] | 0.786 | ||||||||||||||
| CLM50 | [-] | 0.569 | 0.603 | 0.786 | 0.307 | 0.745 | -0.186 | 0.496 | 0.420 | 0.348 | 0.171 | 0.972 | 0.963 | 0.525 | ||
| CTSM51 | [-] | 0.522 | 0.554 | 0.786 | 0.269 | 0.745 | -0.235 | 0.524 | 0.344 | 0.214 | 0.153 | 0.977 | 0.951 | 0.490 | ||
| DeadVeg | [-] | 0.559 | 0.587 | 0.786 | 0.338 | 0.745 | -0.201 | 0.351 | 0.476 | 0.283 | 0.463 | 0.968 | 0.990 | 0.633 |
Download Data |
Period Mean (original grids) [mm d-1] |
Model Period Mean (intersection) [mm d-1] |
Benchmark Period Mean (intersection) [mm d-1] |
Model Period Mean (complement) [mm d-1] |
Benchmark Period Mean (complement) [mm d-1] |
Bias [mm d-1] |
RMSE [mm d-1] |
Phase Shift [months] |
Bias Score [1] |
RMSE Score [1] |
Seasonal Cycle Score [1] |
Spatial Distribution Score [1] |
Overall Score [1] |
|||
|---|---|---|---|---|---|---|---|---|---|---|---|---|---|---|---|---|
| Benchmark | [-] | 0.785 | ||||||||||||||
| CLM50 | [-] | 1.19 | 1.14 | 0.778 | 2.02 | 2.20 | 0.411 | 0.633 | 2.07 | 0.464 | 0.635 | 0.682 | 0.957 | 0.675 | ||
| CTSM51 | [-] | 1.17 | 1.13 | 0.778 | 1.89 | 2.20 | 0.396 | 0.637 | 2.00 | 0.458 | 0.641 | 0.690 | 0.922 | 0.670 | ||
| DeadVeg | [-] | 1.17 | 1.13 | 0.778 | 1.94 | 2.20 | 0.393 | 0.648 | 1.89 | 0.466 | 0.609 | 0.709 | 0.943 | 0.667 |
Download Data |
Period Mean (original grids) [mm d-1] |
Model Period Mean (intersection) [mm d-1] |
Benchmark Period Mean (intersection) [mm d-1] |
Model Period Mean (complement) [mm d-1] |
Benchmark Period Mean (complement) [mm d-1] |
Bias [mm d-1] |
RMSE [mm d-1] |
Phase Shift [months] |
Bias Score [1] |
RMSE Score [1] |
Seasonal Cycle Score [1] |
Spatial Distribution Score [1] |
Overall Score [1] |
|||
|---|---|---|---|---|---|---|---|---|---|---|---|---|---|---|---|---|
| Benchmark | [-] | 1.32 | ||||||||||||||
| CLM50 | [-] | 1.19 | 1.19 | 1.32 | 1.16 | 1.44 | -0.119 | 0.472 | 0.291 | 0.528 | 0.549 | 0.980 | 0.977 | 0.717 | ||
| CTSM51 | [-] | 1.15 | 1.16 | 1.32 | 1.14 | 1.44 | -0.155 | 0.487 | 0.414 | 0.462 | 0.567 | 0.971 | 0.965 | 0.706 | ||
| DeadVeg | [-] | 1.18 | 1.18 | 1.32 | 1.14 | 1.44 | -0.133 | 0.485 | 0.370 | 0.515 | 0.539 | 0.975 | 0.989 | 0.711 |
Download Data |
Period Mean (original grids) [mm d-1] |
Model Period Mean (intersection) [mm d-1] |
Benchmark Period Mean (intersection) [mm d-1] |
Model Period Mean (complement) [mm d-1] |
Benchmark Period Mean (complement) [mm d-1] |
Bias [mm d-1] |
RMSE [mm d-1] |
Phase Shift [months] |
Bias Score [1] |
RMSE Score [1] |
Seasonal Cycle Score [1] |
Spatial Distribution Score [1] |
Overall Score [1] |
|||
|---|---|---|---|---|---|---|---|---|---|---|---|---|---|---|---|---|
| Benchmark | [-] | 1.56 | ||||||||||||||
| CLM50 | [-] | 1.20 | 1.53 | 1.56 | 0.301 | 2.44 | -0.00429 | 0.686 | 1.42 | 0.458 | 0.447 | 0.799 | 0.973 | 0.625 | ||
| CTSM51 | [-] | 1.17 | 1.49 | 1.56 | 0.293 | 2.44 | -0.0455 | 0.684 | 1.41 | 0.438 | 0.459 | 0.802 | 0.968 | 0.625 | ||
| DeadVeg | [-] | 1.14 | 1.50 | 1.56 | 0.151 | 2.44 | -0.0395 | 0.676 | 1.49 | 0.445 | 0.469 | 0.793 | 0.968 | 0.629 |
Download Data |
Period Mean (original grids) [mm d-1] |
Model Period Mean (intersection) [mm d-1] |
Benchmark Period Mean (intersection) [mm d-1] |
Model Period Mean (complement) [mm d-1] |
Benchmark Period Mean (complement) [mm d-1] |
Bias [mm d-1] |
RMSE [mm d-1] |
Phase Shift [months] |
Bias Score [1] |
RMSE Score [1] |
Seasonal Cycle Score [1] |
Spatial Distribution Score [1] |
Overall Score [1] |
|||
|---|---|---|---|---|---|---|---|---|---|---|---|---|---|---|---|---|
| Benchmark | [-] | 0.604 | ||||||||||||||
| CLM50 | [-] | 0.304 | 0.833 | 0.605 | 0.177 | 0.431 | 0.233 | 0.750 | 1.88 | 0.534 | 0.353 | 0.719 | 0.948 | 0.581 | ||
| CTSM51 | [-] | 0.306 | 0.841 | 0.605 | 0.177 | 0.431 | 0.241 | 0.774 | 2.03 | 0.525 | 0.339 | 0.694 | 0.948 | 0.569 | ||
| DeadVeg | [-] | 0.339 | 0.886 | 0.605 | 0.206 | 0.431 | 0.288 | 0.833 | 2.18 | 0.503 | 0.288 | 0.667 | 0.957 | 0.540 |
Download Data |
Period Mean (original grids) [mm d-1] |
Model Period Mean (intersection) [mm d-1] |
Benchmark Period Mean (intersection) [mm d-1] |
Model Period Mean (complement) [mm d-1] |
Benchmark Period Mean (complement) [mm d-1] |
Bias [mm d-1] |
RMSE [mm d-1] |
Phase Shift [months] |
Bias Score [1] |
RMSE Score [1] |
Seasonal Cycle Score [1] |
Spatial Distribution Score [1] |
Overall Score [1] |
|||
|---|---|---|---|---|---|---|---|---|---|---|---|---|---|---|---|---|
| Benchmark | [-] | 0.875 | ||||||||||||||
| CLM50 | [-] | 0.542 | 0.642 | 0.874 | 0.282 | 1.05 | -0.237 | 0.518 | 0.502 | 0.273 | 0.229 | 0.966 | 0.940 | 0.527 | ||
| CTSM51 | [-] | 0.515 | 0.608 | 0.874 | 0.275 | 1.05 | -0.271 | 0.534 | 0.547 | 0.231 | 0.225 | 0.963 | 0.962 | 0.521 | ||
| DeadVeg | [-] | 0.590 | 0.687 | 0.874 | 0.342 | 1.05 | -0.186 | 0.402 | 0.646 | 0.375 | 0.383 | 0.956 | 0.901 | 0.600 |
Download Data |
Period Mean (original grids) [mm d-1] |
Model Period Mean (intersection) [mm d-1] |
Benchmark Period Mean (intersection) [mm d-1] |
Model Period Mean (complement) [mm d-1] |
Benchmark Period Mean (complement) [mm d-1] |
Bias [mm d-1] |
RMSE [mm d-1] |
Phase Shift [months] |
Bias Score [1] |
RMSE Score [1] |
Seasonal Cycle Score [1] |
Spatial Distribution Score [1] |
Overall Score [1] |
|||
|---|---|---|---|---|---|---|---|---|---|---|---|---|---|---|---|---|
| Benchmark | [-] | 2.13 | ||||||||||||||
| CLM50 | [-] | 2.01 | 2.00 | 2.13 | 2.15 | 2.79 | -0.0271 | 0.662 | 1.51 | 0.558 | 0.607 | 0.793 | 0.957 | 0.704 | ||
| CTSM51 | [-] | 1.97 | 1.96 | 2.13 | 2.09 | 2.79 | -0.0744 | 0.659 | 1.50 | 0.550 | 0.619 | 0.796 | 0.946 | 0.706 | ||
| DeadVeg | [-] | 1.92 | 1.92 | 2.13 | 1.98 | 2.79 | -0.126 | 0.699 | 1.74 | 0.560 | 0.563 | 0.763 | 0.961 | 0.682 |
Download Data |
Period Mean (original grids) [mm d-1] |
Model Period Mean (intersection) [mm d-1] |
Benchmark Period Mean (intersection) [mm d-1] |
Model Period Mean (complement) [mm d-1] |
Benchmark Period Mean (complement) [mm d-1] |
Bias [mm d-1] |
RMSE [mm d-1] |
Phase Shift [months] |
Bias Score [1] |
RMSE Score [1] |
Seasonal Cycle Score [1] |
Spatial Distribution Score [1] |
Overall Score [1] |
|||
|---|---|---|---|---|---|---|---|---|---|---|---|---|---|---|---|---|
| Benchmark | [-] | 1.88 | ||||||||||||||
| CLM50 | [-] | 1.84 | 1.84 | 1.88 | 1.90 | 2.11 | -0.0106 | 0.494 | 0.516 | 0.607 | 0.480 | 0.957 | 0.992 | 0.703 | ||
| CTSM51 | [-] | 1.77 | 1.77 | 1.88 | 1.85 | 2.11 | -0.0861 | 0.496 | 0.505 | 0.516 | 0.509 | 0.959 | 0.991 | 0.697 | ||
| DeadVeg | [-] | 1.65 | 1.64 | 1.88 | 1.76 | 2.11 | -0.221 | 0.576 | 0.796 | 0.408 | 0.443 | 0.942 | 0.880 | 0.623 |
Download Data |
Period Mean (original grids) [mm d-1] |
Model Period Mean (intersection) [mm d-1] |
Benchmark Period Mean (intersection) [mm d-1] |
Model Period Mean (complement) [mm d-1] |
Benchmark Period Mean (complement) [mm d-1] |
Bias [mm d-1] |
RMSE [mm d-1] |
Phase Shift [months] |
Bias Score [1] |
RMSE Score [1] |
Seasonal Cycle Score [1] |
Spatial Distribution Score [1] |
Overall Score [1] |
|||
|---|---|---|---|---|---|---|---|---|---|---|---|---|---|---|---|---|
| Benchmark | [-] | 1.13 | ||||||||||||||
| CLM50 | [-] | 1.07 | 1.07 | 1.13 | 1.14 | 1.29 | -0.0604 | 0.489 | 0.151 | 0.566 | 0.331 | 0.990 | 0.987 | 0.641 | ||
| CTSM51 | [-] | 1.03 | 1.03 | 1.13 | 1.11 | 1.29 | -0.0993 | 0.465 | 0.132 | 0.560 | 0.385 | 0.991 | 0.990 | 0.662 | ||
| DeadVeg | [-] | 1.04 | 1.03 | 1.13 | 1.25 | 1.29 | -0.0953 | 0.412 | 0.464 | 0.599 | 0.449 | 0.969 | 0.933 | 0.680 |
Download Data |
Period Mean (original grids) [mm d-1] |
Model Period Mean (intersection) [mm d-1] |
Benchmark Period Mean (intersection) [mm d-1] |
Model Period Mean (complement) [mm d-1] |
Benchmark Period Mean (complement) [mm d-1] |
Bias [mm d-1] |
RMSE [mm d-1] |
Phase Shift [months] |
Bias Score [1] |
RMSE Score [1] |
Seasonal Cycle Score [1] |
Spatial Distribution Score [1] |
Overall Score [1] |
|||
|---|---|---|---|---|---|---|---|---|---|---|---|---|---|---|---|---|
| Benchmark | [-] | 0.788 | ||||||||||||||
| CLM50 | [-] | 0.887 | 0.902 | 0.787 | 0.913 | 1.93 | 0.124 | 0.676 | 1.63 | 0.573 | 0.377 | 0.748 | 0.962 | 0.608 | ||
| CTSM51 | [-] | 0.904 | 0.918 | 0.787 | 0.943 | 1.93 | 0.139 | 0.675 | 1.71 | 0.576 | 0.375 | 0.730 | 0.969 | 0.605 | ||
| DeadVeg | [-] | 0.887 | 0.899 | 0.787 | 0.945 | 1.93 | 0.120 | 0.649 | 1.85 | 0.625 | 0.380 | 0.705 | 0.963 | 0.611 |
Download Data |
Period Mean (original grids) [mm d-1] |
Model Period Mean (intersection) [mm d-1] |
Benchmark Period Mean (intersection) [mm d-1] |
Model Period Mean (complement) [mm d-1] |
Benchmark Period Mean (complement) [mm d-1] |
Bias [mm d-1] |
RMSE [mm d-1] |
Phase Shift [months] |
Bias Score [1] |
RMSE Score [1] |
Seasonal Cycle Score [1] |
Spatial Distribution Score [1] |
Overall Score [1] |
|||
|---|---|---|---|---|---|---|---|---|---|---|---|---|---|---|---|---|
| Benchmark | [-] | 3.62 | ||||||||||||||
| CLM50 | [-] | 3.25 | 3.26 | 3.62 | 3.03 | 3.15 | -0.366 | 0.664 | 2.04 | 0.487 | 0.677 | 0.703 | 0.917 | 0.692 | ||
| CTSM51 | [-] | 3.20 | 3.20 | 3.62 | 2.92 | 3.15 | -0.423 | 0.651 | 1.89 | 0.473 | 0.702 | 0.732 | 0.961 | 0.714 | ||
| DeadVeg | [-] | 3.15 | 3.16 | 3.62 | 2.90 | 3.15 | -0.467 | 0.769 | 2.34 | 0.397 | 0.642 | 0.647 | 0.990 | 0.664 |
Download Data |
Period Mean (original grids) [mm d-1] |
Model Period Mean (intersection) [mm d-1] |
Benchmark Period Mean (intersection) [mm d-1] |
Model Period Mean (complement) [mm d-1] |
Benchmark Period Mean (complement) [mm d-1] |
Bias [mm d-1] |
RMSE [mm d-1] |
Phase Shift [months] |
Bias Score [1] |
RMSE Score [1] |
Seasonal Cycle Score [1] |
Spatial Distribution Score [1] |
Overall Score [1] |
|||
|---|---|---|---|---|---|---|---|---|---|---|---|---|---|---|---|---|
| Benchmark | [-] | 1.97 | ||||||||||||||
| CLM50 | [-] | 2.29 | 2.27 | 1.97 | 2.55 | 2.09 | 0.309 | 1.04 | 1.67 | 0.318 | 0.431 | 0.776 | 0.836 | 0.559 | ||
| CTSM51 | [-] | 2.20 | 2.19 | 1.97 | 2.44 | 2.09 | 0.220 | 0.991 | 1.63 | 0.339 | 0.458 | 0.786 | 0.791 | 0.567 | ||
| DeadVeg | [-] | 2.13 | 2.12 | 1.97 | 2.27 | 2.09 | 0.149 | 0.969 | 1.82 | 0.347 | 0.455 | 0.752 | 0.808 | 0.563 |
Download Data |
Period Mean (original grids) [mm d-1] |
Model Period Mean (intersection) [mm d-1] |
Benchmark Period Mean (intersection) [mm d-1] |
Model Period Mean (complement) [mm d-1] |
Benchmark Period Mean (complement) [mm d-1] |
Bias [mm d-1] |
RMSE [mm d-1] |
Phase Shift [months] |
Bias Score [1] |
RMSE Score [1] |
Seasonal Cycle Score [1] |
Spatial Distribution Score [1] |
Overall Score [1] |
|||
|---|---|---|---|---|---|---|---|---|---|---|---|---|---|---|---|---|
| Benchmark | [-] | 1.18 | ||||||||||||||
| CLM50 | [-] | 0.973 | 1.09 | 1.17 | 0.466 | 1.34 | -0.0799 | 0.631 | 1.73 | 0.432 | 0.524 | 0.749 | 0.919 | 0.630 | ||
| CTSM51 | [-] | 0.962 | 1.08 | 1.17 | 0.451 | 1.34 | -0.0896 | 0.641 | 1.82 | 0.417 | 0.526 | 0.730 | 0.911 | 0.622 | ||
| DeadVeg | [-] | 0.934 | 1.04 | 1.17 | 0.479 | 1.34 | -0.104 | 0.673 | 1.92 | 0.412 | 0.526 | 0.714 | 0.943 | 0.624 |
Temporally integrated period mean