Mean State
Download Data |
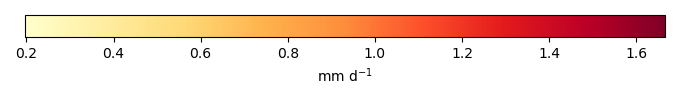
Period Mean (original grids) [mm d-1] |
Model Period Mean (intersection) [mm d-1] |
Benchmark Period Mean (intersection) [mm d-1] |
Model Period Mean (complement) [mm d-1] |
Benchmark Period Mean (complement) [mm d-1] |
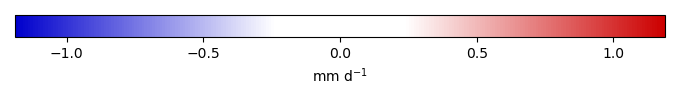
Bias [mm d-1] |
RMSE [mm d-1] |
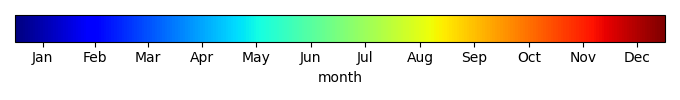
Phase Shift [months] |
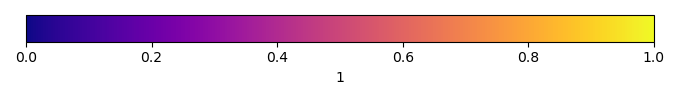
Bias Score [1] |
RMSE Score [1] |
Seasonal Cycle Score [1] |
Spatial Distribution Score [1] |
Overall Score [1] |
|||
|---|---|---|---|---|---|---|---|---|---|---|---|---|---|---|---|---|
| Benchmark | [-] | 2.49 | ||||||||||||||
| CLM50 | [-] | 2.49 | 2.53 | 2.49 | 1.70 | 2.68 | 0.0329 | 0.719 | 2.98 | 0.586 | 0.596 | 0.505 | 0.976 | 0.651 | ||
| CTSM51 | [-] | 2.47 | 2.50 | 2.49 | 1.65 | 2.68 | 0.000612 | 0.709 | 2.95 | 0.586 | 0.605 | 0.509 | 0.973 | 0.656 | ||
| DeadVeg | [-] | 2.50 | 2.54 | 2.49 | 1.57 | 2.68 | 0.0350 | 0.662 | 2.58 | 0.598 | 0.636 | 0.578 | 0.977 | 0.685 |
Download Data |
Period Mean (original grids) [mm d-1] |
Model Period Mean (intersection) [mm d-1] |
Benchmark Period Mean (intersection) [mm d-1] |
Model Period Mean (complement) [mm d-1] |
Benchmark Period Mean (complement) [mm d-1] |
Bias [mm d-1] |
RMSE [mm d-1] |
Phase Shift [months] |
Bias Score [1] |
RMSE Score [1] |
Seasonal Cycle Score [1] |
Spatial Distribution Score [1] |
Overall Score [1] |
|||
|---|---|---|---|---|---|---|---|---|---|---|---|---|---|---|---|---|
| Benchmark | [-] | 1.21 | ||||||||||||||
| CLM50 | [-] | 1.62 | 1.63 | 1.20 | 0.734 | 2.59 | 0.421 | 1.01 | 1.36 | 0.332 | 0.425 | 0.813 | 0.822 | 0.564 | ||
| CTSM51 | [-] | 1.57 | 1.58 | 1.20 | 0.722 | 2.59 | 0.373 | 1.02 | 1.35 | 0.330 | 0.426 | 0.815 | 0.794 | 0.558 | ||
| DeadVeg | [-] | 1.61 | 1.61 | 1.20 | 0.683 | 2.59 | 0.408 | 0.995 | 1.17 | 0.323 | 0.473 | 0.846 | 0.838 | 0.591 |
Download Data |
Period Mean (original grids) [mm d-1] |
Model Period Mean (intersection) [mm d-1] |
Benchmark Period Mean (intersection) [mm d-1] |
Model Period Mean (complement) [mm d-1] |
Benchmark Period Mean (complement) [mm d-1] |
Bias [mm d-1] |
RMSE [mm d-1] |
Phase Shift [months] |
Bias Score [1] |
RMSE Score [1] |
Seasonal Cycle Score [1] |
Spatial Distribution Score [1] |
Overall Score [1] |
|||
|---|---|---|---|---|---|---|---|---|---|---|---|---|---|---|---|---|
| Benchmark | [-] | 1.67 | ||||||||||||||
| CLM50 | [-] | 1.77 | 1.77 | 1.67 | 1.75 | 2.05 | 0.110 | 0.860 | 1.76 | 0.512 | 0.475 | 0.757 | 0.930 | 0.630 | ||
| CTSM51 | [-] | 1.66 | 1.66 | 1.67 | 1.68 | 2.05 | 0.000617 | 0.849 | 1.74 | 0.501 | 0.495 | 0.763 | 0.900 | 0.631 | ||
| DeadVeg | [-] | 1.66 | 1.65 | 1.67 | 1.71 | 2.05 | -0.00791 | 0.790 | 1.46 | 0.537 | 0.511 | 0.816 | 0.933 | 0.662 |
Download Data |
Period Mean (original grids) [mm d-1] |
Model Period Mean (intersection) [mm d-1] |
Benchmark Period Mean (intersection) [mm d-1] |
Model Period Mean (complement) [mm d-1] |
Benchmark Period Mean (complement) [mm d-1] |
Bias [mm d-1] |
RMSE [mm d-1] |
Phase Shift [months] |
Bias Score [1] |
RMSE Score [1] |
Seasonal Cycle Score [1] |
Spatial Distribution Score [1] |
Overall Score [1] |
|||
|---|---|---|---|---|---|---|---|---|---|---|---|---|---|---|---|---|
| Benchmark | [-] | 0.851 | ||||||||||||||
| CLM50 | [-] | 0.525 | 0.535 | 0.851 | 0.386 | 1.06 | -0.323 | 0.526 | 0.377 | 0.167 | 0.238 | 0.974 | 0.970 | 0.517 | ||
| CTSM51 | [-] | 0.492 | 0.500 | 0.851 | 0.374 | 1.06 | -0.355 | 0.572 | 0.354 | 0.148 | 0.193 | 0.976 | 0.968 | 0.495 | ||
| DeadVeg | [-] | 0.557 | 0.563 | 0.851 | 0.466 | 1.06 | -0.290 | 0.420 | 0.508 | 0.139 | 0.426 | 0.966 | 0.957 | 0.583 |
Download Data |
Period Mean (original grids) [mm d-1] |
Model Period Mean (intersection) [mm d-1] |
Benchmark Period Mean (intersection) [mm d-1] |
Model Period Mean (complement) [mm d-1] |
Benchmark Period Mean (complement) [mm d-1] |
Bias [mm d-1] |
RMSE [mm d-1] |
Phase Shift [months] |
Bias Score [1] |
RMSE Score [1] |
Seasonal Cycle Score [1] |
Spatial Distribution Score [1] |
Overall Score [1] |
|||
|---|---|---|---|---|---|---|---|---|---|---|---|---|---|---|---|---|
| Benchmark | [-] | 3.76 | ||||||||||||||
| CLM50 | [-] | 3.44 | 3.41 | 3.75 | 3.57 | 3.91 | -0.310 | 0.507 | 2.70 | 0.511 | 0.753 | 0.557 | 0.977 | 0.710 | ||
| CTSM51 | [-] | 3.44 | 3.41 | 3.75 | 3.52 | 3.91 | -0.314 | 0.511 | 2.67 | 0.505 | 0.761 | 0.565 | 0.937 | 0.706 | ||
| DeadVeg | [-] | 3.62 | 3.63 | 3.75 | 3.59 | 3.91 | -0.134 | 0.620 | 3.01 | 0.500 | 0.646 | 0.496 | 0.697 | 0.597 |
Download Data |
Period Mean (original grids) [mm d-1] |
Model Period Mean (intersection) [mm d-1] |
Benchmark Period Mean (intersection) [mm d-1] |
Model Period Mean (complement) [mm d-1] |
Benchmark Period Mean (complement) [mm d-1] |
Bias [mm d-1] |
RMSE [mm d-1] |
Phase Shift [months] |
Bias Score [1] |
RMSE Score [1] |
Seasonal Cycle Score [1] |
Spatial Distribution Score [1] |
Overall Score [1] |
|||
|---|---|---|---|---|---|---|---|---|---|---|---|---|---|---|---|---|
| Benchmark | [-] | 1.12 | ||||||||||||||
| CLM50 | [-] | 0.883 | 0.881 | 1.12 | 0.861 | 1.40 | -0.234 | 0.446 | 0.480 | 0.314 | 0.394 | 0.968 | 0.894 | 0.593 | ||
| CTSM51 | [-] | 0.880 | 0.879 | 1.12 | 0.824 | 1.40 | -0.237 | 0.427 | 0.500 | 0.283 | 0.426 | 0.966 | 0.954 | 0.611 | ||
| DeadVeg | [-] | 0.858 | 0.856 | 1.12 | 0.849 | 1.40 | -0.261 | 0.429 | 0.696 | 0.215 | 0.442 | 0.953 | 0.995 | 0.610 |
Download Data |
Period Mean (original grids) [mm d-1] |
Model Period Mean (intersection) [mm d-1] |
Benchmark Period Mean (intersection) [mm d-1] |
Model Period Mean (complement) [mm d-1] |
Benchmark Period Mean (complement) [mm d-1] |
Bias [mm d-1] |
RMSE [mm d-1] |
Phase Shift [months] |
Bias Score [1] |
RMSE Score [1] |
Seasonal Cycle Score [1] |
Spatial Distribution Score [1] |
Overall Score [1] |
|||
|---|---|---|---|---|---|---|---|---|---|---|---|---|---|---|---|---|
| Benchmark | [-] | 1.17 | ||||||||||||||
| CLM50 | [-] | 0.959 | 1.05 | 1.17 | 0.549 | 1.94 | -0.103 | 0.666 | 1.43 | 0.551 | 0.349 | 0.794 | 0.925 | 0.594 | ||
| CTSM51 | [-] | 0.942 | 1.03 | 1.17 | 0.538 | 1.94 | -0.124 | 0.683 | 1.46 | 0.526 | 0.346 | 0.788 | 0.895 | 0.580 | ||
| DeadVeg | [-] | 0.981 | 1.07 | 1.17 | 0.594 | 1.94 | -0.0882 | 0.684 | 1.55 | 0.550 | 0.319 | 0.769 | 0.915 | 0.574 |
Download Data |
Period Mean (original grids) [mm d-1] |
Model Period Mean (intersection) [mm d-1] |
Benchmark Period Mean (intersection) [mm d-1] |
Model Period Mean (complement) [mm d-1] |
Benchmark Period Mean (complement) [mm d-1] |
Bias [mm d-1] |
RMSE [mm d-1] |
Phase Shift [months] |
Bias Score [1] |
RMSE Score [1] |
Seasonal Cycle Score [1] |
Spatial Distribution Score [1] |
Overall Score [1] |
|||
|---|---|---|---|---|---|---|---|---|---|---|---|---|---|---|---|---|
| Benchmark | [-] | 2.11 | ||||||||||||||
| CLM50 | [-] | 2.04 | 2.09 | 2.11 | 1.55 | 3.39 | 0.0496 | 1.01 | 2.37 | 0.454 | 0.381 | 0.630 | 0.856 | 0.541 | ||
| CTSM51 | [-] | 1.95 | 2.00 | 2.11 | 1.49 | 3.39 | -0.0416 | 0.976 | 2.24 | 0.453 | 0.413 | 0.657 | 0.821 | 0.551 | ||
| DeadVeg | [-] | 1.98 | 2.05 | 2.11 | 1.44 | 3.39 | -0.000352 | 0.971 | 2.19 | 0.470 | 0.390 | 0.667 | 0.816 | 0.547 |
Download Data |
Period Mean (original grids) [mm d-1] |
Model Period Mean (intersection) [mm d-1] |
Benchmark Period Mean (intersection) [mm d-1] |
Model Period Mean (complement) [mm d-1] |
Benchmark Period Mean (complement) [mm d-1] |
Bias [mm d-1] |
RMSE [mm d-1] |
Phase Shift [months] |
Bias Score [1] |
RMSE Score [1] |
Seasonal Cycle Score [1] |
Spatial Distribution Score [1] |
Overall Score [1] |
|||
|---|---|---|---|---|---|---|---|---|---|---|---|---|---|---|---|---|
| Benchmark | [-] | 0.785 | ||||||||||||||
| CLM50 | [-] | 0.573 | 0.607 | 0.785 | 0.307 | 0.741 | -0.182 | 0.490 | 0.405 | 0.358 | 0.177 | 0.973 | 0.964 | 0.530 | ||
| CTSM51 | [-] | 0.523 | 0.556 | 0.785 | 0.269 | 0.741 | -0.233 | 0.518 | 0.331 | 0.216 | 0.160 | 0.978 | 0.954 | 0.494 | ||
| DeadVeg | [-] | 0.560 | 0.588 | 0.785 | 0.338 | 0.741 | -0.200 | 0.348 | 0.442 | 0.287 | 0.468 | 0.971 | 0.991 | 0.637 |
Download Data |
Period Mean (original grids) [mm d-1] |
Model Period Mean (intersection) [mm d-1] |
Benchmark Period Mean (intersection) [mm d-1] |
Model Period Mean (complement) [mm d-1] |
Benchmark Period Mean (complement) [mm d-1] |
Bias [mm d-1] |
RMSE [mm d-1] |
Phase Shift [months] |
Bias Score [1] |
RMSE Score [1] |
Seasonal Cycle Score [1] |
Spatial Distribution Score [1] |
Overall Score [1] |
|||
|---|---|---|---|---|---|---|---|---|---|---|---|---|---|---|---|---|
| Benchmark | [-] | 0.787 | ||||||||||||||
| CLM50 | [-] | 1.19 | 1.15 | 0.779 | 2.02 | 2.20 | 0.413 | 0.633 | 2.09 | 0.462 | 0.636 | 0.679 | 0.957 | 0.674 | ||
| CTSM51 | [-] | 1.18 | 1.14 | 0.779 | 1.90 | 2.20 | 0.399 | 0.638 | 2.05 | 0.455 | 0.641 | 0.686 | 0.923 | 0.669 | ||
| DeadVeg | [-] | 1.17 | 1.13 | 0.779 | 1.94 | 2.20 | 0.394 | 0.647 | 1.95 | 0.466 | 0.609 | 0.704 | 0.944 | 0.667 |
Download Data |
Period Mean (original grids) [mm d-1] |
Model Period Mean (intersection) [mm d-1] |
Benchmark Period Mean (intersection) [mm d-1] |
Model Period Mean (complement) [mm d-1] |
Benchmark Period Mean (complement) [mm d-1] |
Bias [mm d-1] |
RMSE [mm d-1] |
Phase Shift [months] |
Bias Score [1] |
RMSE Score [1] |
Seasonal Cycle Score [1] |
Spatial Distribution Score [1] |
Overall Score [1] |
|||
|---|---|---|---|---|---|---|---|---|---|---|---|---|---|---|---|---|
| Benchmark | [-] | 1.32 | ||||||||||||||
| CLM50 | [-] | 1.19 | 1.19 | 1.31 | 1.15 | 1.43 | -0.121 | 0.474 | 0.300 | 0.525 | 0.547 | 0.980 | 0.977 | 0.715 | ||
| CTSM51 | [-] | 1.15 | 1.15 | 1.31 | 1.13 | 1.43 | -0.156 | 0.489 | 0.423 | 0.459 | 0.565 | 0.971 | 0.965 | 0.705 | ||
| DeadVeg | [-] | 1.17 | 1.18 | 1.31 | 1.13 | 1.43 | -0.134 | 0.487 | 0.388 | 0.511 | 0.538 | 0.973 | 0.989 | 0.710 |
Download Data |
Period Mean (original grids) [mm d-1] |
Model Period Mean (intersection) [mm d-1] |
Benchmark Period Mean (intersection) [mm d-1] |
Model Period Mean (complement) [mm d-1] |
Benchmark Period Mean (complement) [mm d-1] |
Bias [mm d-1] |
RMSE [mm d-1] |
Phase Shift [months] |
Bias Score [1] |
RMSE Score [1] |
Seasonal Cycle Score [1] |
Spatial Distribution Score [1] |
Overall Score [1] |
|||
|---|---|---|---|---|---|---|---|---|---|---|---|---|---|---|---|---|
| Benchmark | [-] | 1.56 | ||||||||||||||
| CLM50 | [-] | 1.20 | 1.53 | 1.56 | 0.302 | 2.43 | -0.00515 | 0.685 | 1.42 | 0.458 | 0.448 | 0.799 | 0.973 | 0.625 | ||
| CTSM51 | [-] | 1.17 | 1.49 | 1.56 | 0.294 | 2.43 | -0.0465 | 0.683 | 1.41 | 0.438 | 0.459 | 0.802 | 0.968 | 0.625 | ||
| DeadVeg | [-] | 1.14 | 1.50 | 1.56 | 0.152 | 2.43 | -0.0392 | 0.675 | 1.48 | 0.445 | 0.470 | 0.794 | 0.969 | 0.629 |
Download Data |
Period Mean (original grids) [mm d-1] |
Model Period Mean (intersection) [mm d-1] |
Benchmark Period Mean (intersection) [mm d-1] |
Model Period Mean (complement) [mm d-1] |
Benchmark Period Mean (complement) [mm d-1] |
Bias [mm d-1] |
RMSE [mm d-1] |
Phase Shift [months] |
Bias Score [1] |
RMSE Score [1] |
Seasonal Cycle Score [1] |
Spatial Distribution Score [1] |
Overall Score [1] |
|||
|---|---|---|---|---|---|---|---|---|---|---|---|---|---|---|---|---|
| Benchmark | [-] | 0.603 | ||||||||||||||
| CLM50 | [-] | 0.304 | 0.832 | 0.603 | 0.177 | 0.429 | 0.233 | 0.749 | 1.88 | 0.533 | 0.354 | 0.718 | 0.948 | 0.581 | ||
| CTSM51 | [-] | 0.306 | 0.840 | 0.603 | 0.177 | 0.429 | 0.241 | 0.774 | 2.02 | 0.524 | 0.340 | 0.693 | 0.948 | 0.569 | ||
| DeadVeg | [-] | 0.339 | 0.886 | 0.603 | 0.206 | 0.429 | 0.289 | 0.835 | 2.18 | 0.501 | 0.287 | 0.667 | 0.956 | 0.540 |
Download Data |
Period Mean (original grids) [mm d-1] |
Model Period Mean (intersection) [mm d-1] |
Benchmark Period Mean (intersection) [mm d-1] |
Model Period Mean (complement) [mm d-1] |
Benchmark Period Mean (complement) [mm d-1] |
Bias [mm d-1] |
RMSE [mm d-1] |
Phase Shift [months] |
Bias Score [1] |
RMSE Score [1] |
Seasonal Cycle Score [1] |
Spatial Distribution Score [1] |
Overall Score [1] |
|||
|---|---|---|---|---|---|---|---|---|---|---|---|---|---|---|---|---|
| Benchmark | [-] | 0.876 | ||||||||||||||
| CLM50 | [-] | 0.542 | 0.643 | 0.875 | 0.283 | 1.04 | -0.238 | 0.514 | 0.512 | 0.271 | 0.235 | 0.965 | 0.939 | 0.529 | ||
| CTSM51 | [-] | 0.515 | 0.608 | 0.875 | 0.276 | 1.04 | -0.272 | 0.531 | 0.559 | 0.228 | 0.229 | 0.962 | 0.962 | 0.522 | ||
| DeadVeg | [-] | 0.590 | 0.687 | 0.875 | 0.342 | 1.04 | -0.187 | 0.401 | 0.655 | 0.375 | 0.385 | 0.956 | 0.897 | 0.599 |
Download Data |
Period Mean (original grids) [mm d-1] |
Model Period Mean (intersection) [mm d-1] |
Benchmark Period Mean (intersection) [mm d-1] |
Model Period Mean (complement) [mm d-1] |
Benchmark Period Mean (complement) [mm d-1] |
Bias [mm d-1] |
RMSE [mm d-1] |
Phase Shift [months] |
Bias Score [1] |
RMSE Score [1] |
Seasonal Cycle Score [1] |
Spatial Distribution Score [1] |
Overall Score [1] |
|||
|---|---|---|---|---|---|---|---|---|---|---|---|---|---|---|---|---|
| Benchmark | [-] | 2.12 | ||||||||||||||
| CLM50 | [-] | 2.00 | 1.99 | 2.12 | 2.14 | 2.78 | -0.0319 | 0.664 | 1.51 | 0.559 | 0.605 | 0.794 | 0.957 | 0.704 | ||
| CTSM51 | [-] | 1.96 | 1.95 | 2.12 | 2.07 | 2.78 | -0.0804 | 0.660 | 1.52 | 0.552 | 0.617 | 0.792 | 0.946 | 0.705 | ||
| DeadVeg | [-] | 1.91 | 1.91 | 2.12 | 1.98 | 2.78 | -0.126 | 0.699 | 1.70 | 0.562 | 0.562 | 0.771 | 0.962 | 0.684 |
Download Data |
Period Mean (original grids) [mm d-1] |
Model Period Mean (intersection) [mm d-1] |
Benchmark Period Mean (intersection) [mm d-1] |
Model Period Mean (complement) [mm d-1] |
Benchmark Period Mean (complement) [mm d-1] |
Bias [mm d-1] |
RMSE [mm d-1] |
Phase Shift [months] |
Bias Score [1] |
RMSE Score [1] |
Seasonal Cycle Score [1] |
Spatial Distribution Score [1] |
Overall Score [1] |
|||
|---|---|---|---|---|---|---|---|---|---|---|---|---|---|---|---|---|
| Benchmark | [-] | 1.88 | ||||||||||||||
| CLM50 | [-] | 1.85 | 1.85 | 1.88 | 1.91 | 2.11 | -0.00760 | 0.495 | 0.521 | 0.608 | 0.479 | 0.957 | 0.991 | 0.703 | ||
| CTSM51 | [-] | 1.77 | 1.77 | 1.88 | 1.85 | 2.11 | -0.0822 | 0.495 | 0.509 | 0.519 | 0.508 | 0.959 | 0.991 | 0.697 | ||
| DeadVeg | [-] | 1.65 | 1.64 | 1.88 | 1.77 | 2.11 | -0.221 | 0.577 | 0.809 | 0.408 | 0.442 | 0.941 | 0.881 | 0.623 |
Download Data |
Period Mean (original grids) [mm d-1] |
Model Period Mean (intersection) [mm d-1] |
Benchmark Period Mean (intersection) [mm d-1] |
Model Period Mean (complement) [mm d-1] |
Benchmark Period Mean (complement) [mm d-1] |
Bias [mm d-1] |
RMSE [mm d-1] |
Phase Shift [months] |
Bias Score [1] |
RMSE Score [1] |
Seasonal Cycle Score [1] |
Spatial Distribution Score [1] |
Overall Score [1] |
|||
|---|---|---|---|---|---|---|---|---|---|---|---|---|---|---|---|---|
| Benchmark | [-] | 1.14 | ||||||||||||||
| CLM50 | [-] | 1.07 | 1.08 | 1.14 | 1.14 | 1.29 | -0.0582 | 0.488 | 0.156 | 0.567 | 0.332 | 0.989 | 0.990 | 0.642 | ||
| CTSM51 | [-] | 1.04 | 1.04 | 1.14 | 1.11 | 1.29 | -0.0969 | 0.464 | 0.133 | 0.561 | 0.385 | 0.991 | 0.991 | 0.662 | ||
| DeadVeg | [-] | 1.04 | 1.04 | 1.14 | 1.26 | 1.29 | -0.0935 | 0.411 | 0.464 | 0.601 | 0.450 | 0.969 | 0.937 | 0.681 |
Download Data |
Period Mean (original grids) [mm d-1] |
Model Period Mean (intersection) [mm d-1] |
Benchmark Period Mean (intersection) [mm d-1] |
Model Period Mean (complement) [mm d-1] |
Benchmark Period Mean (complement) [mm d-1] |
Bias [mm d-1] |
RMSE [mm d-1] |
Phase Shift [months] |
Bias Score [1] |
RMSE Score [1] |
Seasonal Cycle Score [1] |
Spatial Distribution Score [1] |
Overall Score [1] |
|||
|---|---|---|---|---|---|---|---|---|---|---|---|---|---|---|---|---|
| Benchmark | [-] | 0.787 | ||||||||||||||
| CLM50 | [-] | 0.884 | 0.899 | 0.786 | 0.917 | 1.92 | 0.121 | 0.676 | 1.67 | 0.573 | 0.378 | 0.742 | 0.963 | 0.607 | ||
| CTSM51 | [-] | 0.901 | 0.915 | 0.786 | 0.948 | 1.92 | 0.137 | 0.676 | 1.74 | 0.575 | 0.375 | 0.726 | 0.969 | 0.604 | ||
| DeadVeg | [-] | 0.886 | 0.898 | 0.786 | 0.948 | 1.92 | 0.119 | 0.651 | 1.89 | 0.625 | 0.378 | 0.699 | 0.963 | 0.609 |
Download Data |
Period Mean (original grids) [mm d-1] |
Model Period Mean (intersection) [mm d-1] |
Benchmark Period Mean (intersection) [mm d-1] |
Model Period Mean (complement) [mm d-1] |
Benchmark Period Mean (complement) [mm d-1] |
Bias [mm d-1] |
RMSE [mm d-1] |
Phase Shift [months] |
Bias Score [1] |
RMSE Score [1] |
Seasonal Cycle Score [1] |
Spatial Distribution Score [1] |
Overall Score [1] |
|||
|---|---|---|---|---|---|---|---|---|---|---|---|---|---|---|---|---|
| Benchmark | [-] | 3.61 | ||||||||||||||
| CLM50 | [-] | 3.26 | 3.26 | 3.61 | 3.03 | 3.16 | -0.358 | 0.662 | 2.03 | 0.492 | 0.675 | 0.706 | 0.914 | 0.692 | ||
| CTSM51 | [-] | 3.20 | 3.20 | 3.61 | 2.92 | 3.16 | -0.415 | 0.648 | 1.89 | 0.478 | 0.700 | 0.732 | 0.959 | 0.714 | ||
| DeadVeg | [-] | 3.15 | 3.16 | 3.61 | 2.91 | 3.16 | -0.458 | 0.765 | 2.33 | 0.401 | 0.642 | 0.648 | 0.991 | 0.665 |
Download Data |
Period Mean (original grids) [mm d-1] |
Model Period Mean (intersection) [mm d-1] |
Benchmark Period Mean (intersection) [mm d-1] |
Model Period Mean (complement) [mm d-1] |
Benchmark Period Mean (complement) [mm d-1] |
Bias [mm d-1] |
RMSE [mm d-1] |
Phase Shift [months] |
Bias Score [1] |
RMSE Score [1] |
Seasonal Cycle Score [1] |
Spatial Distribution Score [1] |
Overall Score [1] |
|||
|---|---|---|---|---|---|---|---|---|---|---|---|---|---|---|---|---|
| Benchmark | [-] | 1.96 | ||||||||||||||
| CLM50 | [-] | 2.28 | 2.27 | 1.96 | 2.54 | 2.09 | 0.317 | 1.04 | 1.68 | 0.312 | 0.434 | 0.775 | 0.835 | 0.558 | ||
| CTSM51 | [-] | 2.20 | 2.18 | 1.96 | 2.43 | 2.09 | 0.228 | 0.993 | 1.61 | 0.334 | 0.461 | 0.790 | 0.790 | 0.567 | ||
| DeadVeg | [-] | 2.14 | 2.12 | 1.96 | 2.27 | 2.09 | 0.162 | 0.973 | 1.81 | 0.340 | 0.456 | 0.754 | 0.805 | 0.562 |
Download Data |
Period Mean (original grids) [mm d-1] |
Model Period Mean (intersection) [mm d-1] |
Benchmark Period Mean (intersection) [mm d-1] |
Model Period Mean (complement) [mm d-1] |
Benchmark Period Mean (complement) [mm d-1] |
Bias [mm d-1] |
RMSE [mm d-1] |
Phase Shift [months] |
Bias Score [1] |
RMSE Score [1] |
Seasonal Cycle Score [1] |
Spatial Distribution Score [1] |
Overall Score [1] |
|||
|---|---|---|---|---|---|---|---|---|---|---|---|---|---|---|---|---|
| Benchmark | [-] | 1.17 | ||||||||||||||
| CLM50 | [-] | 0.971 | 1.09 | 1.17 | 0.467 | 1.34 | -0.0784 | 0.632 | 1.75 | 0.430 | 0.525 | 0.746 | 0.918 | 0.629 | ||
| CTSM51 | [-] | 0.960 | 1.08 | 1.17 | 0.451 | 1.34 | -0.0881 | 0.642 | 1.82 | 0.415 | 0.527 | 0.730 | 0.910 | 0.622 | ||
| DeadVeg | [-] | 0.935 | 1.05 | 1.17 | 0.481 | 1.34 | -0.0992 | 0.672 | 1.93 | 0.411 | 0.526 | 0.712 | 0.943 | 0.624 |
Temporally integrated period mean