Mean State
Download Data |
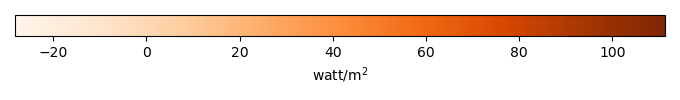
Period Mean (original grids) [watt/m2] |
Model Period Mean (intersection) [watt/m2] |
Benchmark Period Mean (intersection) [watt/m2] |
Model Period Mean (complement) [watt/m2] |
Benchmark Period Mean (complement) [watt/m2] |
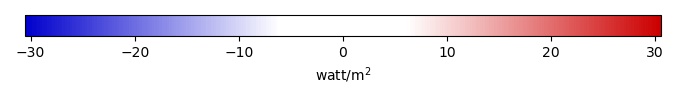
Bias [watt/m2] |
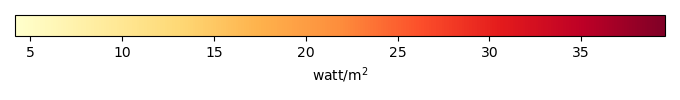
RMSE [watt/m2] |
Phase Shift [months] |
Bias Score [1] |
RMSE Score [1] |
Seasonal Cycle Score [1] |
Spatial Distribution Score [1] |
Overall Score [1] |
|||
|---|---|---|---|---|---|---|---|---|---|---|---|---|---|---|---|---|
| Benchmark | [-] | 79.5 | ||||||||||||||
| CLM50 | [-] | 72.4 | 73.0 | 79.5 | 64.4 | 60.4 | -7.01 | 16.4 | 1.30 | 0.568 | 0.650 | 0.819 | 0.967 | 0.731 | ||
| CTSM51 | [-] | 71.4 | 71.8 | 79.5 | 62.3 | 60.4 | -8.24 | 15.9 | 1.17 | 0.561 | 0.675 | 0.837 | 0.973 | 0.744 | ||
| DeadVeg | [-] | 72.2 | 72.8 | 79.5 | 61.5 | 60.4 | -7.37 | 16.9 | 2.13 | 0.564 | 0.635 | 0.651 | 0.967 | 0.690 |
Download Data |
Period Mean (original grids) [watt/m2] |
Model Period Mean (intersection) [watt/m2] |
Benchmark Period Mean (intersection) [watt/m2] |
Model Period Mean (complement) [watt/m2] |
Benchmark Period Mean (complement) [watt/m2] |
Bias [watt/m2] |
RMSE [watt/m2] |
Phase Shift [months] |
Bias Score [1] |
RMSE Score [1] |
Seasonal Cycle Score [1] |
Spatial Distribution Score [1] |
Overall Score [1] |
|||
|---|---|---|---|---|---|---|---|---|---|---|---|---|---|---|---|---|
| Benchmark | [-] | 58.8 | ||||||||||||||
| CLM50 | [-] | 46.7 | 46.3 | 58.8 | 28.3 | 76.3 | -12.5 | 24.2 | 1.50 | 0.367 | 0.372 | 0.766 | 0.991 | 0.573 | ||
| CTSM51 | [-] | 45.3 | 45.0 | 58.8 | 27.5 | 76.3 | -13.8 | 26.4 | 1.47 | 0.336 | 0.309 | 0.770 | 0.991 | 0.543 | ||
| DeadVeg | [-] | 45.9 | 45.5 | 58.8 | 27.4 | 76.3 | -13.3 | 25.0 | 1.35 | 0.363 | 0.348 | 0.793 | 0.986 | 0.568 |
Download Data |
Period Mean (original grids) [watt/m2] |
Model Period Mean (intersection) [watt/m2] |
Benchmark Period Mean (intersection) [watt/m2] |
Model Period Mean (complement) [watt/m2] |
Benchmark Period Mean (complement) [watt/m2] |
Bias [watt/m2] |
RMSE [watt/m2] |
Phase Shift [months] |
Bias Score [1] |
RMSE Score [1] |
Seasonal Cycle Score [1] |
Spatial Distribution Score [1] |
Overall Score [1] |
|||
|---|---|---|---|---|---|---|---|---|---|---|---|---|---|---|---|---|
| Benchmark | [-] | 58.2 | ||||||||||||||
| CLM50 | [-] | 50.6 | 50.3 | 58.2 | 55.5 | 64.4 | -7.67 | 22.6 | 1.30 | 0.497 | 0.404 | 0.828 | 0.961 | 0.619 | ||
| CTSM51 | [-] | 47.5 | 47.2 | 58.2 | 53.2 | 64.4 | -10.8 | 23.6 | 1.25 | 0.421 | 0.410 | 0.839 | 0.974 | 0.611 | ||
| DeadVeg | [-] | 47.1 | 46.7 | 58.2 | 54.9 | 64.4 | -11.2 | 22.5 | 1.17 | 0.414 | 0.457 | 0.854 | 0.961 | 0.629 |
Download Data |
Period Mean (original grids) [watt/m2] |
Model Period Mean (intersection) [watt/m2] |
Benchmark Period Mean (intersection) [watt/m2] |
Model Period Mean (complement) [watt/m2] |
Benchmark Period Mean (complement) [watt/m2] |
Bias [watt/m2] |
RMSE [watt/m2] |
Phase Shift [months] |
Bias Score [1] |
RMSE Score [1] |
Seasonal Cycle Score [1] |
Spatial Distribution Score [1] |
Overall Score [1] |
|||
|---|---|---|---|---|---|---|---|---|---|---|---|---|---|---|---|---|
| Benchmark | [-] | 19.1 | ||||||||||||||
| CLM50 | [-] | 14.7 | 14.9 | 19.1 | 11.2 | 20.5 | -4.34 | 12.5 | 0.774 | 0.496 | 0.236 | 0.948 | 0.833 | 0.550 | ||
| CTSM51 | [-] | 13.7 | 13.9 | 19.1 | 10.7 | 20.5 | -5.32 | 13.7 | 0.770 | 0.426 | 0.181 | 0.949 | 0.845 | 0.517 | ||
| DeadVeg | [-] | 15.8 | 16.0 | 19.1 | 13.5 | 20.5 | -3.18 | 9.37 | 0.611 | 0.587 | 0.417 | 0.959 | 0.961 | 0.668 |
Download Data |
Period Mean (original grids) [watt/m2] |
Model Period Mean (intersection) [watt/m2] |
Benchmark Period Mean (intersection) [watt/m2] |
Model Period Mean (complement) [watt/m2] |
Benchmark Period Mean (complement) [watt/m2] |
Bias [watt/m2] |
RMSE [watt/m2] |
Phase Shift [months] |
Bias Score [1] |
RMSE Score [1] |
Seasonal Cycle Score [1] |
Spatial Distribution Score [1] |
Overall Score [1] |
|||
|---|---|---|---|---|---|---|---|---|---|---|---|---|---|---|---|---|
| Benchmark | [-] | 109. | ||||||||||||||
| CLM50 | [-] | 99.4 | 98.8 | 109. | 102. | 114. | -9.09 | 15.6 | 1.83 | 0.474 | 0.825 | 0.714 | 0.976 | 0.763 | ||
| CTSM51 | [-] | 98.9 | 98.6 | 109. | 99.9 | 114. | -9.56 | 16.0 | 1.71 | 0.453 | 0.834 | 0.737 | 0.994 | 0.770 | ||
| DeadVeg | [-] | 104. | 105. | 109. | 103. | 114. | -4.34 | 18.4 | 2.02 | 0.476 | 0.741 | 0.683 | 0.893 | 0.707 |
Download Data |
Period Mean (original grids) [watt/m2] |
Model Period Mean (intersection) [watt/m2] |
Benchmark Period Mean (intersection) [watt/m2] |
Model Period Mean (complement) [watt/m2] |
Benchmark Period Mean (complement) [watt/m2] |
Bias [watt/m2] |
RMSE [watt/m2] |
Phase Shift [months] |
Bias Score [1] |
RMSE Score [1] |
Seasonal Cycle Score [1] |
Spatial Distribution Score [1] |
Overall Score [1] |
|||
|---|---|---|---|---|---|---|---|---|---|---|---|---|---|---|---|---|
| Benchmark | [-] | 29.2 | ||||||||||||||
| CLM50 | [-] | 25.3 | 25.3 | 29.2 | 25.0 | 36.2 | -3.87 | 9.85 | 0.422 | 0.605 | 0.510 | 0.972 | 0.974 | 0.714 | ||
| CTSM51 | [-] | 25.2 | 25.2 | 29.2 | 24.0 | 36.2 | -3.95 | 9.91 | 0.458 | 0.627 | 0.504 | 0.969 | 0.995 | 0.720 | ||
| DeadVeg | [-] | 24.8 | 24.7 | 29.2 | 24.8 | 36.2 | -4.44 | 9.11 | 0.463 | 0.597 | 0.575 | 0.969 | 0.945 | 0.732 |
Download Data |
Period Mean (original grids) [watt/m2] |
Model Period Mean (intersection) [watt/m2] |
Benchmark Period Mean (intersection) [watt/m2] |
Model Period Mean (complement) [watt/m2] |
Benchmark Period Mean (complement) [watt/m2] |
Bias [watt/m2] |
RMSE [watt/m2] |
Phase Shift [months] |
Bias Score [1] |
RMSE Score [1] |
Seasonal Cycle Score [1] |
Spatial Distribution Score [1] |
Overall Score [1] |
|||
|---|---|---|---|---|---|---|---|---|---|---|---|---|---|---|---|---|
| Benchmark | [-] | 35.9 | ||||||||||||||
| CLM50 | [-] | 27.7 | 29.1 | 35.9 | 17.2 | 61.1 | -6.33 | 13.2 | 0.494 | 0.508 | 0.565 | 0.959 | 0.985 | 0.716 | ||
| CTSM51 | [-] | 27.2 | 28.6 | 35.9 | 16.8 | 61.1 | -6.90 | 13.7 | 0.509 | 0.489 | 0.553 | 0.958 | 0.986 | 0.708 | ||
| DeadVeg | [-] | 28.1 | 29.4 | 35.9 | 18.5 | 61.1 | -6.07 | 13.0 | 0.685 | 0.524 | 0.562 | 0.935 | 0.988 | 0.714 |
Download Data |
Period Mean (original grids) [watt/m2] |
Model Period Mean (intersection) [watt/m2] |
Benchmark Period Mean (intersection) [watt/m2] |
Model Period Mean (complement) [watt/m2] |
Benchmark Period Mean (complement) [watt/m2] |
Bias [watt/m2] |
RMSE [watt/m2] |
Phase Shift [months] |
Bias Score [1] |
RMSE Score [1] |
Seasonal Cycle Score [1] |
Spatial Distribution Score [1] |
Overall Score [1] |
|||
|---|---|---|---|---|---|---|---|---|---|---|---|---|---|---|---|---|
| Benchmark | [-] | 66.8 | ||||||||||||||
| CLM50 | [-] | 58.4 | 58.8 | 66.7 | 51.4 | 97.5 | -6.09 | 20.8 | 1.92 | 0.579 | 0.459 | 0.696 | 0.993 | 0.638 | ||
| CTSM51 | [-] | 55.8 | 56.2 | 66.7 | 49.2 | 97.5 | -8.75 | 20.5 | 1.73 | 0.530 | 0.497 | 0.728 | 0.989 | 0.648 | ||
| DeadVeg | [-] | 57.3 | 58.1 | 66.7 | 48.5 | 97.5 | -6.98 | 19.8 | 1.71 | 0.552 | 0.508 | 0.742 | 0.991 | 0.660 |
Download Data |
Period Mean (original grids) [watt/m2] |
Model Period Mean (intersection) [watt/m2] |
Benchmark Period Mean (intersection) [watt/m2] |
Model Period Mean (complement) [watt/m2] |
Benchmark Period Mean (complement) [watt/m2] |
Bias [watt/m2] |
RMSE [watt/m2] |
Phase Shift [months] |
Bias Score [1] |
RMSE Score [1] |
Seasonal Cycle Score [1] |
Spatial Distribution Score [1] |
Overall Score [1] |
|||
|---|---|---|---|---|---|---|---|---|---|---|---|---|---|---|---|---|
| Benchmark | [-] | 18.2 | ||||||||||||||
| CLM50 | [-] | 16.3 | 16.8 | 18.2 | 10.1 | 16.7 | -1.58 | 11.8 | 0.492 | 0.682 | 0.248 | 0.967 | 0.948 | 0.619 | ||
| CTSM51 | [-] | 14.9 | 15.4 | 18.2 | 9.17 | 16.7 | -2.94 | 13.4 | 0.516 | 0.616 | 0.186 | 0.966 | 0.947 | 0.580 | ||
| DeadVeg | [-] | 16.0 | 16.4 | 18.2 | 11.3 | 16.7 | -1.89 | 7.77 | 0.449 | 0.712 | 0.509 | 0.970 | 0.988 | 0.737 |
Download Data |
Period Mean (original grids) [watt/m2] |
Model Period Mean (intersection) [watt/m2] |
Benchmark Period Mean (intersection) [watt/m2] |
Model Period Mean (complement) [watt/m2] |
Benchmark Period Mean (complement) [watt/m2] |
Bias [watt/m2] |
RMSE [watt/m2] |
Phase Shift [months] |
Bias Score [1] |
RMSE Score [1] |
Seasonal Cycle Score [1] |
Spatial Distribution Score [1] |
Overall Score [1] |
|||
|---|---|---|---|---|---|---|---|---|---|---|---|---|---|---|---|---|
| Benchmark | [-] | 34.7 | ||||||||||||||
| CLM50 | [-] | 33.5 | 32.2 | 34.5 | 59.7 | 64.0 | -0.925 | 10.5 | 0.857 | 0.725 | 0.662 | 0.901 | 0.943 | 0.779 | ||
| CTSM51 | [-] | 32.9 | 31.8 | 34.5 | 55.9 | 64.0 | -1.49 | 10.8 | 0.810 | 0.724 | 0.645 | 0.906 | 0.976 | 0.779 | ||
| DeadVeg | [-] | 33.5 | 32.4 | 34.5 | 56.6 | 64.0 | -0.836 | 10.8 | 0.774 | 0.692 | 0.667 | 0.916 | 0.955 | 0.780 |
Download Data |
Period Mean (original grids) [watt/m2] |
Model Period Mean (intersection) [watt/m2] |
Benchmark Period Mean (intersection) [watt/m2] |
Model Period Mean (complement) [watt/m2] |
Benchmark Period Mean (complement) [watt/m2] |
Bias [watt/m2] |
RMSE [watt/m2] |
Phase Shift [months] |
Bias Score [1] |
RMSE Score [1] |
Seasonal Cycle Score [1] |
Spatial Distribution Score [1] |
Overall Score [1] |
|||
|---|---|---|---|---|---|---|---|---|---|---|---|---|---|---|---|---|
| Benchmark | [-] | 40.2 | ||||||||||||||
| CLM50 | [-] | 34.0 | 34.1 | 40.2 | 33.3 | 44.2 | -6.03 | 11.7 | 0.329 | 0.560 | 0.611 | 0.978 | 0.995 | 0.751 | ||
| CTSM51 | [-] | 33.0 | 33.0 | 40.2 | 32.4 | 44.2 | -7.04 | 12.5 | 0.465 | 0.497 | 0.595 | 0.969 | 0.993 | 0.730 | ||
| DeadVeg | [-] | 32.8 | 32.8 | 40.2 | 32.5 | 44.2 | -7.28 | 12.3 | 0.267 | 0.496 | 0.622 | 0.982 | 0.972 | 0.739 |
Download Data |
Period Mean (original grids) [watt/m2] |
Model Period Mean (intersection) [watt/m2] |
Benchmark Period Mean (intersection) [watt/m2] |
Model Period Mean (complement) [watt/m2] |
Benchmark Period Mean (complement) [watt/m2] |
Bias [watt/m2] |
RMSE [watt/m2] |
Phase Shift [months] |
Bias Score [1] |
RMSE Score [1] |
Seasonal Cycle Score [1] |
Spatial Distribution Score [1] |
Overall Score [1] |
|||
|---|---|---|---|---|---|---|---|---|---|---|---|---|---|---|---|---|
| Benchmark | [-] | 48.9 | ||||||||||||||
| CLM50 | [-] | 34.7 | 42.7 | 48.9 | 8.38 | 67.6 | -5.62 | 15.0 | 0.894 | 0.555 | 0.536 | 0.889 | 0.990 | 0.701 | ||
| CTSM51 | [-] | 33.8 | 41.6 | 48.9 | 8.14 | 67.6 | -6.81 | 15.3 | 0.844 | 0.528 | 0.535 | 0.898 | 0.988 | 0.697 | ||
| DeadVeg | [-] | 32.5 | 41.6 | 48.9 | 2.47 | 67.6 | -6.69 | 15.2 | 0.960 | 0.520 | 0.562 | 0.881 | 0.985 | 0.702 |
Download Data |
Period Mean (original grids) [watt/m2] |
Model Period Mean (intersection) [watt/m2] |
Benchmark Period Mean (intersection) [watt/m2] |
Model Period Mean (complement) [watt/m2] |
Benchmark Period Mean (complement) [watt/m2] |
Bias [watt/m2] |
RMSE [watt/m2] |
Phase Shift [months] |
Bias Score [1] |
RMSE Score [1] |
Seasonal Cycle Score [1] |
Spatial Distribution Score [1] |
Overall Score [1] |
|||
|---|---|---|---|---|---|---|---|---|---|---|---|---|---|---|---|---|
| Benchmark | [-] | 29.2 | ||||||||||||||
| CLM50 | [-] | 8.81 | 18.9 | 29.2 | 4.42 | 27.0 | -10.2 | 17.6 | 1.05 | 0.403 | 0.518 | 0.859 | 0.946 | 0.649 | ||
| CTSM51 | [-] | 8.89 | 19.2 | 29.2 | 4.43 | 27.0 | -9.96 | 17.1 | 1.02 | 0.402 | 0.544 | 0.864 | 0.940 | 0.659 | ||
| DeadVeg | [-] | 9.99 | 20.7 | 29.2 | 5.31 | 27.0 | -8.37 | 16.4 | 1.00 | 0.465 | 0.535 | 0.871 | 0.942 | 0.669 |
Download Data |
Period Mean (original grids) [watt/m2] |
Model Period Mean (intersection) [watt/m2] |
Benchmark Period Mean (intersection) [watt/m2] |
Model Period Mean (complement) [watt/m2] |
Benchmark Period Mean (complement) [watt/m2] |
Bias [watt/m2] |
RMSE [watt/m2] |
Phase Shift [months] |
Bias Score [1] |
RMSE Score [1] |
Seasonal Cycle Score [1] |
Spatial Distribution Score [1] |
Overall Score [1] |
|||
|---|---|---|---|---|---|---|---|---|---|---|---|---|---|---|---|---|
| Benchmark | [-] | 18.6 | ||||||||||||||
| CLM50 | [-] | 15.8 | 17.1 | 18.6 | 8.43 | 19.0 | -1.81 | 11.6 | 0.385 | 0.558 | 0.331 | 0.974 | 0.979 | 0.635 | ||
| CTSM51 | [-] | 15.0 | 16.1 | 18.6 | 8.20 | 19.0 | -2.69 | 12.2 | 0.279 | 0.542 | 0.301 | 0.981 | 0.977 | 0.621 | ||
| DeadVeg | [-] | 17.1 | 18.3 | 18.6 | 10.5 | 19.0 | -0.404 | 9.82 | 0.199 | 0.564 | 0.438 | 0.987 | 0.976 | 0.681 |
Download Data |
Period Mean (original grids) [watt/m2] |
Model Period Mean (intersection) [watt/m2] |
Benchmark Period Mean (intersection) [watt/m2] |
Model Period Mean (complement) [watt/m2] |
Benchmark Period Mean (complement) [watt/m2] |
Bias [watt/m2] |
RMSE [watt/m2] |
Phase Shift [months] |
Bias Score [1] |
RMSE Score [1] |
Seasonal Cycle Score [1] |
Spatial Distribution Score [1] |
Overall Score [1] |
|||
|---|---|---|---|---|---|---|---|---|---|---|---|---|---|---|---|---|
| Benchmark | [-] | 68.1 | ||||||||||||||
| CLM50 | [-] | 58.2 | 57.7 | 67.9 | 64.1 | 85.0 | -7.50 | 16.9 | 0.908 | 0.526 | 0.601 | 0.885 | 0.989 | 0.721 | ||
| CTSM51 | [-] | 57.0 | 56.5 | 67.9 | 62.1 | 85.0 | -8.89 | 17.2 | 0.884 | 0.493 | 0.612 | 0.890 | 0.991 | 0.720 | ||
| DeadVeg | [-] | 55.5 | 55.2 | 67.9 | 59.2 | 85.0 | -10.3 | 19.1 | 0.972 | 0.399 | 0.601 | 0.892 | 0.986 | 0.696 |
Download Data |
Period Mean (original grids) [watt/m2] |
Model Period Mean (intersection) [watt/m2] |
Benchmark Period Mean (intersection) [watt/m2] |
Model Period Mean (complement) [watt/m2] |
Benchmark Period Mean (complement) [watt/m2] |
Bias [watt/m2] |
RMSE [watt/m2] |
Phase Shift [months] |
Bias Score [1] |
RMSE Score [1] |
Seasonal Cycle Score [1] |
Spatial Distribution Score [1] |
Overall Score [1] |
|||
|---|---|---|---|---|---|---|---|---|---|---|---|---|---|---|---|---|
| Benchmark | [-] | 58.8 | ||||||||||||||
| CLM50 | [-] | 53.3 | 53.3 | 58.8 | 55.4 | 68.9 | -4.79 | 11.9 | 0.413 | 0.608 | 0.607 | 0.970 | 0.990 | 0.757 | ||
| CTSM51 | [-] | 51.2 | 51.2 | 58.8 | 53.8 | 68.9 | -6.98 | 13.0 | 0.406 | 0.495 | 0.607 | 0.970 | 0.988 | 0.733 | ||
| DeadVeg | [-] | 47.7 | 47.6 | 58.8 | 51.6 | 68.9 | -10.8 | 16.4 | 0.767 | 0.325 | 0.532 | 0.949 | 0.944 | 0.656 |
Download Data |
Period Mean (original grids) [watt/m2] |
Model Period Mean (intersection) [watt/m2] |
Benchmark Period Mean (intersection) [watt/m2] |
Model Period Mean (complement) [watt/m2] |
Benchmark Period Mean (complement) [watt/m2] |
Bias [watt/m2] |
RMSE [watt/m2] |
Phase Shift [months] |
Bias Score [1] |
RMSE Score [1] |
Seasonal Cycle Score [1] |
Spatial Distribution Score [1] |
Overall Score [1] |
|||
|---|---|---|---|---|---|---|---|---|---|---|---|---|---|---|---|---|
| Benchmark | [-] | 32.9 | ||||||||||||||
| CLM50 | [-] | 31.2 | 31.2 | 32.9 | 34.7 | 35.8 | -1.66 | 9.17 | 0.184 | 0.735 | 0.595 | 0.988 | 0.992 | 0.781 | ||
| CTSM51 | [-] | 30.1 | 30.1 | 32.9 | 33.8 | 35.8 | -2.81 | 9.26 | 0.149 | 0.726 | 0.598 | 0.990 | 0.995 | 0.781 | ||
| DeadVeg | [-] | 30.7 | 30.5 | 32.9 | 38.1 | 35.8 | -2.31 | 9.29 | 0.476 | 0.749 | 0.586 | 0.968 | 0.954 | 0.769 |
Download Data |
Period Mean (original grids) [watt/m2] |
Model Period Mean (intersection) [watt/m2] |
Benchmark Period Mean (intersection) [watt/m2] |
Model Period Mean (complement) [watt/m2] |
Benchmark Period Mean (complement) [watt/m2] |
Bias [watt/m2] |
RMSE [watt/m2] |
Phase Shift [months] |
Bias Score [1] |
RMSE Score [1] |
Seasonal Cycle Score [1] |
Spatial Distribution Score [1] |
Overall Score [1] |
|||
|---|---|---|---|---|---|---|---|---|---|---|---|---|---|---|---|---|
| Benchmark | [-] | 34.5 | ||||||||||||||
| CLM50 | [-] | 26.8 | 27.2 | 34.5 | 36.3 | 56.9 | -7.17 | 12.2 | 0.612 | 0.529 | 0.640 | 0.941 | 0.980 | 0.746 | ||
| CTSM51 | [-] | 27.3 | 27.6 | 34.5 | 37.8 | 56.9 | -6.73 | 11.7 | 0.595 | 0.542 | 0.654 | 0.942 | 0.975 | 0.753 | ||
| DeadVeg | [-] | 26.9 | 27.1 | 34.5 | 38.5 | 56.9 | -7.25 | 11.6 | 0.680 | 0.529 | 0.657 | 0.934 | 0.988 | 0.753 |
Download Data |
Period Mean (original grids) [watt/m2] |
Model Period Mean (intersection) [watt/m2] |
Benchmark Period Mean (intersection) [watt/m2] |
Model Period Mean (complement) [watt/m2] |
Benchmark Period Mean (complement) [watt/m2] |
Bias [watt/m2] |
RMSE [watt/m2] |
Phase Shift [months] |
Bias Score [1] |
RMSE Score [1] |
Seasonal Cycle Score [1] |
Spatial Distribution Score [1] |
Overall Score [1] |
|||
|---|---|---|---|---|---|---|---|---|---|---|---|---|---|---|---|---|
| Benchmark | [-] | 99.9 | ||||||||||||||
| CLM50 | [-] | 94.7 | 94.8 | 99.9 | 86.0 | 91.6 | -5.17 | 15.0 | 1.43 | 0.598 | 0.749 | 0.795 | 0.849 | 0.748 | ||
| CTSM51 | [-] | 92.6 | 92.9 | 99.9 | 82.8 | 91.6 | -7.13 | 14.4 | 1.13 | 0.572 | 0.787 | 0.846 | 0.895 | 0.777 | ||
| DeadVeg | [-] | 89.6 | 89.8 | 99.9 | 83.9 | 91.6 | -10.1 | 18.7 | 1.75 | 0.423 | 0.742 | 0.746 | 0.987 | 0.728 |
Download Data |
Period Mean (original grids) [watt/m2] |
Model Period Mean (intersection) [watt/m2] |
Benchmark Period Mean (intersection) [watt/m2] |
Model Period Mean (complement) [watt/m2] |
Benchmark Period Mean (complement) [watt/m2] |
Bias [watt/m2] |
RMSE [watt/m2] |
Phase Shift [months] |
Bias Score [1] |
RMSE Score [1] |
Seasonal Cycle Score [1] |
Spatial Distribution Score [1] |
Overall Score [1] |
|||
|---|---|---|---|---|---|---|---|---|---|---|---|---|---|---|---|---|
| Benchmark | [-] | 70.4 | ||||||||||||||
| CLM50 | [-] | 67.0 | 66.7 | 70.4 | 75.4 | 63.8 | -3.53 | 18.4 | 1.19 | 0.618 | 0.531 | 0.866 | 0.943 | 0.698 | ||
| CTSM51 | [-] | 64.5 | 64.1 | 70.4 | 72.2 | 63.8 | -6.16 | 17.9 | 1.13 | 0.594 | 0.567 | 0.879 | 0.965 | 0.715 | ||
| DeadVeg | [-] | 61.9 | 61.5 | 70.4 | 67.5 | 63.8 | -8.86 | 18.3 | 1.27 | 0.560 | 0.590 | 0.848 | 0.975 | 0.712 |
Download Data |
Period Mean (original grids) [watt/m2] |
Model Period Mean (intersection) [watt/m2] |
Benchmark Period Mean (intersection) [watt/m2] |
Model Period Mean (complement) [watt/m2] |
Benchmark Period Mean (complement) [watt/m2] |
Bias [watt/m2] |
RMSE [watt/m2] |
Phase Shift [months] |
Bias Score [1] |
RMSE Score [1] |
Seasonal Cycle Score [1] |
Spatial Distribution Score [1] |
Overall Score [1] |
|||
|---|---|---|---|---|---|---|---|---|---|---|---|---|---|---|---|---|
| Benchmark | [-] | 34.8 | ||||||||||||||
| CLM50 | [-] | 28.3 | 30.1 | 34.7 | 12.4 | 37.9 | -4.83 | 14.1 | 0.730 | 0.451 | 0.614 | 0.920 | 0.899 | 0.700 | ||
| CTSM51 | [-] | 28.0 | 29.9 | 34.7 | 11.8 | 37.9 | -5.05 | 13.6 | 0.627 | 0.446 | 0.646 | 0.933 | 0.907 | 0.716 | ||
| DeadVeg | [-] | 27.2 | 28.9 | 34.7 | 12.6 | 37.9 | -5.30 | 16.8 | 0.783 | 0.319 | 0.607 | 0.914 | 0.812 | 0.652 |
Temporally integrated period mean