Mean State
Download Data |
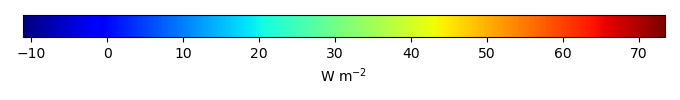
Period Mean (original grids) [W m-2] |
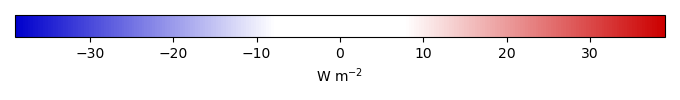
Bias [W m-2] |
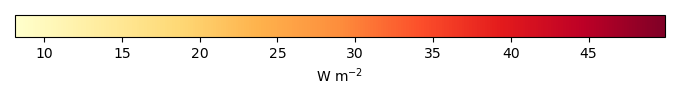
RMSE [W m-2] |
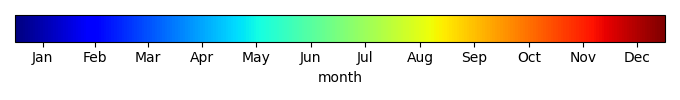
Phase Shift [months] |
Bias Score [1] |
RMSE Score [1] |
Seasonal Cycle Score [1] |
Overall Score [1] |
|||
|---|---|---|---|---|---|---|---|---|---|---|---|
| Benchmark | [-] | 32.5 | |||||||||
| CLM50 | [-] | 37.0 | 4.49 | 13.4 | 3.02 | 0.805 | 0.570 | 0.435 | 0.595 | ||
| CTSM51 | [-] | 39.1 | 6.52 | 14.8 | 3.02 | 0.676 | 0.515 | 0.435 | 0.535 | ||
| DeadVeg | [-] | 15.0 | -17.6 | 24.2 | 1.52 | 0.348 | 0.619 | 0.816 | 0.600 |
Download Data |
Period Mean (original grids) [W m-2] |
Bias [W m-2] |
RMSE [W m-2] |
Phase Shift [months] |
Bias Score [1] |
RMSE Score [1] |
Seasonal Cycle Score [1] |
Overall Score [1] |
|||
|---|---|---|---|---|---|---|---|---|---|---|---|
| Benchmark | [-] | 50.6 | |||||||||
| CLM50 | [-] | 49.4 | -1.20 | 18.2 | 2.03 | 0.821 | 0.183 | 0.702 | 0.472 | ||
| CTSM51 | [-] | 51.7 | 1.08 | 19.4 | 2.03 | 0.829 | 0.184 | 0.702 | 0.474 | ||
| DeadVeg | [-] | 55.0 | 4.40 | 28.0 | 1.02 | 0.0170 | 0.182 | 0.867 | 0.312 |
Download Data |
Period Mean (original grids) [W m-2] |
Bias [W m-2] |
RMSE [W m-2] |
Phase Shift [months] |
Bias Score [1] |
RMSE Score [1] |
Seasonal Cycle Score [1] |
Overall Score [1] |
|||
|---|---|---|---|---|---|---|---|---|---|---|---|
| Benchmark | [-] | 47.7 | |||||||||
| CLM50 | [-] | 54.3 | 6.55 | 34.6 | 0.00 | 0.664 | 0.00 | 1.00 | 0.416 | ||
| CTSM51 | [-] | 61.3 | 13.5 | 36.7 | 0.00 | 0.307 | 0.00 | 1.00 | 0.327 | ||
| DeadVeg | [-] | 70.0 | 22.3 | 42.0 | 0.00 | 0.00 | 0.00 | 1.00 | 0.250 |
Download Data |
Period Mean (original grids) [W m-2] |
Bias [W m-2] |
RMSE [W m-2] |
Phase Shift [months] |
Bias Score [1] |
RMSE Score [1] |
Seasonal Cycle Score [1] |
Overall Score [1] |
|||
|---|---|---|---|---|---|---|---|---|---|---|---|
| Benchmark | [-] | 13.8 | |||||||||
| CLM50 | [-] | 7.50 | -6.28 | 18.7 | 0.508 | 0.629 | 0.297 | 0.969 | 0.548 | ||
| CTSM51 | [-] | 4.70 | -9.07 | 20.2 | 1.02 | 0.461 | 0.282 | 0.933 | 0.489 | ||
| DeadVeg | [-] | 8.69 | -5.08 | 18.6 | 0.508 | 0.712 | 0.283 | 0.969 | 0.562 |
Download Data |
Period Mean (original grids) [W m-2] |
Bias [W m-2] |
RMSE [W m-2] |
Phase Shift [months] |
Bias Score [1] |
RMSE Score [1] |
Seasonal Cycle Score [1] |
Overall Score [1] |
|||
|---|---|---|---|---|---|---|---|---|---|---|---|
| Benchmark | [-] | 45.2 | |||||||||
| CLM50 | [-] | 31.0 | -14.2 | 18.3 | 5.07 | 0.271 | 0.562 | 0.0673 | 0.365 | ||
| CTSM51 | [-] | 26.5 | -18.6 | 22.0 | 5.07 | 0.0441 | 0.556 | 0.0673 | 0.306 | ||
| DeadVeg | [-] | 21.5 | -23.7 | 26.7 | 0.00 | 0.00 | 0.611 | 1.00 | 0.556 |
Download Data |
Period Mean (original grids) [W m-2] |
Bias [W m-2] |
RMSE [W m-2] |
Phase Shift [months] |
Bias Score [1] |
RMSE Score [1] |
Seasonal Cycle Score [1] |
Overall Score [1] |
|||
|---|---|---|---|---|---|---|---|---|---|---|---|
| Benchmark | [-] | 22.3 | |||||||||
| CLM50 | [-] | 13.1 | -9.17 | 23.0 | 0.508 | 0.351 | 0.0575 | 0.967 | 0.358 | ||
| CTSM51 | [-] | 14.4 | -7.92 | 23.3 | 0.508 | 0.432 | 0.0187 | 0.967 | 0.359 | ||
| DeadVeg | [-] | 18.4 | -3.88 | 19.5 | 0.508 | 0.662 | 0.179 | 0.967 | 0.497 |
Download Data |
Period Mean (original grids) [W m-2] |
Bias [W m-2] |
RMSE [W m-2] |
Phase Shift [months] |
Bias Score [1] |
RMSE Score [1] |
Seasonal Cycle Score [1] |
Overall Score [1] |
|||
|---|---|---|---|---|---|---|---|---|---|---|---|
| Benchmark | [-] | 26.9 | |||||||||
| CLM50 | [-] | 38.5 | 11.6 | 20.3 | 0.762 | 0.414 | 0.345 | 0.927 | 0.508 | ||
| CTSM51 | [-] | 38.3 | 11.3 | 19.7 | 0.678 | 0.392 | 0.356 | 0.931 | 0.509 | ||
| DeadVeg | [-] | 34.0 | 7.10 | 19.9 | 1.18 | 0.512 | 0.313 | 0.887 | 0.506 |
Download Data |
Period Mean (original grids) [W m-2] |
Bias [W m-2] |
RMSE [W m-2] |
Phase Shift [months] |
Bias Score [1] |
RMSE Score [1] |
Seasonal Cycle Score [1] |
Overall Score [1] |
|||
|---|---|---|---|---|---|---|---|---|---|---|---|
| Benchmark | [-] | 52.4 | |||||||||
| CLM50 | [-] | 52.7 | -0.635 | 27.7 | 0.693 | 0.323 | 0.174 | 0.966 | 0.409 | ||
| CTSM51 | [-] | 54.4 | 1.12 | 27.5 | 0.879 | 0.295 | 0.177 | 0.952 | 0.400 | ||
| DeadVeg | [-] | 57.8 | 4.48 | 28.8 | 0.926 | 0.273 | 0.190 | 0.933 | 0.396 |
Download Data |
Period Mean (original grids) [W m-2] |
Bias [W m-2] |
RMSE [W m-2] |
Phase Shift [months] |
Bias Score [1] |
RMSE Score [1] |
Seasonal Cycle Score [1] |
Overall Score [1] |
|||
|---|---|---|---|---|---|---|---|---|---|---|---|
| Benchmark | [-] | 22.1 | |||||||||
| CLM50 | [-] | 22.5 | 0.332 | 23.6 | 1.14 | 0.321 | 0.0943 | 0.895 | 0.351 | ||
| CTSM51 | [-] | 23.0 | 0.889 | 23.2 | 1.16 | 0.320 | 0.0977 | 0.894 | 0.352 | ||
| DeadVeg | [-] | 25.9 | 3.78 | 24.1 | 1.11 | 0.330 | 0.115 | 0.897 | 0.364 |
Download Data |
Period Mean (original grids) [W m-2] |
Bias [W m-2] |
RMSE [W m-2] |
Phase Shift [months] |
Bias Score [1] |
RMSE Score [1] |
Seasonal Cycle Score [1] |
Overall Score [1] |
|||
|---|---|---|---|---|---|---|---|---|---|---|---|
| Benchmark | [-] | 30.6 | |||||||||
| CLM50 | [-] | 31.0 | 0.352 | 24.5 | 1.00 | 0.381 | 0.161 | 0.888 | 0.398 | ||
| CTSM51 | [-] | 30.9 | 0.325 | 24.4 | 1.03 | 0.364 | 0.161 | 0.888 | 0.394 | ||
| DeadVeg | [-] | 32.4 | 1.76 | 25.6 | 1.02 | 0.316 | 0.161 | 0.890 | 0.382 |
Download Data |
Period Mean (original grids) [W m-2] |
Bias [W m-2] |
RMSE [W m-2] |
Phase Shift [months] |
Bias Score [1] |
RMSE Score [1] |
Seasonal Cycle Score [1] |
Overall Score [1] |
|||
|---|---|---|---|---|---|---|---|---|---|---|---|
| Benchmark | [-] | 4.91 | |||||||||
| CLM50 | [-] | 16.3 | 11.4 | 23.9 | 0.339 | 0.936 | 0.354 | 0.934 | 0.645 | ||
| CTSM51 | [-] | 16.3 | 11.3 | 21.0 | 0.339 | 0.937 | 0.478 | 0.934 | 0.707 | ||
| DeadVeg | [-] | 8.91 | 3.99 | 17.3 | 0.339 | 0.925 | 0.334 | 0.934 | 0.632 |
Download Data |
Period Mean (original grids) [W m-2] |
Bias [W m-2] |
RMSE [W m-2] |
Phase Shift [months] |
Bias Score [1] |
RMSE Score [1] |
Seasonal Cycle Score [1] |
Overall Score [1] |
|||
|---|---|---|---|---|---|---|---|---|---|---|---|
| Benchmark | [-] | 32.1 | |||||||||
| CLM50 | [-] | 27.6 | -4.42 | 14.8 | 0.00 | 0.776 | 0.394 | 1.00 | 0.641 | ||
| CTSM51 | [-] | 24.2 | -7.86 | 16.4 | 0.00 | 0.601 | 0.385 | 1.00 | 0.593 | ||
| DeadVeg | [-] | 43.3 | 11.3 | 21.5 | 0.00 | 0.429 | 0.325 | 1.00 | 0.520 |
Download Data |
Period Mean (original grids) [W m-2] |
Bias [W m-2] |
RMSE [W m-2] |
Phase Shift [months] |
Bias Score [1] |
RMSE Score [1] |
Seasonal Cycle Score [1] |
Overall Score [1] |
|||
|---|---|---|---|---|---|---|---|---|---|---|---|
| Benchmark | [-] | 30.5 | |||||||||
| CLM50 | [-] | 25.6 | -4.92 | 25.3 | 1.07 | 0.275 | 0.114 | 0.804 | 0.327 | ||
| CTSM51 | [-] | 24.6 | -5.89 | 25.8 | 1.09 | 0.276 | 0.113 | 0.803 | 0.326 | ||
| DeadVeg | [-] | 27.5 | -3.04 | 26.8 | 1.12 | 0.227 | 0.0968 | 0.804 | 0.306 |
Download Data |
Period Mean (original grids) [W m-2] |
Bias [W m-2] |
RMSE [W m-2] |
Phase Shift [months] |
Bias Score [1] |
RMSE Score [1] |
Seasonal Cycle Score [1] |
Overall Score [1] |
|||
|---|---|---|---|---|---|---|---|---|---|---|---|
| Benchmark | [-] | 31.8 | |||||||||
| CLM50 | [-] | 27.0 | -4.77 | 19.9 | 0.678 | 0.526 | 0.218 | 0.946 | 0.477 | ||
| CTSM51 | [-] | 24.7 | -7.12 | 21.1 | 1.02 | 0.446 | 0.189 | 0.914 | 0.435 | ||
| DeadVeg | [-] | 26.7 | -5.12 | 20.4 | 0.881 | 0.530 | 0.193 | 0.941 | 0.465 |
Download Data |
Period Mean (original grids) [W m-2] |
Bias [W m-2] |
RMSE [W m-2] |
Phase Shift [months] |
Bias Score [1] |
RMSE Score [1] |
Seasonal Cycle Score [1] |
Overall Score [1] |
|||
|---|---|---|---|---|---|---|---|---|---|---|---|
| Benchmark | [-] | 38.7 | |||||||||
| CLM50 | [-] | 45.9 | 7.17 | 28.5 | 1.09 | 0.476 | 0.142 | 0.892 | 0.413 | ||
| CTSM51 | [-] | 46.0 | 7.32 | 27.5 | 0.874 | 0.484 | 0.153 | 0.925 | 0.429 | ||
| DeadVeg | [-] | 43.6 | 4.89 | 30.0 | 1.16 | 0.313 | 0.137 | 0.881 | 0.367 |
Download Data |
Period Mean (original grids) [W m-2] |
Bias [W m-2] |
RMSE [W m-2] |
Phase Shift [months] |
Bias Score [1] |
RMSE Score [1] |
Seasonal Cycle Score [1] |
Overall Score [1] |
|||
|---|---|---|---|---|---|---|---|---|---|---|---|
| Benchmark | [-] | 20.8 | |||||||||
| CLM50 | [-] | 30.8 | 10.0 | 13.9 | 0.00 | 0.483 | 0.586 | 1.00 | 0.664 | ||
| CTSM51 | [-] | 28.0 | 7.20 | 13.7 | 0.00 | 0.627 | 0.530 | 1.00 | 0.672 | ||
| DeadVeg | [-] | 30.7 | 9.99 | 20.1 | 0.339 | 0.491 | 0.432 | 0.977 | 0.583 |
Download Data |
Period Mean (original grids) [W m-2] |
Bias [W m-2] |
RMSE [W m-2] |
Phase Shift [months] |
Bias Score [1] |
RMSE Score [1] |
Seasonal Cycle Score [1] |
Overall Score [1] |
|||
|---|---|---|---|---|---|---|---|---|---|---|---|
| Benchmark | [-] | -10.2 | |||||||||
| CLM50 | [-] | 25.9 | 36.2 | 49.9 | 2.05 | -0.00 | -0.00 | 0.745 | 0.186 | ||
| CTSM51 | [-] | 28.2 | 38.4 | 51.2 | 2.05 | -0.00 | -0.00 | 0.745 | 0.186 | ||
| DeadVeg | [-] | 43.7 | 53.9 | 64.4 | 0.00 | -0.00 | -0.00 | 1.00 | 0.250 |
Download Data |
Period Mean (original grids) [W m-2] |
Bias [W m-2] |
RMSE [W m-2] |
Phase Shift [months] |
Bias Score [1] |
RMSE Score [1] |
Seasonal Cycle Score [1] |
Overall Score [1] |
|||
|---|---|---|---|---|---|---|---|---|---|---|---|
| Benchmark | [-] | 83.9 | |||||||||
| CLM50 | [-] | 49.5 | -34.5 | 48.2 | 1.03 | 0.00 | 0.00 | 0.930 | 0.233 | ||
| CTSM51 | [-] | 41.3 | -42.6 | 52.2 | 1.03 | 0.00 | 0.00 | 0.930 | 0.233 | ||
| DeadVeg | [-] | 51.1 | -32.9 | 35.3 | 1.03 | 0.00 | 0.00 | 0.930 | 0.233 |
Temporally integrated period mean