Mean State
Download Data |
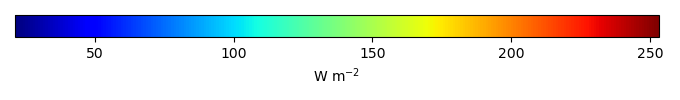
Period Mean (original grids) [W m-2] |
Model Period Mean (intersection) [W m-2] |
Benchmark Period Mean (intersection) [W m-2] |
Model Period Mean (complement) [W m-2] |
Benchmark Period Mean (complement) [W m-2] |
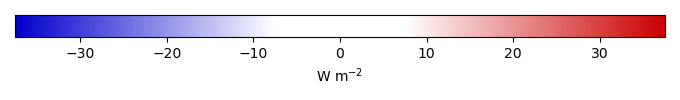
Bias [W m-2] |
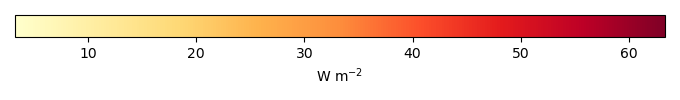
RMSE [W m-2] |
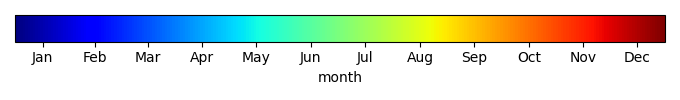
Phase Shift [months] |
Bias Score [1] |
RMSE Score [1] |
Seasonal Cycle Score [1] |
Spatial Distribution Score [1] |
Overall Score [1] |
|||
|---|---|---|---|---|---|---|---|---|---|---|---|---|---|---|---|---|
| Benchmark | [-] | 184. | ||||||||||||||
| CLM50 | [-] | 181. | 181. | 183. | 204. | -1.54 | 10.5 | 0.828 | 0.691 | 0.759 | 0.896 | 0.880 | 0.797 | |||
| CTSM51 | [-] | 176. | 176. | 183. | 204. | -6.25 | 11.7 | 0.861 | 0.615 | 0.761 | 0.892 | 0.941 | 0.794 | |||
| DeadVeg | [-] | 179. | 179. | 183. | 204. | -5.07 | 24.7 | 2.23 | 0.455 | 0.289 | 0.662 | 0.948 | 0.528 |
Download Data |
Period Mean (original grids) [W m-2] |
Model Period Mean (intersection) [W m-2] |
Benchmark Period Mean (intersection) [W m-2] |
Model Period Mean (complement) [W m-2] |
Benchmark Period Mean (complement) [W m-2] |
Bias [W m-2] |
RMSE [W m-2] |
Phase Shift [months] |
Bias Score [1] |
RMSE Score [1] |
Seasonal Cycle Score [1] |
Spatial Distribution Score [1] |
Overall Score [1] |
|||
|---|---|---|---|---|---|---|---|---|---|---|---|---|---|---|---|---|
| Benchmark | [-] | 198. | ||||||||||||||
| CLM50 | [-] | 195. | 195. | 198. | 216. | -3.11 | 11.0 | 0.922 | 0.608 | 0.708 | 0.873 | 0.934 | 0.766 | |||
| CTSM51 | [-] | 194. | 194. | 198. | 216. | -4.11 | 11.2 | 0.932 | 0.589 | 0.715 | 0.871 | 0.917 | 0.761 | |||
| DeadVeg | [-] | 194. | 194. | 198. | 216. | -3.16 | 28.3 | 2.00 | 0.395 | 0.173 | 0.695 | 0.930 | 0.473 |
Download Data |
Period Mean (original grids) [W m-2] |
Model Period Mean (intersection) [W m-2] |
Benchmark Period Mean (intersection) [W m-2] |
Model Period Mean (complement) [W m-2] |
Benchmark Period Mean (complement) [W m-2] |
Bias [W m-2] |
RMSE [W m-2] |
Phase Shift [months] |
Bias Score [1] |
RMSE Score [1] |
Seasonal Cycle Score [1] |
Spatial Distribution Score [1] |
Overall Score [1] |
|||
|---|---|---|---|---|---|---|---|---|---|---|---|---|---|---|---|---|
| Benchmark | [-] | 201. | ||||||||||||||
| CLM50 | [-] | 196. | 196. | 200. | 220. | -4.66 | 10.2 | 0.653 | 0.710 | 0.775 | 0.920 | 0.988 | 0.833 | |||
| CTSM51 | [-] | 193. | 193. | 200. | 220. | -7.00 | 11.1 | 0.653 | 0.652 | 0.771 | 0.920 | 0.986 | 0.820 | |||
| DeadVeg | [-] | 191. | 191. | 200. | 219. | -8.55 | 19.2 | 1.50 | 0.437 | 0.525 | 0.782 | 0.999 | 0.653 |
Download Data |
Period Mean (original grids) [W m-2] |
Model Period Mean (intersection) [W m-2] |
Benchmark Period Mean (intersection) [W m-2] |
Model Period Mean (complement) [W m-2] |
Benchmark Period Mean (complement) [W m-2] |
Bias [W m-2] |
RMSE [W m-2] |
Phase Shift [months] |
Bias Score [1] |
RMSE Score [1] |
Seasonal Cycle Score [1] |
Spatial Distribution Score [1] |
Overall Score [1] |
|||
|---|---|---|---|---|---|---|---|---|---|---|---|---|---|---|---|---|
| Benchmark | [-] | 71.2 | ||||||||||||||
| CLM50 | [-] | 72.7 | 72.8 | 70.2 | 71.8 | 1.77 | 14.1 | 0.255 | 0.653 | 0.554 | 0.983 | 0.997 | 0.748 | |||
| CTSM51 | [-] | 68.1 | 68.2 | 70.2 | 71.8 | -2.62 | 13.0 | 0.267 | 0.719 | 0.571 | 0.982 | 0.994 | 0.768 | |||
| DeadVeg | [-] | 69.2 | 69.3 | 71.0 | 73.0 | -2.25 | 13.6 | 0.189 | 0.733 | 0.538 | 0.987 | 0.922 | 0.744 |
Download Data |
Period Mean (original grids) [W m-2] |
Model Period Mean (intersection) [W m-2] |
Benchmark Period Mean (intersection) [W m-2] |
Model Period Mean (complement) [W m-2] |
Benchmark Period Mean (complement) [W m-2] |
Bias [W m-2] |
RMSE [W m-2] |
Phase Shift [months] |
Bias Score [1] |
RMSE Score [1] |
Seasonal Cycle Score [1] |
Spatial Distribution Score [1] |
Overall Score [1] |
|||
|---|---|---|---|---|---|---|---|---|---|---|---|---|---|---|---|---|
| Benchmark | [-] | 190. | ||||||||||||||
| CLM50 | [-] | 174. | 174. | 186. | 204. | -7.25 | 11.6 | 1.13 | 0.686 | 0.810 | 0.826 | 0.933 | 0.813 | |||
| CTSM51 | [-] | 168. | 167. | 186. | 204. | -13.9 | 16.2 | 1.15 | 0.493 | 0.810 | 0.821 | 0.946 | 0.776 | |||
| DeadVeg | [-] | 188. | 187. | 186. | 204. | 4.05 | 18.2 | 1.81 | 0.499 | 0.653 | 0.729 | 0.995 | 0.706 |
Download Data |
Period Mean (original grids) [W m-2] |
Model Period Mean (intersection) [W m-2] |
Benchmark Period Mean (intersection) [W m-2] |
Model Period Mean (complement) [W m-2] |
Benchmark Period Mean (complement) [W m-2] |
Bias [W m-2] |
RMSE [W m-2] |
Phase Shift [months] |
Bias Score [1] |
RMSE Score [1] |
Seasonal Cycle Score [1] |
Spatial Distribution Score [1] |
Overall Score [1] |
|||
|---|---|---|---|---|---|---|---|---|---|---|---|---|---|---|---|---|
| Benchmark | [-] | 100. | ||||||||||||||
| CLM50 | [-] | 101. | 101. | 99.1 | 116. | 2.38 | 10.7 | 0.184 | 0.692 | 0.645 | 0.988 | 0.983 | 0.791 | |||
| CTSM51 | [-] | 97.2 | 97.2 | 99.1 | 116. | -1.62 | 8.57 | 0.194 | 0.773 | 0.692 | 0.987 | 0.981 | 0.825 | |||
| DeadVeg | [-] | 96.2 | 96.1 | 99.9 | 117. | -3.74 | 12.6 | 0.377 | 0.601 | 0.580 | 0.974 | 0.994 | 0.746 |
Download Data |
Period Mean (original grids) [W m-2] |
Model Period Mean (intersection) [W m-2] |
Benchmark Period Mean (intersection) [W m-2] |
Model Period Mean (complement) [W m-2] |
Benchmark Period Mean (complement) [W m-2] |
Bias [W m-2] |
RMSE [W m-2] |
Phase Shift [months] |
Bias Score [1] |
RMSE Score [1] |
Seasonal Cycle Score [1] |
Spatial Distribution Score [1] |
Overall Score [1] |
|||
|---|---|---|---|---|---|---|---|---|---|---|---|---|---|---|---|---|
| Benchmark | [-] | 140. | ||||||||||||||
| CLM50 | [-] | 135. | 135. | 139. | 153. | -3.69 | 11.9 | 0.332 | 0.534 | 0.621 | 0.973 | 0.999 | 0.750 | |||
| CTSM51 | [-] | 134. | 134. | 139. | 153. | -5.45 | 12.3 | 0.324 | 0.518 | 0.611 | 0.974 | 0.998 | 0.742 | |||
| DeadVeg | [-] | 140. | 140. | 140. | 154. | -0.289 | 15.0 | 0.554 | 0.529 | 0.530 | 0.947 | 0.946 | 0.696 |
Download Data |
Period Mean (original grids) [W m-2] |
Model Period Mean (intersection) [W m-2] |
Benchmark Period Mean (intersection) [W m-2] |
Model Period Mean (complement) [W m-2] |
Benchmark Period Mean (complement) [W m-2] |
Bias [W m-2] |
RMSE [W m-2] |
Phase Shift [months] |
Bias Score [1] |
RMSE Score [1] |
Seasonal Cycle Score [1] |
Spatial Distribution Score [1] |
Overall Score [1] |
|||
|---|---|---|---|---|---|---|---|---|---|---|---|---|---|---|---|---|
| Benchmark | [-] | 182. | ||||||||||||||
| CLM50 | [-] | 174. | 174. | 180. | 205. | -4.53 | 13.5 | 0.346 | 0.589 | 0.670 | 0.970 | 0.930 | 0.766 | |||
| CTSM51 | [-] | 171. | 170. | 180. | 205. | -7.95 | 14.8 | 0.357 | 0.522 | 0.660 | 0.969 | 0.936 | 0.750 | |||
| DeadVeg | [-] | 179. | 178. | 180. | 205. | -1.10 | 18.5 | 0.561 | 0.569 | 0.485 | 0.950 | 0.998 | 0.697 |
Download Data |
Period Mean (original grids) [W m-2] |
Model Period Mean (intersection) [W m-2] |
Benchmark Period Mean (intersection) [W m-2] |
Model Period Mean (complement) [W m-2] |
Benchmark Period Mean (complement) [W m-2] |
Bias [W m-2] |
RMSE [W m-2] |
Phase Shift [months] |
Bias Score [1] |
RMSE Score [1] |
Seasonal Cycle Score [1] |
Spatial Distribution Score [1] |
Overall Score [1] |
|||
|---|---|---|---|---|---|---|---|---|---|---|---|---|---|---|---|---|
| Benchmark | [-] | 63.6 | ||||||||||||||
| CLM50 | [-] | 66.3 | 66.6 | 63.2 | 53.2 | 2.24 | 11.0 | 0.172 | 0.754 | 0.634 | 0.989 | 0.998 | 0.802 | |||
| CTSM51 | [-] | 60.6 | 61.0 | 63.2 | 53.2 | -3.12 | 11.2 | 0.155 | 0.768 | 0.605 | 0.990 | 0.998 | 0.793 | |||
| DeadVeg | [-] | 62.2 | 62.5 | 64.0 | 54.2 | -2.50 | 11.5 | 0.178 | 0.725 | 0.608 | 0.988 | 0.992 | 0.784 |
Download Data |
Period Mean (original grids) [W m-2] |
Model Period Mean (intersection) [W m-2] |
Benchmark Period Mean (intersection) [W m-2] |
Model Period Mean (complement) [W m-2] |
Benchmark Period Mean (complement) [W m-2] |
Bias [W m-2] |
RMSE [W m-2] |
Phase Shift [months] |
Bias Score [1] |
RMSE Score [1] |
Seasonal Cycle Score [1] |
Spatial Distribution Score [1] |
Overall Score [1] |
|||
|---|---|---|---|---|---|---|---|---|---|---|---|---|---|---|---|---|
| Benchmark | [-] | 199. | ||||||||||||||
| CLM50 | [-] | 192. | 192. | 200. | 198. | -9.27 | 11.7 | 0.412 | 0.492 | 0.760 | 0.967 | 0.997 | 0.795 | |||
| CTSM51 | [-] | 189. | 189. | 200. | 198. | -12.2 | 14.3 | 0.411 | 0.357 | 0.741 | 0.966 | 0.996 | 0.760 | |||
| DeadVeg | [-] | 198. | 198. | 199. | 197. | -2.86 | 12.0 | 0.696 | 0.605 | 0.635 | 0.942 | 0.981 | 0.760 |
Download Data |
Period Mean (original grids) [W m-2] |
Model Period Mean (intersection) [W m-2] |
Benchmark Period Mean (intersection) [W m-2] |
Model Period Mean (complement) [W m-2] |
Benchmark Period Mean (complement) [W m-2] |
Bias [W m-2] |
RMSE [W m-2] |
Phase Shift [months] |
Bias Score [1] |
RMSE Score [1] |
Seasonal Cycle Score [1] |
Spatial Distribution Score [1] |
Overall Score [1] |
|||
|---|---|---|---|---|---|---|---|---|---|---|---|---|---|---|---|---|
| Benchmark | [-] | 123. | ||||||||||||||
| CLM50 | [-] | 113. | 113. | 119. | 147. | -3.61 | 9.05 | 0.245 | 0.635 | 0.739 | 0.984 | 0.989 | 0.817 | |||
| CTSM51 | [-] | 110. | 110. | 119. | 147. | -6.92 | 10.5 | 0.240 | 0.550 | 0.712 | 0.984 | 0.991 | 0.790 | |||
| DeadVeg | [-] | 122. | 122. | 120. | 148. | 3.13 | 15.6 | 0.236 | 0.464 | 0.497 | 0.984 | 0.991 | 0.687 |
Download Data |
Period Mean (original grids) [W m-2] |
Model Period Mean (intersection) [W m-2] |
Benchmark Period Mean (intersection) [W m-2] |
Model Period Mean (complement) [W m-2] |
Benchmark Period Mean (complement) [W m-2] |
Bias [W m-2] |
RMSE [W m-2] |
Phase Shift [months] |
Bias Score [1] |
RMSE Score [1] |
Seasonal Cycle Score [1] |
Spatial Distribution Score [1] |
Overall Score [1] |
|||
|---|---|---|---|---|---|---|---|---|---|---|---|---|---|---|---|---|
| Benchmark | [-] | 144. | ||||||||||||||
| CLM50 | [-] | 136. | 136. | 142. | 173. | -4.51 | 11.7 | 0.368 | 0.599 | 0.696 | 0.961 | 0.998 | 0.790 | |||
| CTSM51 | [-] | 134. | 134. | 142. | 173. | -7.22 | 12.6 | 0.370 | 0.544 | 0.689 | 0.961 | 0.998 | 0.776 | |||
| DeadVeg | [-] | 141. | 141. | 142. | 174. | -0.620 | 20.1 | 0.775 | 0.494 | 0.540 | 0.908 | 0.942 | 0.685 |
Download Data |
Period Mean (original grids) [W m-2] |
Model Period Mean (intersection) [W m-2] |
Benchmark Period Mean (intersection) [W m-2] |
Model Period Mean (complement) [W m-2] |
Benchmark Period Mean (complement) [W m-2] |
Bias [W m-2] |
RMSE [W m-2] |
Phase Shift [months] |
Bias Score [1] |
RMSE Score [1] |
Seasonal Cycle Score [1] |
Spatial Distribution Score [1] |
Overall Score [1] |
|||
|---|---|---|---|---|---|---|---|---|---|---|---|---|---|---|---|---|
| Benchmark | [-] | 178. | ||||||||||||||
| CLM50 | [-] | 162. | 162. | 175. | 222. | -12.3 | 16.5 | 0.268 | 0.356 | 0.697 | 0.979 | 0.948 | 0.736 | |||
| CTSM51 | [-] | 162. | 162. | 175. | 222. | -12.7 | 16.7 | 0.261 | 0.344 | 0.698 | 0.979 | 0.947 | 0.733 | |||
| DeadVeg | [-] | 166. | 166. | 176. | 222. | -9.16 | 17.8 | 0.713 | 0.384 | 0.581 | 0.925 | 0.983 | 0.691 |
Download Data |
Period Mean (original grids) [W m-2] |
Model Period Mean (intersection) [W m-2] |
Benchmark Period Mean (intersection) [W m-2] |
Model Period Mean (complement) [W m-2] |
Benchmark Period Mean (complement) [W m-2] |
Bias [W m-2] |
RMSE [W m-2] |
Phase Shift [months] |
Bias Score [1] |
RMSE Score [1] |
Seasonal Cycle Score [1] |
Spatial Distribution Score [1] |
Overall Score [1] |
|||
|---|---|---|---|---|---|---|---|---|---|---|---|---|---|---|---|---|
| Benchmark | [-] | 70.2 | ||||||||||||||
| CLM50 | [-] | 70.1 | 70.0 | 69.4 | 70.3 | -0.771 | 13.1 | 0.0821 | 0.674 | 0.576 | 0.995 | 0.987 | 0.761 | |||
| CTSM51 | [-] | 67.0 | 66.9 | 69.4 | 70.3 | -3.63 | 13.4 | 0.0867 | 0.658 | 0.559 | 0.994 | 0.997 | 0.753 | |||
| DeadVeg | [-] | 70.5 | 70.3 | 70.1 | 71.1 | -0.853 | 11.3 | 0.110 | 0.715 | 0.631 | 0.993 | 0.997 | 0.793 |
Download Data |
Period Mean (original grids) [W m-2] |
Model Period Mean (intersection) [W m-2] |
Benchmark Period Mean (intersection) [W m-2] |
Model Period Mean (complement) [W m-2] |
Benchmark Period Mean (complement) [W m-2] |
Bias [W m-2] |
RMSE [W m-2] |
Phase Shift [months] |
Bias Score [1] |
RMSE Score [1] |
Seasonal Cycle Score [1] |
Spatial Distribution Score [1] |
Overall Score [1] |
|||
|---|---|---|---|---|---|---|---|---|---|---|---|---|---|---|---|---|
| Benchmark | [-] | 204. | ||||||||||||||
| CLM50 | [-] | 191. | 192. | 201. | 218. | -7.27 | 12.7 | 0.412 | 0.559 | 0.763 | 0.956 | 0.970 | 0.802 | |||
| CTSM51 | [-] | 187. | 188. | 201. | 218. | -11.0 | 14.5 | 0.408 | 0.471 | 0.768 | 0.955 | 0.974 | 0.787 | |||
| DeadVeg | [-] | 190. | 190. | 201. | 219. | -9.39 | 25.6 | 1.24 | 0.265 | 0.474 | 0.835 | 0.908 | 0.591 |
Download Data |
Period Mean (original grids) [W m-2] |
Model Period Mean (intersection) [W m-2] |
Benchmark Period Mean (intersection) [W m-2] |
Model Period Mean (complement) [W m-2] |
Benchmark Period Mean (complement) [W m-2] |
Bias [W m-2] |
RMSE [W m-2] |
Phase Shift [months] |
Bias Score [1] |
RMSE Score [1] |
Seasonal Cycle Score [1] |
Spatial Distribution Score [1] |
Overall Score [1] |
|||
|---|---|---|---|---|---|---|---|---|---|---|---|---|---|---|---|---|
| Benchmark | [-] | 152. | ||||||||||||||
| CLM50 | [-] | 144. | 144. | 149. | 191. | -3.70 | 7.09 | 0.255 | 0.744 | 0.783 | 0.983 | 0.989 | 0.856 | |||
| CTSM51 | [-] | 140. | 140. | 149. | 191. | -7.91 | 10.1 | 0.272 | 0.522 | 0.737 | 0.982 | 0.991 | 0.794 | |||
| DeadVeg | [-] | 144. | 144. | 150. | 192. | -4.96 | 12.5 | 0.515 | 0.682 | 0.573 | 0.965 | 0.950 | 0.748 |
Download Data |
Period Mean (original grids) [W m-2] |
Model Period Mean (intersection) [W m-2] |
Benchmark Period Mean (intersection) [W m-2] |
Model Period Mean (complement) [W m-2] |
Benchmark Period Mean (complement) [W m-2] |
Bias [W m-2] |
RMSE [W m-2] |
Phase Shift [months] |
Bias Score [1] |
RMSE Score [1] |
Seasonal Cycle Score [1] |
Spatial Distribution Score [1] |
Overall Score [1] |
|||
|---|---|---|---|---|---|---|---|---|---|---|---|---|---|---|---|---|
| Benchmark | [-] | 111. | ||||||||||||||
| CLM50 | [-] | 110. | 111. | 110. | 116. | 0.593 | 9.42 | 0.111 | 0.652 | 0.699 | 0.993 | 0.999 | 0.808 | |||
| CTSM51 | [-] | 105. | 105. | 110. | 116. | -4.73 | 10.4 | 0.113 | 0.589 | 0.656 | 0.993 | 0.994 | 0.777 | |||
| DeadVeg | [-] | 111. | 111. | 111. | 117. | -0.239 | 10.7 | 0.315 | 0.712 | 0.610 | 0.979 | 0.999 | 0.782 |
Download Data |
Period Mean (original grids) [W m-2] |
Model Period Mean (intersection) [W m-2] |
Benchmark Period Mean (intersection) [W m-2] |
Model Period Mean (complement) [W m-2] |
Benchmark Period Mean (complement) [W m-2] |
Bias [W m-2] |
RMSE [W m-2] |
Phase Shift [months] |
Bias Score [1] |
RMSE Score [1] |
Seasonal Cycle Score [1] |
Spatial Distribution Score [1] |
Overall Score [1] |
|||
|---|---|---|---|---|---|---|---|---|---|---|---|---|---|---|---|---|
| Benchmark | [-] | 165. | ||||||||||||||
| CLM50 | [-] | 159. | 159. | 164. | 166. | -4.61 | 10.4 | 0.133 | 0.582 | 0.672 | 0.991 | 0.975 | 0.779 | |||
| CTSM51 | [-] | 156. | 156. | 164. | 166. | -7.18 | 11.5 | 0.134 | 0.508 | 0.663 | 0.991 | 0.973 | 0.759 | |||
| DeadVeg | [-] | 151. | 152. | 165. | 167. | -12.8 | 16.5 | 0.294 | 0.295 | 0.563 | 0.980 | 0.964 | 0.673 |
Download Data |
Period Mean (original grids) [W m-2] |
Model Period Mean (intersection) [W m-2] |
Benchmark Period Mean (intersection) [W m-2] |
Model Period Mean (complement) [W m-2] |
Benchmark Period Mean (complement) [W m-2] |
Bias [W m-2] |
RMSE [W m-2] |
Phase Shift [months] |
Bias Score [1] |
RMSE Score [1] |
Seasonal Cycle Score [1] |
Spatial Distribution Score [1] |
Overall Score [1] |
|||
|---|---|---|---|---|---|---|---|---|---|---|---|---|---|---|---|---|
| Benchmark | [-] | 176. | ||||||||||||||
| CLM50 | [-] | 173. | 173. | 175. | 218. | -0.890 | 8.42 | 0.734 | 0.783 | 0.808 | 0.906 | 0.898 | 0.840 | |||
| CTSM51 | [-] | 166. | 166. | 175. | 218. | -7.59 | 11.5 | 0.723 | 0.588 | 0.818 | 0.907 | 0.932 | 0.813 | |||
| DeadVeg | [-] | 163. | 163. | 175. | 218. | -11.4 | 22.9 | 1.45 | 0.272 | 0.643 | 0.791 | 0.977 | 0.665 |
Download Data |
Period Mean (original grids) [W m-2] |
Model Period Mean (intersection) [W m-2] |
Benchmark Period Mean (intersection) [W m-2] |
Model Period Mean (complement) [W m-2] |
Benchmark Period Mean (complement) [W m-2] |
Bias [W m-2] |
RMSE [W m-2] |
Phase Shift [months] |
Bias Score [1] |
RMSE Score [1] |
Seasonal Cycle Score [1] |
Spatial Distribution Score [1] |
Overall Score [1] |
|||
|---|---|---|---|---|---|---|---|---|---|---|---|---|---|---|---|---|
| Benchmark | [-] | 185. | ||||||||||||||
| CLM50 | [-] | 179. | 180. | 184. | 204. | -4.72 | 9.62 | 0.517 | 0.730 | 0.774 | 0.940 | 0.982 | 0.840 | |||
| CTSM51 | [-] | 177. | 177. | 184. | 204. | -7.31 | 11.5 | 0.536 | 0.627 | 0.751 | 0.939 | 0.986 | 0.811 | |||
| DeadVeg | [-] | 173. | 174. | 184. | 203. | -10.5 | 17.9 | 1.04 | 0.397 | 0.673 | 0.873 | 0.938 | 0.711 |
Download Data |
Period Mean (original grids) [W m-2] |
Model Period Mean (intersection) [W m-2] |
Benchmark Period Mean (intersection) [W m-2] |
Model Period Mean (complement) [W m-2] |
Benchmark Period Mean (complement) [W m-2] |
Bias [W m-2] |
RMSE [W m-2] |
Phase Shift [months] |
Bias Score [1] |
RMSE Score [1] |
Seasonal Cycle Score [1] |
Spatial Distribution Score [1] |
Overall Score [1] |
|||
|---|---|---|---|---|---|---|---|---|---|---|---|---|---|---|---|---|
| Benchmark | [-] | 178. | ||||||||||||||
| CLM50 | [-] | 176. | 175. | 179. | 170. | -8.21 | 17.3 | 0.392 | 0.366 | 0.593 | 0.959 | 0.997 | 0.702 | |||
| CTSM51 | [-] | 173. | 172. | 179. | 170. | -10.8 | 18.8 | 0.394 | 0.302 | 0.564 | 0.959 | 0.998 | 0.677 | |||
| DeadVeg | [-] | 178. | 177. | 179. | 170. | -4.58 | 27.0 | 0.698 | 0.309 | 0.396 | 0.938 | 0.806 | 0.569 |
Temporally integrated period mean