Mean State
Download Data |
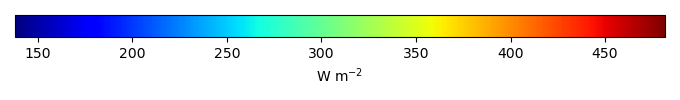
Period Mean (original grids) [W m-2] |
Model Period Mean (intersection) [W m-2] |
Benchmark Period Mean (intersection) [W m-2] |
Model Period Mean (complement) [W m-2] |
Benchmark Period Mean (complement) [W m-2] |
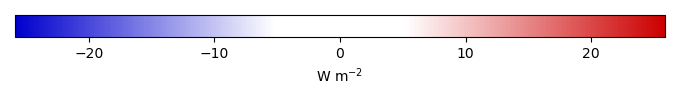
Bias [W m-2] |
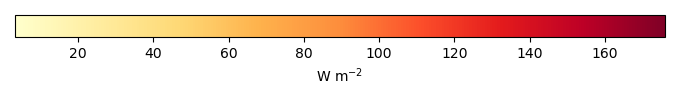
RMSE [W m-2] |
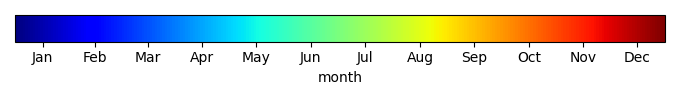
Phase Shift [months] |
Bias Score [1] |
RMSE Score [1] |
Seasonal Cycle Score [1] |
Spatial Distribution Score [1] |
Overall Score [1] |
|||
|---|---|---|---|---|---|---|---|---|---|---|---|---|---|---|---|---|
| Benchmark | [-] | 449. | ||||||||||||||
| CLM50 | [-] | 463. | 463. | 448. | 463. | 15.0 | 16.5 | 1.16 | 0.178 | 0.803 | 0.848 | 1.00 | 0.726 | |||
| CTSM51 | [-] | 462. | 462. | 448. | 463. | 14.3 | 16.0 | 1.12 | 0.188 | 0.802 | 0.856 | 0.999 | 0.730 | |||
| DeadVeg | [-] | 456. | 456. | 449. | 463. | 9.09 | 12.9 | 1.36 | 0.483 | 0.731 | 0.826 | 0.918 | 0.738 |
Download Data |
Period Mean (original grids) [W m-2] |
Model Period Mean (intersection) [W m-2] |
Benchmark Period Mean (intersection) [W m-2] |
Model Period Mean (complement) [W m-2] |
Benchmark Period Mean (complement) [W m-2] |
Bias [W m-2] |
RMSE [W m-2] |
Phase Shift [months] |
Bias Score [1] |
RMSE Score [1] |
Seasonal Cycle Score [1] |
Spatial Distribution Score [1] |
Overall Score [1] |
|||
|---|---|---|---|---|---|---|---|---|---|---|---|---|---|---|---|---|
| Benchmark | [-] | 466. | ||||||||||||||
| CLM50 | [-] | 483. | 483. | 466. | 458. | 16.9 | 20.0 | 0.379 | 0.241 | 0.660 | 0.969 | 0.966 | 0.699 | |||
| CTSM51 | [-] | 481. | 481. | 466. | 458. | 14.7 | 18.5 | 0.395 | 0.287 | 0.638 | 0.968 | 0.964 | 0.699 | |||
| DeadVeg | [-] | 473. | 474. | 466. | 458. | 7.26 | 19.7 | 0.796 | 0.384 | 0.353 | 0.928 | 0.993 | 0.602 |
Download Data |
Period Mean (original grids) [W m-2] |
Model Period Mean (intersection) [W m-2] |
Benchmark Period Mean (intersection) [W m-2] |
Model Period Mean (complement) [W m-2] |
Benchmark Period Mean (complement) [W m-2] |
Bias [W m-2] |
RMSE [W m-2] |
Phase Shift [months] |
Bias Score [1] |
RMSE Score [1] |
Seasonal Cycle Score [1] |
Spatial Distribution Score [1] |
Overall Score [1] |
|||
|---|---|---|---|---|---|---|---|---|---|---|---|---|---|---|---|---|
| Benchmark | [-] | 439. | ||||||||||||||
| CLM50 | [-] | 450. | 450. | 438. | 445. | 11.9 | 15.5 | 0.889 | 0.277 | 0.632 | 0.888 | 0.996 | 0.685 | |||
| CTSM51 | [-] | 449. | 449. | 438. | 445. | 11.1 | 15.2 | 0.880 | 0.306 | 0.624 | 0.891 | 0.998 | 0.688 | |||
| DeadVeg | [-] | 442. | 442. | 439. | 445. | 4.57 | 14.9 | 1.41 | 0.482 | 0.470 | 0.803 | 0.979 | 0.641 |
Download Data |
Period Mean (original grids) [W m-2] |
Model Period Mean (intersection) [W m-2] |
Benchmark Period Mean (intersection) [W m-2] |
Model Period Mean (complement) [W m-2] |
Benchmark Period Mean (complement) [W m-2] |
Bias [W m-2] |
RMSE [W m-2] |
Phase Shift [months] |
Bias Score [1] |
RMSE Score [1] |
Seasonal Cycle Score [1] |
Spatial Distribution Score [1] |
Overall Score [1] |
|||
|---|---|---|---|---|---|---|---|---|---|---|---|---|---|---|---|---|
| Benchmark | [-] | 285. | ||||||||||||||
| CLM50 | [-] | 278. | 278. | 283. | 301. | -2.06 | 11.8 | 0.122 | 0.593 | 0.512 | 0.991 | 0.996 | 0.721 | |||
| CTSM51 | [-] | 275. | 275. | 283. | 301. | -4.48 | 11.9 | 0.125 | 0.541 | 0.507 | 0.991 | 0.996 | 0.709 | |||
| DeadVeg | [-] | 270. | 270. | 284. | 302. | -11.0 | 16.1 | 0.128 | 0.227 | 0.424 | 0.990 | 0.997 | 0.613 |
Download Data |
Period Mean (original grids) [W m-2] |
Model Period Mean (intersection) [W m-2] |
Benchmark Period Mean (intersection) [W m-2] |
Model Period Mean (complement) [W m-2] |
Benchmark Period Mean (complement) [W m-2] |
Bias [W m-2] |
RMSE [W m-2] |
Phase Shift [months] |
Bias Score [1] |
RMSE Score [1] |
Seasonal Cycle Score [1] |
Spatial Distribution Score [1] |
Overall Score [1] |
|||
|---|---|---|---|---|---|---|---|---|---|---|---|---|---|---|---|---|
| Benchmark | [-] | 455. | ||||||||||||||
| CLM50 | [-] | 459. | 459. | 451. | 467. | 8.45 | 14.0 | 1.48 | 0.217 | 0.853 | 0.780 | 0.702 | 0.681 | |||
| CTSM51 | [-] | 458. | 458. | 451. | 467. | 7.88 | 13.9 | 1.68 | 0.222 | 0.853 | 0.745 | 0.704 | 0.675 | |||
| DeadVeg | [-] | 455. | 456. | 451. | 467. | 6.76 | 14.4 | 2.13 | 0.253 | 0.794 | 0.668 | 0.992 | 0.700 |
Download Data |
Period Mean (original grids) [W m-2] |
Model Period Mean (intersection) [W m-2] |
Benchmark Period Mean (intersection) [W m-2] |
Model Period Mean (complement) [W m-2] |
Benchmark Period Mean (complement) [W m-2] |
Bias [W m-2] |
RMSE [W m-2] |
Phase Shift [months] |
Bias Score [1] |
RMSE Score [1] |
Seasonal Cycle Score [1] |
Spatial Distribution Score [1] |
Overall Score [1] |
|||
|---|---|---|---|---|---|---|---|---|---|---|---|---|---|---|---|---|
| Benchmark | [-] | 312. | ||||||||||||||
| CLM50 | [-] | 317. | 317. | 311. | 337. | 6.09 | 11.0 | 0.0363 | 0.412 | 0.669 | 0.998 | 0.998 | 0.749 | |||
| CTSM51 | [-] | 313. | 313. | 311. | 337. | 2.08 | 9.14 | 0.0360 | 0.632 | 0.634 | 0.998 | 0.998 | 0.779 | |||
| DeadVeg | [-] | 308. | 308. | 312. | 337. | -3.80 | 8.96 | 0.0414 | 0.563 | 0.658 | 0.997 | 0.971 | 0.769 |
Download Data |
Period Mean (original grids) [W m-2] |
Model Period Mean (intersection) [W m-2] |
Benchmark Period Mean (intersection) [W m-2] |
Model Period Mean (complement) [W m-2] |
Benchmark Period Mean (complement) [W m-2] |
Bias [W m-2] |
RMSE [W m-2] |
Phase Shift [months] |
Bias Score [1] |
RMSE Score [1] |
Seasonal Cycle Score [1] |
Spatial Distribution Score [1] |
Overall Score [1] |
|||
|---|---|---|---|---|---|---|---|---|---|---|---|---|---|---|---|---|
| Benchmark | [-] | 365. | ||||||||||||||
| CLM50 | [-] | 366. | 365. | 363. | 410. | 3.75 | 11.3 | 0.139 | 0.513 | 0.671 | 0.990 | 1.00 | 0.769 | |||
| CTSM51 | [-] | 364. | 364. | 363. | 410. | 2.31 | 10.7 | 0.154 | 0.571 | 0.659 | 0.989 | 1.00 | 0.776 | |||
| DeadVeg | [-] | 359. | 359. | 364. | 411. | -3.73 | 12.9 | 0.255 | 0.501 | 0.605 | 0.981 | 0.981 | 0.735 |
Download Data |
Period Mean (original grids) [W m-2] |
Model Period Mean (intersection) [W m-2] |
Benchmark Period Mean (intersection) [W m-2] |
Model Period Mean (complement) [W m-2] |
Benchmark Period Mean (complement) [W m-2] |
Bias [W m-2] |
RMSE [W m-2] |
Phase Shift [months] |
Bias Score [1] |
RMSE Score [1] |
Seasonal Cycle Score [1] |
Spatial Distribution Score [1] |
Overall Score [1] |
|||
|---|---|---|---|---|---|---|---|---|---|---|---|---|---|---|---|---|
| Benchmark | [-] | 446. | ||||||||||||||
| CLM50 | [-] | 453. | 453. | 444. | 466. | 11.1 | 15.5 | 0.578 | 0.297 | 0.614 | 0.943 | 0.998 | 0.693 | |||
| CTSM51 | [-] | 451. | 452. | 444. | 466. | 9.66 | 14.7 | 0.581 | 0.338 | 0.611 | 0.942 | 0.999 | 0.700 | |||
| DeadVeg | [-] | 454. | 455. | 445. | 467. | 12.1 | 19.2 | 0.711 | 0.238 | 0.481 | 0.929 | 0.977 | 0.621 |
Download Data |
Period Mean (original grids) [W m-2] |
Model Period Mean (intersection) [W m-2] |
Benchmark Period Mean (intersection) [W m-2] |
Model Period Mean (complement) [W m-2] |
Benchmark Period Mean (complement) [W m-2] |
Bias [W m-2] |
RMSE [W m-2] |
Phase Shift [months] |
Bias Score [1] |
RMSE Score [1] |
Seasonal Cycle Score [1] |
Spatial Distribution Score [1] |
Overall Score [1] |
|||
|---|---|---|---|---|---|---|---|---|---|---|---|---|---|---|---|---|
| Benchmark | [-] | 284. | ||||||||||||||
| CLM50 | [-] | 284. | 285. | 282. | 294. | 3.30 | 10.6 | 0.0865 | 0.521 | 0.631 | 0.994 | 0.986 | 0.753 | |||
| CTSM51 | [-] | 281. | 281. | 282. | 294. | -0.153 | 9.35 | 0.0874 | 0.667 | 0.615 | 0.994 | 0.990 | 0.776 | |||
| DeadVeg | [-] | 276. | 277. | 283. | 295. | -5.78 | 10.9 | 0.0766 | 0.534 | 0.552 | 0.995 | 0.982 | 0.723 |
Download Data |
Period Mean (original grids) [W m-2] |
Model Period Mean (intersection) [W m-2] |
Benchmark Period Mean (intersection) [W m-2] |
Model Period Mean (complement) [W m-2] |
Benchmark Period Mean (complement) [W m-2] |
Bias [W m-2] |
RMSE [W m-2] |
Phase Shift [months] |
Bias Score [1] |
RMSE Score [1] |
Seasonal Cycle Score [1] |
Spatial Distribution Score [1] |
Overall Score [1] |
|||
|---|---|---|---|---|---|---|---|---|---|---|---|---|---|---|---|---|
| Benchmark | [-] | 441. | ||||||||||||||
| CLM50 | [-] | 449. | 449. | 441. | 424. | 4.43 | 9.72 | 0.261 | 0.614 | 0.743 | 0.979 | 0.999 | 0.815 | |||
| CTSM51 | [-] | 447. | 447. | 441. | 424. | 3.26 | 9.42 | 0.289 | 0.644 | 0.733 | 0.976 | 0.999 | 0.817 | |||
| DeadVeg | [-] | 445. | 446. | 442. | 425. | 1.37 | 11.7 | 0.320 | 0.578 | 0.677 | 0.973 | 0.999 | 0.781 |
Download Data |
Period Mean (original grids) [W m-2] |
Model Period Mean (intersection) [W m-2] |
Benchmark Period Mean (intersection) [W m-2] |
Model Period Mean (complement) [W m-2] |
Benchmark Period Mean (complement) [W m-2] |
Bias [W m-2] |
RMSE [W m-2] |
Phase Shift [months] |
Bias Score [1] |
RMSE Score [1] |
Seasonal Cycle Score [1] |
Spatial Distribution Score [1] |
Overall Score [1] |
|||
|---|---|---|---|---|---|---|---|---|---|---|---|---|---|---|---|---|
| Benchmark | [-] | 366. | ||||||||||||||
| CLM50 | [-] | 365. | 365. | 363. | 389. | 4.72 | 11.1 | 0.400 | 0.427 | 0.715 | 0.973 | 0.997 | 0.766 | |||
| CTSM51 | [-] | 361. | 362. | 363. | 389. | 1.84 | 10.2 | 0.442 | 0.531 | 0.672 | 0.970 | 0.995 | 0.768 | |||
| DeadVeg | [-] | 362. | 362. | 363. | 389. | 1.27 | 11.9 | 0.347 | 0.497 | 0.597 | 0.977 | 0.992 | 0.732 |
Download Data |
Period Mean (original grids) [W m-2] |
Model Period Mean (intersection) [W m-2] |
Benchmark Period Mean (intersection) [W m-2] |
Model Period Mean (complement) [W m-2] |
Benchmark Period Mean (complement) [W m-2] |
Bias [W m-2] |
RMSE [W m-2] |
Phase Shift [months] |
Bias Score [1] |
RMSE Score [1] |
Seasonal Cycle Score [1] |
Spatial Distribution Score [1] |
Overall Score [1] |
|||
|---|---|---|---|---|---|---|---|---|---|---|---|---|---|---|---|---|
| Benchmark | [-] | 377. | ||||||||||||||
| CLM50 | [-] | 381. | 381. | 375. | 413. | 7.77 | 13.5 | 0.449 | 0.407 | 0.694 | 0.953 | 0.999 | 0.750 | |||
| CTSM51 | [-] | 380. | 380. | 375. | 413. | 6.47 | 12.9 | 0.457 | 0.459 | 0.682 | 0.952 | 0.999 | 0.755 | |||
| DeadVeg | [-] | 386. | 386. | 376. | 413. | 12.2 | 23.5 | 0.662 | 0.475 | 0.614 | 0.925 | 0.834 | 0.692 |
Download Data |
Period Mean (original grids) [W m-2] |
Model Period Mean (intersection) [W m-2] |
Benchmark Period Mean (intersection) [W m-2] |
Model Period Mean (complement) [W m-2] |
Benchmark Period Mean (complement) [W m-2] |
Bias [W m-2] |
RMSE [W m-2] |
Phase Shift [months] |
Bias Score [1] |
RMSE Score [1] |
Seasonal Cycle Score [1] |
Spatial Distribution Score [1] |
Overall Score [1] |
|||
|---|---|---|---|---|---|---|---|---|---|---|---|---|---|---|---|---|
| Benchmark | [-] | 452. | ||||||||||||||
| CLM50 | [-] | 452. | 452. | 451. | 444. | 0.705 | 11.0 | 0.438 | 0.676 | 0.707 | 0.964 | 1.00 | 0.811 | |||
| CTSM51 | [-] | 452. | 452. | 451. | 444. | 0.418 | 11.0 | 0.462 | 0.680 | 0.702 | 0.962 | 1.00 | 0.809 | |||
| DeadVeg | [-] | 449. | 449. | 452. | 444. | -2.05 | 12.5 | 0.426 | 0.622 | 0.696 | 0.967 | 0.996 | 0.795 |
Download Data |
Period Mean (original grids) [W m-2] |
Model Period Mean (intersection) [W m-2] |
Benchmark Period Mean (intersection) [W m-2] |
Model Period Mean (complement) [W m-2] |
Benchmark Period Mean (complement) [W m-2] |
Bias [W m-2] |
RMSE [W m-2] |
Phase Shift [months] |
Bias Score [1] |
RMSE Score [1] |
Seasonal Cycle Score [1] |
Spatial Distribution Score [1] |
Overall Score [1] |
|||
|---|---|---|---|---|---|---|---|---|---|---|---|---|---|---|---|---|
| Benchmark | [-] | 287. | ||||||||||||||
| CLM50 | [-] | 286. | 286. | 286. | 300. | 0.675 | 11.7 | 0.160 | 0.501 | 0.558 | 0.988 | 0.964 | 0.714 | |||
| CTSM51 | [-] | 284. | 284. | 286. | 300. | -1.58 | 11.3 | 0.166 | 0.567 | 0.536 | 0.988 | 0.979 | 0.721 | |||
| DeadVeg | [-] | 279. | 279. | 287. | 300. | -7.79 | 14.3 | 0.138 | 0.420 | 0.477 | 0.989 | 0.943 | 0.661 |
Download Data |
Period Mean (original grids) [W m-2] |
Model Period Mean (intersection) [W m-2] |
Benchmark Period Mean (intersection) [W m-2] |
Model Period Mean (complement) [W m-2] |
Benchmark Period Mean (complement) [W m-2] |
Bias [W m-2] |
RMSE [W m-2] |
Phase Shift [months] |
Bias Score [1] |
RMSE Score [1] |
Seasonal Cycle Score [1] |
Spatial Distribution Score [1] |
Overall Score [1] |
|||
|---|---|---|---|---|---|---|---|---|---|---|---|---|---|---|---|---|
| Benchmark | [-] | 442. | ||||||||||||||
| CLM50 | [-] | 446. | 446. | 438. | 458. | 12.0 | 15.8 | 0.792 | 0.294 | 0.695 | 0.905 | 0.987 | 0.715 | |||
| CTSM51 | [-] | 446. | 446. | 438. | 458. | 11.5 | 15.6 | 0.775 | 0.306 | 0.680 | 0.905 | 0.986 | 0.712 | |||
| DeadVeg | [-] | 442. | 442. | 439. | 459. | 8.88 | 15.8 | 1.03 | 0.372 | 0.587 | 0.870 | 0.981 | 0.679 |
Download Data |
Period Mean (original grids) [W m-2] |
Model Period Mean (intersection) [W m-2] |
Benchmark Period Mean (intersection) [W m-2] |
Model Period Mean (complement) [W m-2] |
Benchmark Period Mean (complement) [W m-2] |
Bias [W m-2] |
RMSE [W m-2] |
Phase Shift [months] |
Bias Score [1] |
RMSE Score [1] |
Seasonal Cycle Score [1] |
Spatial Distribution Score [1] |
Overall Score [1] |
|||
|---|---|---|---|---|---|---|---|---|---|---|---|---|---|---|---|---|
| Benchmark | [-] | 384. | ||||||||||||||
| CLM50 | [-] | 389. | 389. | 381. | 433. | 10.8 | 13.8 | 0.236 | 0.165 | 0.796 | 0.984 | 1.00 | 0.748 | |||
| CTSM51 | [-] | 388. | 388. | 381. | 433. | 9.81 | 13.1 | 0.222 | 0.207 | 0.788 | 0.985 | 1.00 | 0.753 | |||
| DeadVeg | [-] | 386. | 386. | 382. | 433. | 6.18 | 11.3 | 0.293 | 0.385 | 0.703 | 0.980 | 0.999 | 0.754 |
Download Data |
Period Mean (original grids) [W m-2] |
Model Period Mean (intersection) [W m-2] |
Benchmark Period Mean (intersection) [W m-2] |
Model Period Mean (complement) [W m-2] |
Benchmark Period Mean (complement) [W m-2] |
Bias [W m-2] |
RMSE [W m-2] |
Phase Shift [months] |
Bias Score [1] |
RMSE Score [1] |
Seasonal Cycle Score [1] |
Spatial Distribution Score [1] |
Overall Score [1] |
|||
|---|---|---|---|---|---|---|---|---|---|---|---|---|---|---|---|---|
| Benchmark | [-] | 323. | ||||||||||||||
| CLM50 | [-] | 328. | 328. | 322. | 348. | 6.89 | 10.5 | 0.126 | 0.390 | 0.745 | 0.992 | 0.995 | 0.773 | |||
| CTSM51 | [-] | 325. | 325. | 322. | 348. | 4.43 | 9.32 | 0.123 | 0.533 | 0.702 | 0.992 | 0.999 | 0.786 | |||
| DeadVeg | [-] | 321. | 321. | 323. | 348. | -0.372 | 8.23 | 0.218 | 0.688 | 0.657 | 0.985 | 0.999 | 0.797 |
Download Data |
Period Mean (original grids) [W m-2] |
Model Period Mean (intersection) [W m-2] |
Benchmark Period Mean (intersection) [W m-2] |
Model Period Mean (complement) [W m-2] |
Benchmark Period Mean (complement) [W m-2] |
Bias [W m-2] |
RMSE [W m-2] |
Phase Shift [months] |
Bias Score [1] |
RMSE Score [1] |
Seasonal Cycle Score [1] |
Spatial Distribution Score [1] |
Overall Score [1] |
|||
|---|---|---|---|---|---|---|---|---|---|---|---|---|---|---|---|---|
| Benchmark | [-] | 376. | ||||||||||||||
| CLM50 | [-] | 380. | 381. | 375. | 378. | 6.67 | 10.9 | 0.129 | 0.461 | 0.756 | 0.991 | 0.996 | 0.792 | |||
| CTSM51 | [-] | 379. | 380. | 375. | 378. | 4.94 | 9.85 | 0.129 | 0.529 | 0.749 | 0.991 | 0.999 | 0.804 | |||
| DeadVeg | [-] | 372. | 373. | 376. | 379. | -2.16 | 9.23 | 0.149 | 0.609 | 0.701 | 0.989 | 1.00 | 0.800 |
Download Data |
Period Mean (original grids) [W m-2] |
Model Period Mean (intersection) [W m-2] |
Benchmark Period Mean (intersection) [W m-2] |
Model Period Mean (complement) [W m-2] |
Benchmark Period Mean (complement) [W m-2] |
Bias [W m-2] |
RMSE [W m-2] |
Phase Shift [months] |
Bias Score [1] |
RMSE Score [1] |
Seasonal Cycle Score [1] |
Spatial Distribution Score [1] |
Overall Score [1] |
|||
|---|---|---|---|---|---|---|---|---|---|---|---|---|---|---|---|---|
| Benchmark | [-] | 444. | ||||||||||||||
| CLM50 | [-] | 457. | 457. | 443. | 462. | 14.2 | 16.0 | 1.19 | 0.121 | 0.809 | 0.854 | 0.980 | 0.714 | |||
| CTSM51 | [-] | 457. | 457. | 443. | 462. | 14.0 | 15.9 | 1.18 | 0.123 | 0.814 | 0.854 | 0.974 | 0.716 | |||
| DeadVeg | [-] | 450. | 450. | 443. | 462. | 7.45 | 10.7 | 1.45 | 0.395 | 0.776 | 0.810 | 0.953 | 0.742 |
Download Data |
Period Mean (original grids) [W m-2] |
Model Period Mean (intersection) [W m-2] |
Benchmark Period Mean (intersection) [W m-2] |
Model Period Mean (complement) [W m-2] |
Benchmark Period Mean (complement) [W m-2] |
Bias [W m-2] |
RMSE [W m-2] |
Phase Shift [months] |
Bias Score [1] |
RMSE Score [1] |
Seasonal Cycle Score [1] |
Spatial Distribution Score [1] |
Overall Score [1] |
|||
|---|---|---|---|---|---|---|---|---|---|---|---|---|---|---|---|---|
| Benchmark | [-] | 434. | ||||||||||||||
| CLM50 | [-] | 448. | 448. | 434. | 431. | 13.4 | 14.9 | 0.698 | 0.219 | 0.724 | 0.908 | 0.984 | 0.712 | |||
| CTSM51 | [-] | 447. | 447. | 434. | 431. | 12.6 | 14.1 | 0.651 | 0.246 | 0.728 | 0.916 | 0.979 | 0.719 | |||
| DeadVeg | [-] | 441. | 440. | 434. | 431. | 6.43 | 10.2 | 0.850 | 0.486 | 0.662 | 0.880 | 0.993 | 0.736 |
Download Data |
Period Mean (original grids) [W m-2] |
Model Period Mean (intersection) [W m-2] |
Benchmark Period Mean (intersection) [W m-2] |
Model Period Mean (complement) [W m-2] |
Benchmark Period Mean (complement) [W m-2] |
Bias [W m-2] |
RMSE [W m-2] |
Phase Shift [months] |
Bias Score [1] |
RMSE Score [1] |
Seasonal Cycle Score [1] |
Spatial Distribution Score [1] |
Overall Score [1] |
|||
|---|---|---|---|---|---|---|---|---|---|---|---|---|---|---|---|---|
| Benchmark | [-] | 382. | ||||||||||||||
| CLM50 | [-] | 387. | 386. | 381. | 394. | 6.16 | 14.4 | 0.492 | 0.364 | 0.725 | 0.949 | 0.999 | 0.752 | |||
| CTSM51 | [-] | 387. | 386. | 381. | 394. | 5.99 | 14.3 | 0.501 | 0.375 | 0.711 | 0.951 | 0.999 | 0.749 | |||
| DeadVeg | [-] | 380. | 379. | 381. | 394. | 1.40 | 17.8 | 0.624 | 0.334 | 0.638 | 0.929 | 0.986 | 0.705 |
Temporally integrated period mean