Mean State
Download Data |
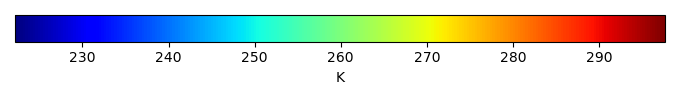
Period Mean (original grids) [K] |
Model Period Mean (intersection) [K] |
Benchmark Period Mean (intersection) [K] |
Model Period Mean (complement) [K] |
Benchmark Period Mean (complement) [K] |
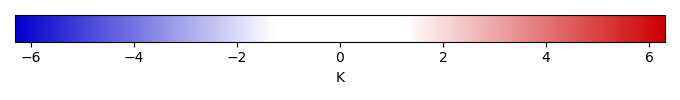
Bias [K] |
RMSE [K] |
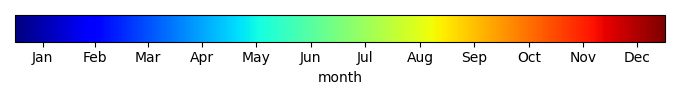
Phase Shift [months] |
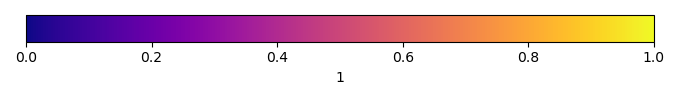
Bias Score [1] |
RMSE Score [1] |
Seasonal Cycle Score [1] |
Spatial Distribution Score [1] |
Overall Score [1] |
|||
|---|---|---|---|---|---|---|---|---|---|---|---|---|---|---|---|---|
| Benchmark | [-] | 293. | ||||||||||||||
| CTSM51_CRUJRA | [-] | 295. | 295. | 293. | 297. | 296. | 2.12 | 2.29 | 0.687 | 0.157 | 0.688 | 0.927 | 1.00 | 0.692 | ||
| CTSM51_CRUJRA_FLDS | [-] | 295. | 294. | 293. | 297. | 296. | 1.70 | 1.91 | 0.753 | 0.219 | 0.644 | 0.919 | 0.998 | 0.685 | ||
| CTSM51_CRUNCEPV7 | [-] | 295. | 295. | 293. | 298. | 296. | 2.47 | 2.61 | 0.715 | 0.121 | 0.680 | 0.922 | 1.00 | 0.681 | ||
| CTSM51_GSWP3V1 | [-] | 294. | 294. | 293. | 297. | 296. | 1.24 | 1.57 | 0.609 | 0.281 | 0.667 | 0.933 | 1.00 | 0.710 |
Download Data |
Period Mean (original grids) [K] |
Model Period Mean (intersection) [K] |
Benchmark Period Mean (intersection) [K] |
Model Period Mean (complement) [K] |
Benchmark Period Mean (complement) [K] |
Bias [K] |
RMSE [K] |
Phase Shift [months] |
Bias Score [1] |
RMSE Score [1] |
Seasonal Cycle Score [1] |
Spatial Distribution Score [1] |
Overall Score [1] |
|||
|---|---|---|---|---|---|---|---|---|---|---|---|---|---|---|---|---|
| Benchmark | [-] | 293. | ||||||||||||||
| CTSM51_CRUJRA | [-] | 295. | 295. | 293. | 298. | 294. | 2.39 | 2.66 | 0.318 | 0.421 | 0.761 | 0.972 | 0.972 | 0.778 | ||
| CTSM51_CRUJRA_FLDS | [-] | 295. | 295. | 293. | 298. | 294. | 1.76 | 2.22 | 0.379 | 0.512 | 0.747 | 0.967 | 0.931 | 0.781 | ||
| CTSM51_CRUNCEPV7 | [-] | 295. | 295. | 293. | 297. | 294. | 1.69 | 2.41 | 0.417 | 0.508 | 0.712 | 0.956 | 0.954 | 0.768 | ||
| CTSM51_GSWP3V1 | [-] | 294. | 294. | 293. | 297. | 294. | 1.13 | 1.58 | 0.308 | 0.605 | 0.823 | 0.972 | 0.975 | 0.840 |
Download Data |
Period Mean (original grids) [K] |
Model Period Mean (intersection) [K] |
Benchmark Period Mean (intersection) [K] |
Model Period Mean (complement) [K] |
Benchmark Period Mean (complement) [K] |
Bias [K] |
RMSE [K] |
Phase Shift [months] |
Bias Score [1] |
RMSE Score [1] |
Seasonal Cycle Score [1] |
Spatial Distribution Score [1] |
Overall Score [1] |
|||
|---|---|---|---|---|---|---|---|---|---|---|---|---|---|---|---|---|
| Benchmark | [-] | 289. | ||||||||||||||
| CTSM51_CRUJRA | [-] | 291. | 291. | 289. | 294. | 290. | 2.48 | 2.72 | 0.620 | 0.427 | 0.833 | 0.928 | 1.00 | 0.804 | ||
| CTSM51_CRUJRA_FLDS | [-] | 290. | 290. | 289. | 293. | 290. | 1.94 | 2.22 | 0.600 | 0.498 | 0.841 | 0.930 | 1.00 | 0.822 | ||
| CTSM51_CRUNCEPV7 | [-] | 291. | 291. | 289. | 294. | 290. | 2.69 | 2.86 | 0.753 | 0.407 | 0.832 | 0.905 | 0.996 | 0.795 | ||
| CTSM51_GSWP3V1 | [-] | 290. | 289. | 289. | 293. | 290. | 1.22 | 1.61 | 0.531 | 0.597 | 0.872 | 0.938 | 0.999 | 0.856 |
Download Data |
Period Mean (original grids) [K] |
Model Period Mean (intersection) [K] |
Benchmark Period Mean (intersection) [K] |
Model Period Mean (complement) [K] |
Benchmark Period Mean (complement) [K] |
Bias [K] |
RMSE [K] |
Phase Shift [months] |
Bias Score [1] |
RMSE Score [1] |
Seasonal Cycle Score [1] |
Spatial Distribution Score [1] |
Overall Score [1] |
|||
|---|---|---|---|---|---|---|---|---|---|---|---|---|---|---|---|---|
| Benchmark | [-] | 257. | ||||||||||||||
| CTSM51_CRUJRA | [-] | 256. | 256. | 257. | 260. | 263. | -0.455 | 2.41 | 0.0345 | 0.895 | 0.909 | 0.998 | 0.975 | 0.937 | ||
| CTSM51_CRUJRA_FLDS | [-] | 257. | 257. | 257. | 261. | 263. | 0.798 | 2.28 | 0.0299 | 0.902 | 0.917 | 0.998 | 0.958 | 0.938 | ||
| CTSM51_CRUNCEPV7 | [-] | 255. | 255. | 257. | 260. | 263. | -0.744 | 2.24 | 0.0653 | 0.899 | 0.912 | 0.996 | 0.999 | 0.944 | ||
| CTSM51_GSWP3V1 | [-] | 257. | 256. | 257. | 262. | 263. | 0.506 | 1.81 | 0.0453 | 0.907 | 0.942 | 0.997 | 0.998 | 0.957 |
Download Data |
Period Mean (original grids) [K] |
Model Period Mean (intersection) [K] |
Benchmark Period Mean (intersection) [K] |
Model Period Mean (complement) [K] |
Benchmark Period Mean (complement) [K] |
Bias [K] |
RMSE [K] |
Phase Shift [months] |
Bias Score [1] |
RMSE Score [1] |
Seasonal Cycle Score [1] |
Spatial Distribution Score [1] |
Overall Score [1] |
|||
|---|---|---|---|---|---|---|---|---|---|---|---|---|---|---|---|---|
| Benchmark | [-] | 294. | ||||||||||||||
| CTSM51_CRUJRA | [-] | 297. | 296. | 294. | 297. | 295. | 2.60 | 2.92 | 1.80 | 0.0868 | 0.643 | 0.716 | 0.962 | 0.610 | ||
| CTSM51_CRUJRA_FLDS | [-] | 296. | 296. | 294. | 297. | 295. | 2.08 | 2.40 | 1.78 | 0.146 | 0.626 | 0.732 | 0.869 | 0.600 | ||
| CTSM51_CRUNCEPV7 | [-] | 297. | 297. | 294. | 298. | 295. | 3.41 | 3.56 | 1.78 | 0.0440 | 0.628 | 0.727 | 0.862 | 0.578 | ||
| CTSM51_GSWP3V1 | [-] | 296. | 296. | 294. | 297. | 295. | 1.75 | 2.15 | 1.40 | 0.171 | 0.715 | 0.783 | 0.887 | 0.654 |
Download Data |
Period Mean (original grids) [K] |
Model Period Mean (intersection) [K] |
Benchmark Period Mean (intersection) [K] |
Model Period Mean (complement) [K] |
Benchmark Period Mean (complement) [K] |
Bias [K] |
RMSE [K] |
Phase Shift [months] |
Bias Score [1] |
RMSE Score [1] |
Seasonal Cycle Score [1] |
Spatial Distribution Score [1] |
Overall Score [1] |
|||
|---|---|---|---|---|---|---|---|---|---|---|---|---|---|---|---|---|
| Benchmark | [-] | 266. | ||||||||||||||
| CTSM51_CRUJRA | [-] | 265. | 265. | 266. | 270. | 270. | -0.546 | 1.90 | 0.0292 | 0.905 | 0.910 | 0.998 | 0.991 | 0.943 | ||
| CTSM51_CRUJRA_FLDS | [-] | 266. | 266. | 266. | 270. | 270. | 0.207 | 1.37 | 0.0282 | 0.934 | 0.942 | 0.998 | 0.994 | 0.962 | ||
| CTSM51_CRUNCEPV7 | [-] | 265. | 265. | 266. | 270. | 270. | -0.135 | 1.75 | 0.0314 | 0.914 | 0.919 | 0.998 | 0.994 | 0.949 | ||
| CTSM51_GSWP3V1 | [-] | 265. | 265. | 266. | 270. | 270. | -0.219 | 1.22 | 0.0275 | 0.932 | 0.953 | 0.998 | 0.997 | 0.967 |
Download Data |
Period Mean (original grids) [K] |
Model Period Mean (intersection) [K] |
Benchmark Period Mean (intersection) [K] |
Model Period Mean (complement) [K] |
Benchmark Period Mean (complement) [K] |
Bias [K] |
RMSE [K] |
Phase Shift [months] |
Bias Score [1] |
RMSE Score [1] |
Seasonal Cycle Score [1] |
Spatial Distribution Score [1] |
Overall Score [1] |
|||
|---|---|---|---|---|---|---|---|---|---|---|---|---|---|---|---|---|
| Benchmark | [-] | 274. | ||||||||||||||
| CTSM51_CRUJRA | [-] | 275. | 275. | 274. | 284. | 280. | 1.07 | 2.39 | 0.0294 | 0.825 | 0.910 | 0.998 | 0.999 | 0.928 | ||
| CTSM51_CRUJRA_FLDS | [-] | 275. | 275. | 274. | 284. | 280. | 1.07 | 2.12 | 0.0202 | 0.840 | 0.926 | 0.999 | 1.00 | 0.938 | ||
| CTSM51_CRUNCEPV7 | [-] | 275. | 275. | 274. | 285. | 280. | 0.900 | 2.40 | 0.0344 | 0.832 | 0.897 | 0.998 | 1.00 | 0.925 | ||
| CTSM51_GSWP3V1 | [-] | 275. | 275. | 274. | 284. | 280. | 0.758 | 1.91 | 0.0270 | 0.845 | 0.942 | 0.998 | 1.00 | 0.946 |
Download Data |
Period Mean (original grids) [K] |
Model Period Mean (intersection) [K] |
Benchmark Period Mean (intersection) [K] |
Model Period Mean (complement) [K] |
Benchmark Period Mean (complement) [K] |
Bias [K] |
RMSE [K] |
Phase Shift [months] |
Bias Score [1] |
RMSE Score [1] |
Seasonal Cycle Score [1] |
Spatial Distribution Score [1] |
Overall Score [1] |
|||
|---|---|---|---|---|---|---|---|---|---|---|---|---|---|---|---|---|
| Benchmark | [-] | 291. | ||||||||||||||
| CTSM51_CRUJRA | [-] | 293. | 292. | 291. | 298. | 295. | 1.77 | 2.67 | 0.357 | 0.549 | 0.849 | 0.969 | 0.989 | 0.841 | ||
| CTSM51_CRUJRA_FLDS | [-] | 292. | 292. | 291. | 297. | 295. | 1.24 | 2.37 | 0.359 | 0.600 | 0.845 | 0.970 | 0.984 | 0.849 | ||
| CTSM51_CRUNCEPV7 | [-] | 292. | 292. | 291. | 298. | 295. | 1.25 | 2.45 | 0.360 | 0.588 | 0.835 | 0.971 | 0.982 | 0.842 | ||
| CTSM51_GSWP3V1 | [-] | 292. | 291. | 291. | 297. | 295. | 0.848 | 1.94 | 0.304 | 0.655 | 0.877 | 0.975 | 0.994 | 0.876 |
Download Data |
Period Mean (original grids) [K] |
Model Period Mean (intersection) [K] |
Benchmark Period Mean (intersection) [K] |
Model Period Mean (complement) [K] |
Benchmark Period Mean (complement) [K] |
Bias [K] |
RMSE [K] |
Phase Shift [months] |
Bias Score [1] |
RMSE Score [1] |
Seasonal Cycle Score [1] |
Spatial Distribution Score [1] |
Overall Score [1] |
|||
|---|---|---|---|---|---|---|---|---|---|---|---|---|---|---|---|---|
| Benchmark | [-] | 260. | ||||||||||||||
| CTSM51_CRUJRA | [-] | 258. | 258. | 260. | 260. | 261. | -1.33 | 2.25 | 0.0463 | 0.897 | 0.906 | 0.997 | 0.993 | 0.940 | ||
| CTSM51_CRUJRA_FLDS | [-] | 259. | 259. | 260. | 261. | 261. | -0.334 | 1.67 | 0.0330 | 0.931 | 0.921 | 0.998 | 0.992 | 0.953 | ||
| CTSM51_CRUNCEPV7 | [-] | 258. | 258. | 259. | 259. | 261. | -1.56 | 2.23 | 0.0156 | 0.897 | 0.910 | 0.999 | 0.999 | 0.943 | ||
| CTSM51_GSWP3V1 | [-] | 259. | 259. | 259. | 262. | 261. | -0.442 | 1.31 | 0.0220 | 0.931 | 0.952 | 0.999 | 0.999 | 0.967 |
Download Data |
Period Mean (original grids) [K] |
Model Period Mean (intersection) [K] |
Benchmark Period Mean (intersection) [K] |
Model Period Mean (complement) [K] |
Benchmark Period Mean (complement) [K] |
Bias [K] |
RMSE [K] |
Phase Shift [months] |
Bias Score [1] |
RMSE Score [1] |
Seasonal Cycle Score [1] |
Spatial Distribution Score [1] |
Overall Score [1] |
|||
|---|---|---|---|---|---|---|---|---|---|---|---|---|---|---|---|---|
| Benchmark | [-] | 288. | ||||||||||||||
| CTSM51_CRUJRA | [-] | 290. | 290. | 288. | 289. | 289. | 1.84 | 2.00 | 0.195 | 0.669 | 0.907 | 0.985 | 1.00 | 0.893 | ||
| CTSM51_CRUJRA_FLDS | [-] | 289. | 289. | 288. | 289. | 289. | 1.71 | 1.87 | 0.187 | 0.687 | 0.915 | 0.986 | 1.00 | 0.901 | ||
| CTSM51_CRUNCEPV7 | [-] | 290. | 290. | 288. | 290. | 289. | 2.45 | 2.53 | 0.207 | 0.599 | 0.898 | 0.985 | 0.998 | 0.876 | ||
| CTSM51_GSWP3V1 | [-] | 289. | 289. | 288. | 289. | 289. | 1.22 | 1.38 | 0.147 | 0.759 | 0.932 | 0.990 | 1.00 | 0.922 |
Download Data |
Period Mean (original grids) [K] |
Model Period Mean (intersection) [K] |
Benchmark Period Mean (intersection) [K] |
Model Period Mean (complement) [K] |
Benchmark Period Mean (complement) [K] |
Bias [K] |
RMSE [K] |
Phase Shift [months] |
Bias Score [1] |
RMSE Score [1] |
Seasonal Cycle Score [1] |
Spatial Distribution Score [1] |
Overall Score [1] |
|||
|---|---|---|---|---|---|---|---|---|---|---|---|---|---|---|---|---|
| Benchmark | [-] | 278. | ||||||||||||||
| CTSM51_CRUJRA | [-] | 277. | 277. | 278. | 281. | 279. | 0.165 | 2.03 | 0.186 | 0.791 | 0.840 | 0.988 | 0.973 | 0.886 | ||
| CTSM51_CRUJRA_FLDS | [-] | 278. | 278. | 278. | 281. | 279. | 0.655 | 1.60 | 0.175 | 0.804 | 0.906 | 0.988 | 0.996 | 0.920 | ||
| CTSM51_CRUNCEPV7 | [-] | 277. | 277. | 278. | 281. | 279. | 0.519 | 1.82 | 0.186 | 0.791 | 0.879 | 0.987 | 0.971 | 0.902 | ||
| CTSM51_GSWP3V1 | [-] | 277. | 277. | 278. | 281. | 279. | 0.200 | 1.46 | 0.192 | 0.810 | 0.932 | 0.987 | 0.988 | 0.930 |
Download Data |
Period Mean (original grids) [K] |
Model Period Mean (intersection) [K] |
Benchmark Period Mean (intersection) [K] |
Model Period Mean (complement) [K] |
Benchmark Period Mean (complement) [K] |
Bias [K] |
RMSE [K] |
Phase Shift [months] |
Bias Score [1] |
RMSE Score [1] |
Seasonal Cycle Score [1] |
Spatial Distribution Score [1] |
Overall Score [1] |
|||
|---|---|---|---|---|---|---|---|---|---|---|---|---|---|---|---|---|
| Benchmark | [-] | 281. | ||||||||||||||
| CTSM51_CRUJRA | [-] | 281. | 282. | 281. | 276. | 285. | 1.35 | 2.45 | 0.390 | 0.630 | 0.852 | 0.952 | 0.994 | 0.856 | ||
| CTSM51_CRUJRA_FLDS | [-] | 281. | 282. | 281. | 276. | 285. | 1.24 | 2.09 | 0.381 | 0.668 | 0.864 | 0.955 | 0.998 | 0.870 | ||
| CTSM51_CRUNCEPV7 | [-] | 277. | 281. | 281. | 242. | 285. | 1.20 | 2.45 | 0.398 | 0.633 | 0.847 | 0.952 | 0.994 | 0.854 | ||
| CTSM51_GSWP3V1 | [-] | 277. | 281. | 281. | 246. | 285. | 0.773 | 1.69 | 0.290 | 0.712 | 0.892 | 0.967 | 0.998 | 0.892 |
Download Data |
Period Mean (original grids) [K] |
Model Period Mean (intersection) [K] |
Benchmark Period Mean (intersection) [K] |
Model Period Mean (complement) [K] |
Benchmark Period Mean (complement) [K] |
Bias [K] |
RMSE [K] |
Phase Shift [months] |
Bias Score [1] |
RMSE Score [1] |
Seasonal Cycle Score [1] |
Spatial Distribution Score [1] |
Overall Score [1] |
|||
|---|---|---|---|---|---|---|---|---|---|---|---|---|---|---|---|---|
| Benchmark | [-] | 289. | ||||||||||||||
| CTSM51_CRUJRA | [-] | 291. | 291. | 289. | 292. | 289. | 1.93 | 2.44 | 0.294 | 0.702 | 0.878 | 0.978 | 0.998 | 0.887 | ||
| CTSM51_CRUJRA_FLDS | [-] | 290. | 290. | 289. | 291. | 289. | 1.07 | 1.83 | 0.424 | 0.788 | 0.884 | 0.963 | 1.00 | 0.904 | ||
| CTSM51_CRUNCEPV7 | [-] | 289. | 289. | 289. | 291. | 289. | 0.299 | 1.89 | 0.347 | 0.772 | 0.889 | 0.972 | 0.996 | 0.904 | ||
| CTSM51_GSWP3V1 | [-] | 289. | 289. | 289. | 291. | 289. | 0.399 | 1.38 | 0.307 | 0.836 | 0.915 | 0.974 | 1.00 | 0.928 |
Download Data |
Period Mean (original grids) [K] |
Model Period Mean (intersection) [K] |
Benchmark Period Mean (intersection) [K] |
Model Period Mean (complement) [K] |
Benchmark Period Mean (complement) [K] |
Bias [K] |
RMSE [K] |
Phase Shift [months] |
Bias Score [1] |
RMSE Score [1] |
Seasonal Cycle Score [1] |
Spatial Distribution Score [1] |
Overall Score [1] |
|||
|---|---|---|---|---|---|---|---|---|---|---|---|---|---|---|---|---|
| Benchmark | [-] | 260. | ||||||||||||||
| CTSM51_CRUJRA | [-] | 260. | 260. | 260. | 259. | 264. | -0.651 | 1.77 | 0.0660 | 0.916 | 0.915 | 0.996 | 0.992 | 0.946 | ||
| CTSM51_CRUJRA_FLDS | [-] | 261. | 261. | 260. | 260. | 264. | 0.255 | 1.54 | 0.0596 | 0.926 | 0.924 | 0.996 | 0.991 | 0.952 | ||
| CTSM51_CRUNCEPV7 | [-] | 259. | 259. | 260. | 258. | 264. | -1.10 | 2.24 | 0.0652 | 0.890 | 0.898 | 0.996 | 0.964 | 0.929 | ||
| CTSM51_GSWP3V1 | [-] | 260. | 260. | 260. | 262. | 264. | 0.381 | 1.59 | 0.0587 | 0.911 | 0.935 | 0.996 | 0.995 | 0.954 |
Download Data |
Period Mean (original grids) [K] |
Model Period Mean (intersection) [K] |
Benchmark Period Mean (intersection) [K] |
Model Period Mean (complement) [K] |
Benchmark Period Mean (complement) [K] |
Bias [K] |
RMSE [K] |
Phase Shift [months] |
Bias Score [1] |
RMSE Score [1] |
Seasonal Cycle Score [1] |
Spatial Distribution Score [1] |
Overall Score [1] |
|||
|---|---|---|---|---|---|---|---|---|---|---|---|---|---|---|---|---|
| Benchmark | [-] | 289. | ||||||||||||||
| CTSM51_CRUJRA | [-] | 291. | 290. | 289. | 295. | 294. | 3.03 | 3.52 | 0.418 | 0.372 | 0.811 | 0.964 | 0.999 | 0.791 | ||
| CTSM51_CRUJRA_FLDS | [-] | 291. | 290. | 289. | 295. | 294. | 2.50 | 3.05 | 0.395 | 0.418 | 0.822 | 0.968 | 1.00 | 0.806 | ||
| CTSM51_CRUNCEPV7 | [-] | 291. | 290. | 289. | 296. | 294. | 3.14 | 3.66 | 0.560 | 0.356 | 0.786 | 0.948 | 0.986 | 0.773 | ||
| CTSM51_GSWP3V1 | [-] | 290. | 289. | 289. | 294. | 294. | 1.78 | 2.56 | 0.386 | 0.483 | 0.836 | 0.968 | 0.997 | 0.824 |
Download Data |
Period Mean (original grids) [K] |
Model Period Mean (intersection) [K] |
Benchmark Period Mean (intersection) [K] |
Model Period Mean (complement) [K] |
Benchmark Period Mean (complement) [K] |
Bias [K] |
RMSE [K] |
Phase Shift [months] |
Bias Score [1] |
RMSE Score [1] |
Seasonal Cycle Score [1] |
Spatial Distribution Score [1] |
Overall Score [1] |
|||
|---|---|---|---|---|---|---|---|---|---|---|---|---|---|---|---|---|
| Benchmark | [-] | 280. | ||||||||||||||
| CTSM51_CRUJRA | [-] | 282. | 281. | 280. | 290. | 284. | 1.71 | 2.02 | 0.0510 | 0.808 | 0.929 | 0.997 | 0.993 | 0.931 | ||
| CTSM51_CRUJRA_FLDS | [-] | 282. | 282. | 280. | 289. | 284. | 1.84 | 2.00 | 0.0601 | 0.803 | 0.944 | 0.996 | 0.999 | 0.937 | ||
| CTSM51_CRUNCEPV7 | [-] | 282. | 281. | 280. | 291. | 284. | 1.84 | 2.10 | 0.0611 | 0.796 | 0.933 | 0.996 | 0.979 | 0.928 | ||
| CTSM51_GSWP3V1 | [-] | 281. | 281. | 280. | 289. | 284. | 1.21 | 1.45 | 0.0416 | 0.854 | 0.948 | 0.997 | 0.997 | 0.949 |
Download Data |
Period Mean (original grids) [K] |
Model Period Mean (intersection) [K] |
Benchmark Period Mean (intersection) [K] |
Model Period Mean (complement) [K] |
Benchmark Period Mean (complement) [K] |
Bias [K] |
RMSE [K] |
Phase Shift [months] |
Bias Score [1] |
RMSE Score [1] |
Seasonal Cycle Score [1] |
Spatial Distribution Score [1] |
Overall Score [1] |
|||
|---|---|---|---|---|---|---|---|---|---|---|---|---|---|---|---|---|
| Benchmark | [-] | 269. | ||||||||||||||
| CTSM51_CRUJRA | [-] | 269. | 269. | 269. | 273. | 275. | 0.196 | 1.79 | 0.0483 | 0.895 | 0.882 | 0.997 | 0.989 | 0.929 | ||
| CTSM51_CRUJRA_FLDS | [-] | 270. | 270. | 269. | 274. | 275. | 1.04 | 1.66 | 0.0621 | 0.876 | 0.921 | 0.996 | 0.996 | 0.942 | ||
| CTSM51_CRUNCEPV7 | [-] | 269. | 269. | 269. | 274. | 275. | 0.342 | 1.54 | 0.0470 | 0.900 | 0.906 | 0.997 | 0.987 | 0.939 | ||
| CTSM51_GSWP3V1 | [-] | 269. | 269. | 269. | 274. | 275. | 0.556 | 1.32 | 0.0630 | 0.898 | 0.933 | 0.996 | 0.993 | 0.950 |
Download Data |
Period Mean (original grids) [K] |
Model Period Mean (intersection) [K] |
Benchmark Period Mean (intersection) [K] |
Model Period Mean (complement) [K] |
Benchmark Period Mean (complement) [K] |
Bias [K] |
RMSE [K] |
Phase Shift [months] |
Bias Score [1] |
RMSE Score [1] |
Seasonal Cycle Score [1] |
Spatial Distribution Score [1] |
Overall Score [1] |
|||
|---|---|---|---|---|---|---|---|---|---|---|---|---|---|---|---|---|
| Benchmark | [-] | 276. | ||||||||||||||
| CTSM51_CRUJRA | [-] | 278. | 278. | 276. | 284. | 282. | 2.26 | 2.97 | 0.0430 | 0.715 | 0.871 | 0.997 | 0.997 | 0.890 | ||
| CTSM51_CRUJRA_FLDS | [-] | 278. | 278. | 276. | 284. | 282. | 2.36 | 2.82 | 0.0441 | 0.713 | 0.903 | 0.997 | 1.00 | 0.903 | ||
| CTSM51_CRUNCEPV7 | [-] | 277. | 277. | 276. | 283. | 282. | 1.76 | 2.57 | 0.0480 | 0.749 | 0.874 | 0.997 | 1.00 | 0.899 | ||
| CTSM51_GSWP3V1 | [-] | 277. | 277. | 276. | 284. | 282. | 1.69 | 2.28 | 0.0539 | 0.760 | 0.913 | 0.996 | 1.00 | 0.917 |
Download Data |
Period Mean (original grids) [K] |
Model Period Mean (intersection) [K] |
Benchmark Period Mean (intersection) [K] |
Model Period Mean (complement) [K] |
Benchmark Period Mean (complement) [K] |
Bias [K] |
RMSE [K] |
Phase Shift [months] |
Bias Score [1] |
RMSE Score [1] |
Seasonal Cycle Score [1] |
Spatial Distribution Score [1] |
Overall Score [1] |
|||
|---|---|---|---|---|---|---|---|---|---|---|---|---|---|---|---|---|
| Benchmark | [-] | 294. | ||||||||||||||
| CTSM51_CRUJRA | [-] | 296. | 296. | 294. | 298. | 295. | 2.45 | 2.92 | 2.25 | 0.102 | 0.725 | 0.644 | 0.988 | 0.637 | ||
| CTSM51_CRUJRA_FLDS | [-] | 296. | 295. | 294. | 297. | 295. | 1.77 | 2.23 | 1.84 | 0.171 | 0.743 | 0.719 | 1.00 | 0.675 | ||
| CTSM51_CRUNCEPV7 | [-] | 297. | 297. | 294. | 298. | 295. | 2.78 | 3.14 | 1.83 | 0.0798 | 0.698 | 0.722 | 0.999 | 0.639 | ||
| CTSM51_GSWP3V1 | [-] | 295. | 295. | 294. | 297. | 295. | 1.35 | 1.79 | 1.08 | 0.250 | 0.777 | 0.840 | 0.995 | 0.728 |
Download Data |
Period Mean (original grids) [K] |
Model Period Mean (intersection) [K] |
Benchmark Period Mean (intersection) [K] |
Model Period Mean (complement) [K] |
Benchmark Period Mean (complement) [K] |
Bias [K] |
RMSE [K] |
Phase Shift [months] |
Bias Score [1] |
RMSE Score [1] |
Seasonal Cycle Score [1] |
Spatial Distribution Score [1] |
Overall Score [1] |
|||
|---|---|---|---|---|---|---|---|---|---|---|---|---|---|---|---|---|
| Benchmark | [-] | 290. | ||||||||||||||
| CTSM51_CRUJRA | [-] | 292. | 292. | 290. | 292. | 293. | 2.19 | 2.40 | 0.630 | 0.437 | 0.838 | 0.921 | 0.999 | 0.807 | ||
| CTSM51_CRUJRA_FLDS | [-] | 292. | 292. | 290. | 292. | 293. | 1.83 | 2.08 | 0.622 | 0.486 | 0.848 | 0.921 | 1.00 | 0.821 | ||
| CTSM51_CRUNCEPV7 | [-] | 293. | 293. | 290. | 293. | 293. | 2.72 | 2.89 | 0.792 | 0.364 | 0.814 | 0.889 | 0.994 | 0.775 | ||
| CTSM51_GSWP3V1 | [-] | 291. | 291. | 290. | 292. | 293. | 1.25 | 1.50 | 0.536 | 0.584 | 0.877 | 0.930 | 0.999 | 0.853 |
Download Data |
Period Mean (original grids) [K] |
Model Period Mean (intersection) [K] |
Benchmark Period Mean (intersection) [K] |
Model Period Mean (complement) [K] |
Benchmark Period Mean (complement) [K] |
Bias [K] |
RMSE [K] |
Phase Shift [months] |
Bias Score [1] |
RMSE Score [1] |
Seasonal Cycle Score [1] |
Spatial Distribution Score [1] |
Overall Score [1] |
|||
|---|---|---|---|---|---|---|---|---|---|---|---|---|---|---|---|---|
| Benchmark | [-] | 278. | ||||||||||||||
| CTSM51_CRUJRA | [-] | 280. | 280. | 278. | 284. | 280. | 2.48 | 3.72 | 0.239 | 0.454 | 0.793 | 0.981 | 0.989 | 0.802 | ||
| CTSM51_CRUJRA_FLDS | [-] | 280. | 279. | 278. | 284. | 280. | 2.32 | 3.66 | 0.233 | 0.452 | 0.805 | 0.982 | 0.987 | 0.806 | ||
| CTSM51_CRUNCEPV7 | [-] | 280. | 280. | 278. | 284. | 280. | 2.41 | 3.69 | 0.247 | 0.442 | 0.807 | 0.976 | 0.998 | 0.806 | ||
| CTSM51_GSWP3V1 | [-] | 279. | 279. | 278. | 284. | 280. | 1.67 | 3.08 | 0.133 | 0.515 | 0.856 | 0.989 | 0.999 | 0.843 |
Temporally integrated period mean