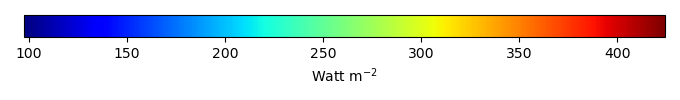
Mean State
Download Data |
Period Mean (original grids) [Watt m-2] |
Model Period Mean (intersection) [Watt m-2] |
Benchmark Period Mean (intersection) [Watt m-2] |
Model Period Mean (complement) [Watt m-2] |
Benchmark Period Mean (complement) [Watt m-2] |
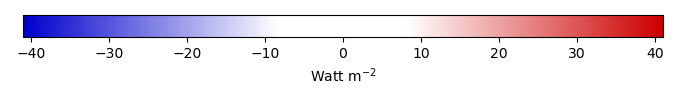
Bias [Watt m-2] |
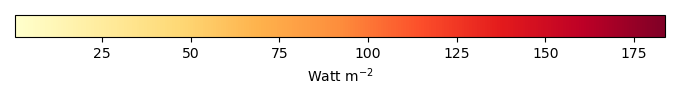
RMSE [Watt m-2] |
Phase Shift [months] |
Bias Score [1] |
RMSE Score [1] |
Seasonal Cycle Score [1] |
Spatial Distribution Score [1] |
Overall Score [1] |
|||
|---|---|---|---|---|---|---|---|---|---|---|---|---|---|---|---|---|
| Benchmark | [-] | 397. | ||||||||||||||
| CTSM51_CRUJRA | [-] | 406. | 405. | 397. | 406. | 11.6 | 16.1 | 0.813 | 0.339 | 0.555 | 0.918 | 0.725 | 0.618 | |||
| CTSM51_CRUJRA_FLDS | [-] | 390. | 390. | 397. | 406. | -5.08 | 8.94 | 0.585 | 0.531 | 0.655 | 0.929 | 0.855 | 0.725 | |||
| CTSM51_CRUNCEPV7 | [-] | 407. | 406. | 397. | 406. | 11.9 | 15.6 | 0.589 | 0.313 | 0.563 | 0.939 | 0.762 | 0.628 | |||
| CTSM51_GSWP3V1 | [-] | 396. | 395. | 397. | 406. | -0.209 | 3.47 | 0.222 | 0.758 | 0.849 | 0.974 | 1.00 | 0.886 |
Download Data |
Period Mean (original grids) [Watt m-2] |
Model Period Mean (intersection) [Watt m-2] |
Benchmark Period Mean (intersection) [Watt m-2] |
Model Period Mean (complement) [Watt m-2] |
Benchmark Period Mean (complement) [Watt m-2] |
Bias [Watt m-2] |
RMSE [Watt m-2] |
Phase Shift [months] |
Bias Score [1] |
RMSE Score [1] |
Seasonal Cycle Score [1] |
Spatial Distribution Score [1] |
Overall Score [1] |
|||
|---|---|---|---|---|---|---|---|---|---|---|---|---|---|---|---|---|
| Benchmark | [-] | 384. | ||||||||||||||
| CTSM51_CRUJRA | [-] | 394. | 395. | 384. | 405. | 11.2 | 16.7 | 1.10 | 0.597 | 0.719 | 0.870 | 0.827 | 0.746 | |||
| CTSM51_CRUJRA_FLDS | [-] | 375. | 376. | 384. | 405. | -8.14 | 12.9 | 1.09 | 0.695 | 0.740 | 0.864 | 0.971 | 0.802 | |||
| CTSM51_CRUNCEPV7 | [-] | 394. | 394. | 384. | 405. | 10.9 | 15.5 | 0.938 | 0.603 | 0.747 | 0.889 | 0.861 | 0.769 | |||
| CTSM51_GSWP3V1 | [-] | 383. | 384. | 384. | 405. | -0.0825 | 4.21 | 0.237 | 0.870 | 0.909 | 0.980 | 0.997 | 0.933 |
Download Data |
Period Mean (original grids) [Watt m-2] |
Model Period Mean (intersection) [Watt m-2] |
Benchmark Period Mean (intersection) [Watt m-2] |
Model Period Mean (complement) [Watt m-2] |
Benchmark Period Mean (complement) [Watt m-2] |
Bias [Watt m-2] |
RMSE [Watt m-2] |
Phase Shift [months] |
Bias Score [1] |
RMSE Score [1] |
Seasonal Cycle Score [1] |
Spatial Distribution Score [1] |
Overall Score [1] |
|||
|---|---|---|---|---|---|---|---|---|---|---|---|---|---|---|---|---|
| Benchmark | [-] | 362. | ||||||||||||||
| CTSM51_CRUJRA | [-] | 367. | 367. | 361. | 380. | 8.95 | 16.9 | 1.24 | 0.598 | 0.712 | 0.827 | 0.950 | 0.760 | |||
| CTSM51_CRUJRA_FLDS | [-] | 353. | 353. | 361. | 380. | -5.43 | 11.3 | 0.935 | 0.717 | 0.767 | 0.883 | 0.996 | 0.826 | |||
| CTSM51_CRUNCEPV7 | [-] | 369. | 369. | 361. | 380. | 10.5 | 17.1 | 1.16 | 0.589 | 0.710 | 0.846 | 0.963 | 0.764 | |||
| CTSM51_GSWP3V1 | [-] | 359. | 359. | 361. | 380. | 0.182 | 4.86 | 0.299 | 0.835 | 0.906 | 0.964 | 1.00 | 0.922 |
Download Data |
Period Mean (original grids) [Watt m-2] |
Model Period Mean (intersection) [Watt m-2] |
Benchmark Period Mean (intersection) [Watt m-2] |
Model Period Mean (complement) [Watt m-2] |
Benchmark Period Mean (complement) [Watt m-2] |
Bias [Watt m-2] |
RMSE [Watt m-2] |
Phase Shift [months] |
Bias Score [1] |
RMSE Score [1] |
Seasonal Cycle Score [1] |
Spatial Distribution Score [1] |
Overall Score [1] |
|||
|---|---|---|---|---|---|---|---|---|---|---|---|---|---|---|---|---|
| Benchmark | [-] | 239. | ||||||||||||||
| CTSM51_CRUJRA | [-] | 207. | 207. | 238. | 251. | -28.4 | 30.5 | 0.0625 | 0.572 | 0.818 | 0.996 | 0.991 | 0.839 | |||
| CTSM51_CRUJRA_FLDS | [-] | 225. | 225. | 238. | 251. | -10.9 | 17.0 | 0.0468 | 0.806 | 0.783 | 0.997 | 0.980 | 0.870 | |||
| CTSM51_CRUNCEPV7 | [-] | 205. | 205. | 238. | 251. | -30.5 | 32.5 | 0.0736 | 0.552 | 0.821 | 0.995 | 0.963 | 0.830 | |||
| CTSM51_GSWP3V1 | [-] | 236. | 236. | 238. | 251. | 0.517 | 3.72 | 0.0228 | 0.948 | 0.953 | 0.998 | 0.999 | 0.971 |
Download Data |
Period Mean (original grids) [Watt m-2] |
Model Period Mean (intersection) [Watt m-2] |
Benchmark Period Mean (intersection) [Watt m-2] |
Model Period Mean (complement) [Watt m-2] |
Benchmark Period Mean (complement) [Watt m-2] |
Bias [Watt m-2] |
RMSE [Watt m-2] |
Phase Shift [months] |
Bias Score [1] |
RMSE Score [1] |
Seasonal Cycle Score [1] |
Spatial Distribution Score [1] |
Overall Score [1] |
|||
|---|---|---|---|---|---|---|---|---|---|---|---|---|---|---|---|---|
| Benchmark | [-] | 411. | ||||||||||||||
| CTSM51_CRUJRA | [-] | 426. | 426. | 411. | 416. | 17.5 | 20.5 | 1.97 | 0.131 | 0.550 | 0.692 | 0.530 | 0.491 | |||
| CTSM51_CRUJRA_FLDS | [-] | 407. | 407. | 411. | 416. | -2.16 | 6.38 | 1.84 | 0.466 | 0.634 | 0.712 | 0.977 | 0.685 | |||
| CTSM51_CRUNCEPV7 | [-] | 429. | 428. | 411. | 416. | 20.5 | 22.3 | 1.76 | 0.0766 | 0.515 | 0.744 | 0.675 | 0.505 | |||
| CTSM51_GSWP3V1 | [-] | 409. | 409. | 411. | 416. | 0.333 | 3.40 | 0.766 | 0.611 | 0.858 | 0.883 | 0.996 | 0.841 |
Download Data |
Period Mean (original grids) [Watt m-2] |
Model Period Mean (intersection) [Watt m-2] |
Benchmark Period Mean (intersection) [Watt m-2] |
Model Period Mean (complement) [Watt m-2] |
Benchmark Period Mean (complement) [Watt m-2] |
Bias [Watt m-2] |
RMSE [Watt m-2] |
Phase Shift [months] |
Bias Score [1] |
RMSE Score [1] |
Seasonal Cycle Score [1] |
Spatial Distribution Score [1] |
Overall Score [1] |
|||
|---|---|---|---|---|---|---|---|---|---|---|---|---|---|---|---|---|
| Benchmark | [-] | 264. | ||||||||||||||
| CTSM51_CRUJRA | [-] | 243. | 244. | 264. | 272. | -19.9 | 21.4 | 0.0247 | 0.700 | 0.874 | 0.998 | 0.991 | 0.887 | |||
| CTSM51_CRUJRA_FLDS | [-] | 254. | 255. | 264. | 272. | -9.00 | 12.5 | 0.0220 | 0.854 | 0.883 | 0.999 | 0.941 | 0.912 | |||
| CTSM51_CRUNCEPV7 | [-] | 242. | 243. | 264. | 272. | -20.3 | 21.8 | 0.0293 | 0.695 | 0.874 | 0.998 | 0.979 | 0.884 | |||
| CTSM51_GSWP3V1 | [-] | 263. | 263. | 264. | 272. | -0.0949 | 2.31 | 0.0101 | 0.966 | 0.979 | 0.999 | 1.00 | 0.985 |
Download Data |
Period Mean (original grids) [Watt m-2] |
Model Period Mean (intersection) [Watt m-2] |
Benchmark Period Mean (intersection) [Watt m-2] |
Model Period Mean (complement) [Watt m-2] |
Benchmark Period Mean (complement) [Watt m-2] |
Bias [Watt m-2] |
RMSE [Watt m-2] |
Phase Shift [months] |
Bias Score [1] |
RMSE Score [1] |
Seasonal Cycle Score [1] |
Spatial Distribution Score [1] |
Overall Score [1] |
|||
|---|---|---|---|---|---|---|---|---|---|---|---|---|---|---|---|---|
| Benchmark | [-] | 294. | ||||||||||||||
| CTSM51_CRUJRA | [-] | 281. | 280. | 294. | 335. | -9.92 | 17.6 | 0.0771 | 0.767 | 0.820 | 0.995 | 0.994 | 0.879 | |||
| CTSM51_CRUJRA_FLDS | [-] | 279. | 279. | 294. | 335. | -11.2 | 16.6 | 0.0798 | 0.779 | 0.845 | 0.994 | 0.971 | 0.887 | |||
| CTSM51_CRUNCEPV7 | [-] | 279. | 278. | 294. | 335. | -11.3 | 18.5 | 0.0726 | 0.758 | 0.815 | 0.995 | 0.989 | 0.874 | |||
| CTSM51_GSWP3V1 | [-] | 291. | 290. | 294. | 335. | 0.295 | 4.77 | 0.0316 | 0.916 | 0.958 | 0.998 | 1.00 | 0.966 |
Download Data |
Period Mean (original grids) [Watt m-2] |
Model Period Mean (intersection) [Watt m-2] |
Benchmark Period Mean (intersection) [Watt m-2] |
Model Period Mean (complement) [Watt m-2] |
Benchmark Period Mean (complement) [Watt m-2] |
Bias [Watt m-2] |
RMSE [Watt m-2] |
Phase Shift [months] |
Bias Score [1] |
RMSE Score [1] |
Seasonal Cycle Score [1] |
Spatial Distribution Score [1] |
Overall Score [1] |
|||
|---|---|---|---|---|---|---|---|---|---|---|---|---|---|---|---|---|
| Benchmark | [-] | 379. | ||||||||||||||
| CTSM51_CRUJRA | [-] | 388. | 388. | 379. | 405. | 17.7 | 24.3 | 0.609 | 0.473 | 0.758 | 0.940 | 0.935 | 0.773 | |||
| CTSM51_CRUJRA_FLDS | [-] | 370. | 369. | 379. | 405. | -1.78 | 13.1 | 0.356 | 0.737 | 0.791 | 0.967 | 0.957 | 0.849 | |||
| CTSM51_CRUNCEPV7 | [-] | 385. | 385. | 379. | 405. | 15.5 | 22.9 | 0.632 | 0.493 | 0.743 | 0.943 | 0.923 | 0.769 | |||
| CTSM51_GSWP3V1 | [-] | 372. | 371. | 379. | 405. | -0.238 | 5.89 | 0.144 | 0.842 | 0.917 | 0.987 | 0.999 | 0.932 |
Download Data |
Period Mean (original grids) [Watt m-2] |
Model Period Mean (intersection) [Watt m-2] |
Benchmark Period Mean (intersection) [Watt m-2] |
Model Period Mean (complement) [Watt m-2] |
Benchmark Period Mean (complement) [Watt m-2] |
Bias [Watt m-2] |
RMSE [Watt m-2] |
Phase Shift [months] |
Bias Score [1] |
RMSE Score [1] |
Seasonal Cycle Score [1] |
Spatial Distribution Score [1] |
Overall Score [1] |
|||
|---|---|---|---|---|---|---|---|---|---|---|---|---|---|---|---|---|
| Benchmark | [-] | 244. | ||||||||||||||
| CTSM51_CRUJRA | [-] | 214. | 215. | 244. | 240. | -28.6 | 30.3 | 0.0370 | 0.556 | 0.822 | 0.998 | 0.990 | 0.837 | |||
| CTSM51_CRUJRA_FLDS | [-] | 231. | 232. | 244. | 240. | -11.4 | 16.5 | 0.0187 | 0.795 | 0.791 | 0.999 | 0.950 | 0.865 | |||
| CTSM51_CRUNCEPV7 | [-] | 214. | 215. | 244. | 240. | -29.0 | 31.1 | 0.00733 | 0.552 | 0.799 | 1.00 | 0.972 | 0.824 | |||
| CTSM51_GSWP3V1 | [-] | 243. | 243. | 244. | 240. | 0.101 | 2.30 | 0.00389 | 0.967 | 0.967 | 1.00 | 1.00 | 0.980 |
Download Data |
Period Mean (original grids) [Watt m-2] |
Model Period Mean (intersection) [Watt m-2] |
Benchmark Period Mean (intersection) [Watt m-2] |
Model Period Mean (complement) [Watt m-2] |
Benchmark Period Mean (complement) [Watt m-2] |
Bias [Watt m-2] |
RMSE [Watt m-2] |
Phase Shift [months] |
Bias Score [1] |
RMSE Score [1] |
Seasonal Cycle Score [1] |
Spatial Distribution Score [1] |
Overall Score [1] |
|||
|---|---|---|---|---|---|---|---|---|---|---|---|---|---|---|---|---|
| Benchmark | [-] | 351. | ||||||||||||||
| CTSM51_CRUJRA | [-] | 348. | 348. | 351. | 358. | -1.94 | 10.7 | 0.417 | 0.753 | 0.825 | 0.972 | 0.922 | 0.859 | |||
| CTSM51_CRUJRA_FLDS | [-] | 344. | 344. | 351. | 358. | -6.08 | 9.67 | 0.385 | 0.784 | 0.830 | 0.975 | 0.988 | 0.882 | |||
| CTSM51_CRUNCEPV7 | [-] | 353. | 353. | 351. | 358. | 3.44 | 12.0 | 0.401 | 0.730 | 0.828 | 0.973 | 0.879 | 0.848 | |||
| CTSM51_GSWP3V1 | [-] | 350. | 350. | 351. | 358. | 0.167 | 3.69 | 0.144 | 0.902 | 0.930 | 0.991 | 1.00 | 0.951 |
Download Data |
Period Mean (original grids) [Watt m-2] |
Model Period Mean (intersection) [Watt m-2] |
Benchmark Period Mean (intersection) [Watt m-2] |
Model Period Mean (complement) [Watt m-2] |
Benchmark Period Mean (complement) [Watt m-2] |
Bias [Watt m-2] |
RMSE [Watt m-2] |
Phase Shift [months] |
Bias Score [1] |
RMSE Score [1] |
Seasonal Cycle Score [1] |
Spatial Distribution Score [1] |
Overall Score [1] |
|||
|---|---|---|---|---|---|---|---|---|---|---|---|---|---|---|---|---|
| Benchmark | [-] | 308. | ||||||||||||||
| CTSM51_CRUJRA | [-] | 289. | 290. | 308. | 320. | -13.5 | 17.7 | 0.206 | 0.634 | 0.783 | 0.986 | 0.910 | 0.819 | |||
| CTSM51_CRUJRA_FLDS | [-] | 298. | 298. | 308. | 320. | -6.61 | 10.8 | 0.215 | 0.790 | 0.815 | 0.986 | 0.993 | 0.880 | |||
| CTSM51_CRUNCEPV7 | [-] | 290. | 290. | 308. | 320. | -12.5 | 17.3 | 0.252 | 0.635 | 0.795 | 0.983 | 0.879 | 0.817 | |||
| CTSM51_GSWP3V1 | [-] | 304. | 304. | 308. | 320. | 0.137 | 3.81 | 0.0932 | 0.902 | 0.935 | 0.994 | 1.00 | 0.953 |
Download Data |
Period Mean (original grids) [Watt m-2] |
Model Period Mean (intersection) [Watt m-2] |
Benchmark Period Mean (intersection) [Watt m-2] |
Model Period Mean (complement) [Watt m-2] |
Benchmark Period Mean (complement) [Watt m-2] |
Bias [Watt m-2] |
RMSE [Watt m-2] |
Phase Shift [months] |
Bias Score [1] |
RMSE Score [1] |
Seasonal Cycle Score [1] |
Spatial Distribution Score [1] |
Overall Score [1] |
|||
|---|---|---|---|---|---|---|---|---|---|---|---|---|---|---|---|---|
| Benchmark | [-] | 313. | ||||||||||||||
| CTSM51_CRUJRA | [-] | 318. | 317. | 312. | 353. | 9.01 | 28.6 | 0.603 | 0.530 | 0.735 | 0.926 | 0.886 | 0.762 | |||
| CTSM51_CRUJRA_FLDS | [-] | 314. | 314. | 312. | 353. | 5.33 | 23.9 | 0.583 | 0.665 | 0.776 | 0.929 | 0.756 | 0.780 | |||
| CTSM51_CRUNCEPV7 | [-] | 305. | 305. | 312. | 353. | -2.09 | 19.9 | 0.547 | 0.583 | 0.722 | 0.934 | 0.991 | 0.790 | |||
| CTSM51_GSWP3V1 | [-] | 308. | 308. | 312. | 353. | 0.133 | 4.41 | 0.155 | 0.860 | 0.930 | 0.983 | 1.00 | 0.940 |
Download Data |
Period Mean (original grids) [Watt m-2] |
Model Period Mean (intersection) [Watt m-2] |
Benchmark Period Mean (intersection) [Watt m-2] |
Model Period Mean (complement) [Watt m-2] |
Benchmark Period Mean (complement) [Watt m-2] |
Bias [Watt m-2] |
RMSE [Watt m-2] |
Phase Shift [months] |
Bias Score [1] |
RMSE Score [1] |
Seasonal Cycle Score [1] |
Spatial Distribution Score [1] |
Overall Score [1] |
|||
|---|---|---|---|---|---|---|---|---|---|---|---|---|---|---|---|---|
| Benchmark | [-] | 343. | ||||||||||||||
| CTSM51_CRUJRA | [-] | 356. | 356. | 343. | 353. | 15.3 | 23.3 | 0.484 | 0.611 | 0.687 | 0.949 | 0.865 | 0.760 | |||
| CTSM51_CRUJRA_FLDS | [-] | 333. | 333. | 343. | 353. | -8.12 | 13.7 | 0.394 | 0.750 | 0.793 | 0.959 | 0.995 | 0.858 | |||
| CTSM51_CRUNCEPV7 | [-] | 350. | 350. | 343. | 353. | 9.44 | 17.7 | 0.478 | 0.686 | 0.735 | 0.955 | 0.924 | 0.807 | |||
| CTSM51_GSWP3V1 | [-] | 342. | 342. | 343. | 353. | 0.177 | 4.78 | 0.144 | 0.884 | 0.935 | 0.985 | 1.00 | 0.948 |
Download Data |
Period Mean (original grids) [Watt m-2] |
Model Period Mean (intersection) [Watt m-2] |
Benchmark Period Mean (intersection) [Watt m-2] |
Model Period Mean (complement) [Watt m-2] |
Benchmark Period Mean (complement) [Watt m-2] |
Bias [Watt m-2] |
RMSE [Watt m-2] |
Phase Shift [months] |
Bias Score [1] |
RMSE Score [1] |
Seasonal Cycle Score [1] |
Spatial Distribution Score [1] |
Overall Score [1] |
|||
|---|---|---|---|---|---|---|---|---|---|---|---|---|---|---|---|---|
| Benchmark | [-] | 244. | ||||||||||||||
| CTSM51_CRUJRA | [-] | 216. | 216. | 243. | 256. | -27.6 | 29.0 | 0.0720 | 0.549 | 0.846 | 0.995 | 0.987 | 0.845 | |||
| CTSM51_CRUJRA_FLDS | [-] | 232. | 232. | 243. | 256. | -11.6 | 17.5 | 0.0740 | 0.772 | 0.774 | 0.995 | 0.957 | 0.854 | |||
| CTSM51_CRUNCEPV7 | [-] | 216. | 216. | 243. | 256. | -27.0 | 28.6 | 0.0934 | 0.557 | 0.835 | 0.994 | 0.987 | 0.842 | |||
| CTSM51_GSWP3V1 | [-] | 243. | 243. | 243. | 256. | 0.236 | 3.12 | 0.0417 | 0.951 | 0.959 | 0.997 | 1.00 | 0.973 |
Download Data |
Period Mean (original grids) [Watt m-2] |
Model Period Mean (intersection) [Watt m-2] |
Benchmark Period Mean (intersection) [Watt m-2] |
Model Period Mean (complement) [Watt m-2] |
Benchmark Period Mean (complement) [Watt m-2] |
Bias [Watt m-2] |
RMSE [Watt m-2] |
Phase Shift [months] |
Bias Score [1] |
RMSE Score [1] |
Seasonal Cycle Score [1] |
Spatial Distribution Score [1] |
Overall Score [1] |
|||
|---|---|---|---|---|---|---|---|---|---|---|---|---|---|---|---|---|
| Benchmark | [-] | 374. | ||||||||||||||
| CTSM51_CRUJRA | [-] | 374. | 372. | 372. | 403. | 14.9 | 21.9 | 0.755 | 0.419 | 0.680 | 0.911 | 0.942 | 0.726 | |||
| CTSM51_CRUJRA_FLDS | [-] | 356. | 354. | 372. | 403. | -4.84 | 12.3 | 0.788 | 0.636 | 0.800 | 0.898 | 0.987 | 0.824 | |||
| CTSM51_CRUNCEPV7 | [-] | 373. | 372. | 372. | 403. | 14.8 | 21.5 | 0.743 | 0.418 | 0.697 | 0.918 | 0.925 | 0.731 | |||
| CTSM51_GSWP3V1 | [-] | 362. | 361. | 372. | 403. | 0.270 | 6.48 | 0.338 | 0.761 | 0.903 | 0.957 | 1.00 | 0.905 |
Download Data |
Period Mean (original grids) [Watt m-2] |
Model Period Mean (intersection) [Watt m-2] |
Benchmark Period Mean (intersection) [Watt m-2] |
Model Period Mean (complement) [Watt m-2] |
Benchmark Period Mean (complement) [Watt m-2] |
Bias [Watt m-2] |
RMSE [Watt m-2] |
Phase Shift [months] |
Bias Score [1] |
RMSE Score [1] |
Seasonal Cycle Score [1] |
Spatial Distribution Score [1] |
Overall Score [1] |
|||
|---|---|---|---|---|---|---|---|---|---|---|---|---|---|---|---|---|
| Benchmark | [-] | 332. | ||||||||||||||
| CTSM51_CRUJRA | [-] | 319. | 319. | 332. | 363. | -8.49 | 19.5 | 0.101 | 0.770 | 0.705 | 0.993 | 0.923 | 0.819 | |||
| CTSM51_CRUJRA_FLDS | [-] | 321. | 321. | 332. | 363. | -7.39 | 8.56 | 0.0872 | 0.835 | 0.923 | 0.994 | 0.997 | 0.934 | |||
| CTSM51_CRUNCEPV7 | [-] | 321. | 320. | 332. | 363. | -5.73 | 19.6 | 0.100 | 0.771 | 0.704 | 0.993 | 0.892 | 0.813 | |||
| CTSM51_GSWP3V1 | [-] | 328. | 328. | 332. | 363. | 0.0296 | 3.35 | 0.0404 | 0.926 | 0.966 | 0.997 | 1.00 | 0.971 |
Download Data |
Period Mean (original grids) [Watt m-2] |
Model Period Mean (intersection) [Watt m-2] |
Benchmark Period Mean (intersection) [Watt m-2] |
Model Period Mean (complement) [Watt m-2] |
Benchmark Period Mean (complement) [Watt m-2] |
Bias [Watt m-2] |
RMSE [Watt m-2] |
Phase Shift [months] |
Bias Score [1] |
RMSE Score [1] |
Seasonal Cycle Score [1] |
Spatial Distribution Score [1] |
Overall Score [1] |
|||
|---|---|---|---|---|---|---|---|---|---|---|---|---|---|---|---|---|
| Benchmark | [-] | 277. | ||||||||||||||
| CTSM51_CRUJRA | [-] | 253. | 253. | 276. | 302. | -21.8 | 23.8 | 0.0890 | 0.604 | 0.818 | 0.994 | 0.992 | 0.845 | |||
| CTSM51_CRUJRA_FLDS | [-] | 267. | 267. | 276. | 302. | -7.94 | 10.6 | 0.0658 | 0.813 | 0.886 | 0.996 | 0.994 | 0.915 | |||
| CTSM51_CRUNCEPV7 | [-] | 254. | 254. | 276. | 302. | -20.9 | 22.8 | 0.0878 | 0.615 | 0.828 | 0.994 | 0.994 | 0.852 | |||
| CTSM51_GSWP3V1 | [-] | 275. | 275. | 276. | 302. | -0.187 | 3.18 | 0.0417 | 0.930 | 0.966 | 0.997 | 1.00 | 0.972 |
Download Data |
Period Mean (original grids) [Watt m-2] |
Model Period Mean (intersection) [Watt m-2] |
Benchmark Period Mean (intersection) [Watt m-2] |
Model Period Mean (complement) [Watt m-2] |
Benchmark Period Mean (complement) [Watt m-2] |
Bias [Watt m-2] |
RMSE [Watt m-2] |
Phase Shift [months] |
Bias Score [1] |
RMSE Score [1] |
Seasonal Cycle Score [1] |
Spatial Distribution Score [1] |
Overall Score [1] |
|||
|---|---|---|---|---|---|---|---|---|---|---|---|---|---|---|---|---|
| Benchmark | [-] | 296. | ||||||||||||||
| CTSM51_CRUJRA | [-] | 288. | 288. | 296. | 329. | -6.61 | 14.6 | 0.179 | 0.721 | 0.797 | 0.988 | 0.927 | 0.846 | |||
| CTSM51_CRUJRA_FLDS | [-] | 287. | 287. | 296. | 329. | -6.99 | 11.7 | 0.168 | 0.771 | 0.841 | 0.988 | 0.982 | 0.885 | |||
| CTSM51_CRUNCEPV7 | [-] | 288. | 288. | 296. | 329. | -6.50 | 13.9 | 0.202 | 0.735 | 0.807 | 0.986 | 0.933 | 0.854 | |||
| CTSM51_GSWP3V1 | [-] | 294. | 294. | 296. | 329. | 0.139 | 4.83 | 0.0756 | 0.875 | 0.951 | 0.995 | 1.00 | 0.954 |
Download Data |
Period Mean (original grids) [Watt m-2] |
Model Period Mean (intersection) [Watt m-2] |
Benchmark Period Mean (intersection) [Watt m-2] |
Model Period Mean (complement) [Watt m-2] |
Benchmark Period Mean (complement) [Watt m-2] |
Bias [Watt m-2] |
RMSE [Watt m-2] |
Phase Shift [months] |
Bias Score [1] |
RMSE Score [1] |
Seasonal Cycle Score [1] |
Spatial Distribution Score [1] |
Overall Score [1] |
|||
|---|---|---|---|---|---|---|---|---|---|---|---|---|---|---|---|---|
| Benchmark | [-] | 406. | ||||||||||||||
| CTSM51_CRUJRA | [-] | 425. | 424. | 405. | 411. | 19.4 | 24.3 | 2.17 | 0.142 | 0.595 | 0.654 | 0.645 | 0.526 | |||
| CTSM51_CRUJRA_FLDS | [-] | 403. | 402. | 405. | 411. | -2.54 | 7.87 | 2.53 | 0.606 | 0.675 | 0.577 | 0.910 | 0.689 | |||
| CTSM51_CRUNCEPV7 | [-] | 425. | 424. | 405. | 411. | 18.8 | 22.9 | 2.07 | 0.151 | 0.602 | 0.669 | 0.710 | 0.547 | |||
| CTSM51_GSWP3V1 | [-] | 406. | 405. | 405. | 411. | -0.271 | 3.71 | 0.478 | 0.744 | 0.882 | 0.934 | 0.996 | 0.887 |
Download Data |
Period Mean (original grids) [Watt m-2] |
Model Period Mean (intersection) [Watt m-2] |
Benchmark Period Mean (intersection) [Watt m-2] |
Model Period Mean (complement) [Watt m-2] |
Benchmark Period Mean (complement) [Watt m-2] |
Bias [Watt m-2] |
RMSE [Watt m-2] |
Phase Shift [months] |
Bias Score [1] |
RMSE Score [1] |
Seasonal Cycle Score [1] |
Spatial Distribution Score [1] |
Overall Score [1] |
|||
|---|---|---|---|---|---|---|---|---|---|---|---|---|---|---|---|---|
| Benchmark | [-] | 376. | ||||||||||||||
| CTSM51_CRUJRA | [-] | 383. | 383. | 375. | 383. | 7.51 | 13.9 | 1.25 | 0.620 | 0.715 | 0.806 | 0.923 | 0.756 | |||
| CTSM51_CRUJRA_FLDS | [-] | 371. | 370. | 375. | 383. | -5.14 | 8.65 | 1.07 | 0.748 | 0.799 | 0.831 | 0.977 | 0.831 | |||
| CTSM51_CRUNCEPV7 | [-] | 384. | 384. | 375. | 383. | 8.26 | 15.0 | 1.24 | 0.573 | 0.724 | 0.812 | 0.896 | 0.746 | |||
| CTSM51_GSWP3V1 | [-] | 376. | 375. | 375. | 383. | -0.288 | 3.88 | 0.213 | 0.854 | 0.930 | 0.977 | 0.999 | 0.938 |
Download Data |
Period Mean (original grids) [Watt m-2] |
Model Period Mean (intersection) [Watt m-2] |
Benchmark Period Mean (intersection) [Watt m-2] |
Model Period Mean (complement) [Watt m-2] |
Benchmark Period Mean (complement) [Watt m-2] |
Bias [Watt m-2] |
RMSE [Watt m-2] |
Phase Shift [months] |
Bias Score [1] |
RMSE Score [1] |
Seasonal Cycle Score [1] |
Spatial Distribution Score [1] |
Overall Score [1] |
|||
|---|---|---|---|---|---|---|---|---|---|---|---|---|---|---|---|---|
| Benchmark | [-] | 307. | ||||||||||||||
| CTSM51_CRUJRA | [-] | 294. | 293. | 305. | 346. | -6.89 | 21.9 | 0.534 | 0.454 | 0.683 | 0.955 | 0.980 | 0.751 | |||
| CTSM51_CRUJRA_FLDS | [-] | 288. | 287. | 305. | 346. | -9.66 | 24.7 | 0.553 | 0.408 | 0.718 | 0.954 | 0.885 | 0.737 | |||
| CTSM51_CRUNCEPV7 | [-] | 291. | 290. | 305. | 346. | -10.2 | 22.1 | 0.484 | 0.449 | 0.700 | 0.957 | 0.983 | 0.758 | |||
| CTSM51_GSWP3V1 | [-] | 302. | 302. | 305. | 346. | 1.92 | 11.3 | 0.245 | 0.654 | 0.853 | 0.975 | 0.998 | 0.866 |
Temporally integrated period mean