Mean State
Download Data |
Period Mean (original grids) [%] |
Model Period Mean (intersection) [%] |
Benchmark Period Mean (intersection) [%] |
Model Period Mean (complement) [%] |
Benchmark Period Mean (complement) [%] |
Bias [%] |
RMSE [%] |
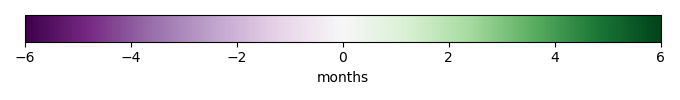
Phase Shift [months] |
Bias Score [1] |
RMSE Score [1] |
Seasonal Cycle Score [1] |
Spatial Distribution Score [1] |
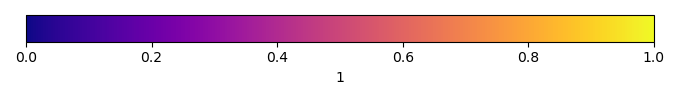
Overall Score [1] |
|||
|---|---|---|---|---|---|---|---|---|---|---|---|---|---|---|---|---|
| Benchmark | [-] | 75.1 | ||||||||||||||
| CTSM51_CRUJRA | [-] | 75.4 | 75.1 | 74.8 | 91.8 | 0.902 | 5.52 | 1.74 | 0.410 | 0.621 | 0.733 | 0.997 | 0.676 | |||
| CTSM51_CRUJRA_FLDS | [-] | 77.1 | 76.8 | 74.8 | 91.8 | 2.62 | 6.25 | 1.66 | 0.346 | 0.600 | 0.745 | 0.996 | 0.657 | |||
| CTSM51_CRUNCEPV7 | [-] | 73.2 | 73.0 | 74.8 | 91.8 | -1.03 | 4.70 | 1.62 | 0.488 | 0.607 | 0.757 | 0.993 | 0.690 | |||
| CTSM51_GSWP3V1 | [-] | 69.5 | 69.1 | 74.8 | 91.8 | -4.47 | 12.6 | 2.35 | 0.262 | 0.254 | 0.633 | 0.870 | 0.454 |
Download Data |
Period Mean (original grids) [%] |
Model Period Mean (intersection) [%] |
Benchmark Period Mean (intersection) [%] |
Model Period Mean (complement) [%] |
Benchmark Period Mean (complement) [%] |
Bias [%] |
RMSE [%] |
Phase Shift [months] |
Bias Score [1] |
RMSE Score [1] |
Seasonal Cycle Score [1] |
Spatial Distribution Score [1] |
Overall Score [1] |
|||
|---|---|---|---|---|---|---|---|---|---|---|---|---|---|---|---|---|
| Benchmark | [-] | 53.2 | ||||||||||||||
| CTSM51_CRUJRA | [-] | 51.7 | 52.2 | 53.1 | 93.3 | -0.708 | 5.11 | 0.242 | 0.784 | 0.816 | 0.970 | 0.984 | 0.874 | |||
| CTSM51_CRUJRA_FLDS | [-] | 54.1 | 54.6 | 53.1 | 93.3 | 1.68 | 5.93 | 0.278 | 0.752 | 0.799 | 0.968 | 0.986 | 0.861 | |||
| CTSM51_CRUNCEPV7 | [-] | 51.0 | 51.3 | 53.1 | 93.3 | -1.26 | 4.35 | 0.214 | 0.800 | 0.851 | 0.972 | 0.989 | 0.893 | |||
| CTSM51_GSWP3V1 | [-] | 50.9 | 51.2 | 53.1 | 93.3 | -1.42 | 9.66 | 0.557 | 0.730 | 0.609 | 0.944 | 0.996 | 0.777 |
Download Data |
Period Mean (original grids) [%] |
Model Period Mean (intersection) [%] |
Benchmark Period Mean (intersection) [%] |
Model Period Mean (complement) [%] |
Benchmark Period Mean (complement) [%] |
Bias [%] |
RMSE [%] |
Phase Shift [months] |
Bias Score [1] |
RMSE Score [1] |
Seasonal Cycle Score [1] |
Spatial Distribution Score [1] |
Overall Score [1] |
|||
|---|---|---|---|---|---|---|---|---|---|---|---|---|---|---|---|---|
| Benchmark | [-] | 68.1 | ||||||||||||||
| CTSM51_CRUJRA | [-] | 62.4 | 62.4 | 67.5 | 92.0 | -3.62 | 6.57 | 1.06 | 0.507 | 0.730 | 0.855 | 0.953 | 0.755 | |||
| CTSM51_CRUJRA_FLDS | [-] | 64.2 | 64.2 | 67.5 | 92.0 | -1.88 | 6.08 | 1.04 | 0.546 | 0.710 | 0.861 | 0.956 | 0.756 | |||
| CTSM51_CRUNCEPV7 | [-] | 61.7 | 61.7 | 67.5 | 92.0 | -4.14 | 6.06 | 0.864 | 0.525 | 0.750 | 0.888 | 0.959 | 0.775 | |||
| CTSM51_GSWP3V1 | [-] | 61.9 | 61.9 | 67.5 | 92.0 | -4.16 | 11.1 | 1.24 | 0.431 | 0.454 | 0.836 | 0.982 | 0.631 |
Download Data |
Period Mean (original grids) [%] |
Model Period Mean (intersection) [%] |
Benchmark Period Mean (intersection) [%] |
Model Period Mean (complement) [%] |
Benchmark Period Mean (complement) [%] |
Bias [%] |
RMSE [%] |
Phase Shift [months] |
Bias Score [1] |
RMSE Score [1] |
Seasonal Cycle Score [1] |
Spatial Distribution Score [1] |
Overall Score [1] |
|||
|---|---|---|---|---|---|---|---|---|---|---|---|---|---|---|---|---|
| Benchmark | [-] | 72.7 | ||||||||||||||
| CTSM51_CRUJRA | [-] | 87.5 | 87.5 | 71.6 | 92.7 | 16.3 | 21.2 | 2.54 | 0.381 | 0.536 | 0.603 | 0.169 | 0.445 | |||
| CTSM51_CRUJRA_FLDS | [-] | 85.3 | 85.3 | 71.6 | 92.7 | 14.3 | 20.1 | 2.72 | 0.431 | 0.525 | 0.567 | 0.198 | 0.449 | |||
| CTSM51_CRUNCEPV7 | [-] | 79.4 | 79.3 | 71.4 | 92.8 | 10.1 | 14.7 | 2.07 | 0.506 | 0.603 | 0.667 | 0.862 | 0.648 | |||
| CTSM51_GSWP3V1 | [-] | 89.4 | 89.3 | 71.4 | 92.8 | 18.2 | 24.8 | 3.39 | 0.357 | 0.423 | 0.437 | 0.113 | 0.351 |
Download Data |
Period Mean (original grids) [%] |
Model Period Mean (intersection) [%] |
Benchmark Period Mean (intersection) [%] |
Model Period Mean (complement) [%] |
Benchmark Period Mean (complement) [%] |
Bias [%] |
RMSE [%] |
Phase Shift [months] |
Bias Score [1] |
RMSE Score [1] |
Seasonal Cycle Score [1] |
Spatial Distribution Score [1] |
Overall Score [1] |
|||
|---|---|---|---|---|---|---|---|---|---|---|---|---|---|---|---|---|
| Benchmark | [-] | 86.2 | ||||||||||||||
| CTSM51_CRUJRA | [-] | 84.4 | 84.6 | 85.5 | 92.7 | -2.20 | 6.57 | 2.17 | 0.282 | 0.571 | 0.665 | 0.622 | 0.542 | |||
| CTSM51_CRUJRA_FLDS | [-] | 86.2 | 86.3 | 85.5 | 92.7 | -0.377 | 6.66 | 2.29 | 0.226 | 0.562 | 0.641 | 0.699 | 0.538 | |||
| CTSM51_CRUNCEPV7 | [-] | 85.2 | 85.3 | 85.5 | 92.7 | -0.533 | 5.84 | 2.04 | 0.267 | 0.601 | 0.680 | 0.590 | 0.548 | |||
| CTSM51_GSWP3V1 | [-] | 85.7 | 85.9 | 85.5 | 92.7 | -0.701 | 6.81 | 2.26 | 0.267 | 0.454 | 0.649 | 0.455 | 0.456 |
Download Data |
Period Mean (original grids) [%] |
Model Period Mean (intersection) [%] |
Benchmark Period Mean (intersection) [%] |
Model Period Mean (complement) [%] |
Benchmark Period Mean (complement) [%] |
Bias [%] |
RMSE [%] |
Phase Shift [months] |
Bias Score [1] |
RMSE Score [1] |
Seasonal Cycle Score [1] |
Spatial Distribution Score [1] |
Overall Score [1] |
|||
|---|---|---|---|---|---|---|---|---|---|---|---|---|---|---|---|---|
| Benchmark | [-] | 72.9 | ||||||||||||||
| CTSM51_CRUJRA | [-] | 83.4 | 83.6 | 72.8 | 91.4 | 10.7 | 13.5 | 1.82 | 0.478 | 0.640 | 0.728 | 0.479 | 0.593 | |||
| CTSM51_CRUJRA_FLDS | [-] | 82.1 | 82.3 | 72.8 | 91.4 | 9.45 | 12.7 | 2.00 | 0.532 | 0.618 | 0.694 | 0.437 | 0.580 | |||
| CTSM51_CRUNCEPV7 | [-] | 78.4 | 78.7 | 72.7 | 91.5 | 6.06 | 8.99 | 1.21 | 0.629 | 0.689 | 0.830 | 0.920 | 0.751 | |||
| CTSM51_GSWP3V1 | [-] | 83.2 | 83.3 | 72.7 | 91.5 | 10.6 | 17.7 | 1.90 | 0.510 | 0.402 | 0.722 | 0.395 | 0.486 |
Download Data |
Period Mean (original grids) [%] |
Model Period Mean (intersection) [%] |
Benchmark Period Mean (intersection) [%] |
Model Period Mean (complement) [%] |
Benchmark Period Mean (complement) [%] |
Bias [%] |
RMSE [%] |
Phase Shift [months] |
Bias Score [1] |
RMSE Score [1] |
Seasonal Cycle Score [1] |
Spatial Distribution Score [1] |
Overall Score [1] |
|||
|---|---|---|---|---|---|---|---|---|---|---|---|---|---|---|---|---|
| Benchmark | [-] | 57.3 | ||||||||||||||
| CTSM51_CRUJRA | [-] | 64.7 | 64.8 | 56.9 | 86.3 | 8.68 | 12.5 | 1.33 | 0.536 | 0.661 | 0.804 | 0.741 | 0.680 | |||
| CTSM51_CRUJRA_FLDS | [-] | 64.8 | 64.8 | 56.9 | 86.3 | 8.76 | 12.9 | 1.35 | 0.548 | 0.650 | 0.801 | 0.668 | 0.663 | |||
| CTSM51_CRUNCEPV7 | [-] | 57.8 | 57.8 | 56.8 | 86.4 | 2.51 | 8.02 | 1.01 | 0.644 | 0.721 | 0.855 | 0.966 | 0.781 | |||
| CTSM51_GSWP3V1 | [-] | 65.6 | 65.7 | 56.8 | 86.4 | 9.52 | 20.5 | 1.72 | 0.458 | 0.440 | 0.734 | 0.799 | 0.574 |
Download Data |
Period Mean (original grids) [%] |
Model Period Mean (intersection) [%] |
Benchmark Period Mean (intersection) [%] |
Model Period Mean (complement) [%] |
Benchmark Period Mean (complement) [%] |
Bias [%] |
RMSE [%] |
Phase Shift [months] |
Bias Score [1] |
RMSE Score [1] |
Seasonal Cycle Score [1] |
Spatial Distribution Score [1] |
Overall Score [1] |
|||
|---|---|---|---|---|---|---|---|---|---|---|---|---|---|---|---|---|
| Benchmark | [-] | 67.0 | ||||||||||||||
| CTSM51_CRUJRA | [-] | 65.4 | 64.8 | 66.4 | 93.8 | 0.822 | 8.07 | 1.13 | 0.565 | 0.687 | 0.833 | 0.857 | 0.726 | |||
| CTSM51_CRUJRA_FLDS | [-] | 67.4 | 66.9 | 66.4 | 93.8 | 2.95 | 8.73 | 1.13 | 0.517 | 0.672 | 0.835 | 0.865 | 0.712 | |||
| CTSM51_CRUNCEPV7 | [-] | 62.6 | 62.0 | 66.4 | 93.8 | -1.04 | 6.67 | 0.997 | 0.600 | 0.713 | 0.856 | 0.942 | 0.765 | |||
| CTSM51_GSWP3V1 | [-] | 63.4 | 62.6 | 66.4 | 93.8 | -0.623 | 12.6 | 1.42 | 0.507 | 0.472 | 0.787 | 0.980 | 0.644 |
Download Data |
Period Mean (original grids) [%] |
Model Period Mean (intersection) [%] |
Benchmark Period Mean (intersection) [%] |
Model Period Mean (complement) [%] |
Benchmark Period Mean (complement) [%] |
Bias [%] |
RMSE [%] |
Phase Shift [months] |
Bias Score [1] |
RMSE Score [1] |
Seasonal Cycle Score [1] |
Spatial Distribution Score [1] |
Overall Score [1] |
|||
|---|---|---|---|---|---|---|---|---|---|---|---|---|---|---|---|---|
| Benchmark | [-] | 77.4 | ||||||||||||||
| CTSM51_CRUJRA | [-] | 89.7 | 89.5 | 77.1 | 93.6 | 12.5 | 15.7 | 2.47 | 0.425 | 0.603 | 0.599 | 0.191 | 0.485 | |||
| CTSM51_CRUJRA_FLDS | [-] | 88.1 | 87.9 | 77.1 | 93.6 | 11.0 | 14.6 | 2.74 | 0.476 | 0.598 | 0.543 | 0.204 | 0.484 | |||
| CTSM51_CRUNCEPV7 | [-] | 85.3 | 85.1 | 77.1 | 93.6 | 8.90 | 11.8 | 2.00 | 0.522 | 0.647 | 0.686 | 0.804 | 0.661 | |||
| CTSM51_GSWP3V1 | [-] | 90.0 | 89.8 | 77.1 | 93.6 | 13.0 | 18.3 | 3.31 | 0.434 | 0.452 | 0.445 | 0.206 | 0.398 |
Download Data |
Period Mean (original grids) [%] |
Model Period Mean (intersection) [%] |
Benchmark Period Mean (intersection) [%] |
Model Period Mean (complement) [%] |
Benchmark Period Mean (complement) [%] |
Bias [%] |
RMSE [%] |
Phase Shift [months] |
Bias Score [1] |
RMSE Score [1] |
Seasonal Cycle Score [1] |
Spatial Distribution Score [1] |
Overall Score [1] |
|||
|---|---|---|---|---|---|---|---|---|---|---|---|---|---|---|---|---|
| Benchmark | [-] | 55.2 | ||||||||||||||
| CTSM51_CRUJRA | [-] | 49.3 | 49.1 | 53.9 | 87.3 | -2.14 | 6.30 | 0.572 | 0.621 | 0.769 | 0.910 | 0.912 | 0.796 | |||
| CTSM51_CRUJRA_FLDS | [-] | 49.8 | 49.6 | 53.9 | 87.3 | -1.72 | 6.32 | 0.563 | 0.622 | 0.760 | 0.911 | 0.906 | 0.792 | |||
| CTSM51_CRUNCEPV7 | [-] | 52.3 | 52.1 | 54.0 | 87.3 | 1.42 | 6.15 | 0.621 | 0.559 | 0.810 | 0.905 | 0.917 | 0.800 | |||
| CTSM51_GSWP3V1 | [-] | 50.7 | 50.5 | 54.0 | 87.3 | 0.114 | 8.11 | 0.620 | 0.541 | 0.610 | 0.905 | 0.976 | 0.728 |
Download Data |
Period Mean (original grids) [%] |
Model Period Mean (intersection) [%] |
Benchmark Period Mean (intersection) [%] |
Model Period Mean (complement) [%] |
Benchmark Period Mean (complement) [%] |
Bias [%] |
RMSE [%] |
Phase Shift [months] |
Bias Score [1] |
RMSE Score [1] |
Seasonal Cycle Score [1] |
Spatial Distribution Score [1] |
Overall Score [1] |
|||
|---|---|---|---|---|---|---|---|---|---|---|---|---|---|---|---|---|
| Benchmark | [-] | 78.5 | ||||||||||||||
| CTSM51_CRUJRA | [-] | 79.9 | 79.9 | 78.3 | 92.3 | 0.996 | 6.74 | 0.644 | 0.565 | 0.754 | 0.935 | 0.912 | 0.784 | |||
| CTSM51_CRUJRA_FLDS | [-] | 78.8 | 78.7 | 78.3 | 92.3 | 0.138 | 6.27 | 0.674 | 0.612 | 0.737 | 0.930 | 0.851 | 0.773 | |||
| CTSM51_CRUNCEPV7 | [-] | 78.5 | 78.4 | 78.4 | 92.3 | 0.812 | 5.43 | 0.693 | 0.621 | 0.759 | 0.930 | 0.949 | 0.804 | |||
| CTSM51_GSWP3V1 | [-] | 78.6 | 78.4 | 78.4 | 92.3 | -0.191 | 9.23 | 1.01 | 0.568 | 0.512 | 0.874 | 0.963 | 0.686 |
Download Data |
Period Mean (original grids) [%] |
Model Period Mean (intersection) [%] |
Benchmark Period Mean (intersection) [%] |
Model Period Mean (complement) [%] |
Benchmark Period Mean (complement) [%] |
Bias [%] |
RMSE [%] |
Phase Shift [months] |
Bias Score [1] |
RMSE Score [1] |
Seasonal Cycle Score [1] |
Spatial Distribution Score [1] |
Overall Score [1] |
|||
|---|---|---|---|---|---|---|---|---|---|---|---|---|---|---|---|---|
| Benchmark | [-] | 68.9 | ||||||||||||||
| CTSM51_CRUJRA | [-] | 69.9 | 69.8 | 68.4 | 91.3 | 2.30 | 8.84 | 1.43 | 0.480 | 0.669 | 0.783 | 0.929 | 0.706 | |||
| CTSM51_CRUJRA_FLDS | [-] | 70.4 | 70.3 | 68.4 | 91.3 | 2.80 | 9.22 | 1.45 | 0.462 | 0.650 | 0.782 | 0.905 | 0.690 | |||
| CTSM51_CRUNCEPV7 | [-] | 67.3 | 67.2 | 68.4 | 91.3 | 0.476 | 7.64 | 1.18 | 0.543 | 0.721 | 0.831 | 0.968 | 0.757 | |||
| CTSM51_GSWP3V1 | [-] | 70.4 | 70.3 | 68.4 | 91.3 | 2.97 | 12.7 | 1.64 | 0.428 | 0.449 | 0.758 | 0.981 | 0.613 |
Download Data |
Period Mean (original grids) [%] |
Model Period Mean (intersection) [%] |
Benchmark Period Mean (intersection) [%] |
Model Period Mean (complement) [%] |
Benchmark Period Mean (complement) [%] |
Bias [%] |
RMSE [%] |
Phase Shift [months] |
Bias Score [1] |
RMSE Score [1] |
Seasonal Cycle Score [1] |
Spatial Distribution Score [1] |
Overall Score [1] |
|||
|---|---|---|---|---|---|---|---|---|---|---|---|---|---|---|---|---|
| Benchmark | [-] | 44.5 | ||||||||||||||
| CTSM51_CRUJRA | [-] | 48.0 | 48.0 | 44.2 | 91.8 | 5.54 | 11.1 | 0.756 | 0.400 | 0.628 | 0.905 | 0.836 | 0.679 | |||
| CTSM51_CRUJRA_FLDS | [-] | 50.1 | 50.1 | 44.2 | 91.8 | 7.59 | 12.6 | 0.751 | 0.340 | 0.606 | 0.903 | 0.837 | 0.659 | |||
| CTSM51_CRUNCEPV7 | [-] | 43.6 | 43.5 | 44.1 | 91.9 | 1.78 | 6.83 | 0.458 | 0.564 | 0.760 | 0.942 | 0.926 | 0.791 | |||
| CTSM51_GSWP3V1 | [-] | 41.8 | 41.7 | 44.1 | 91.9 | 0.231 | 13.1 | 0.870 | 0.401 | 0.413 | 0.877 | 0.884 | 0.597 |
Download Data |
Period Mean (original grids) [%] |
Model Period Mean (intersection) [%] |
Benchmark Period Mean (intersection) [%] |
Model Period Mean (complement) [%] |
Benchmark Period Mean (complement) [%] |
Bias [%] |
RMSE [%] |
Phase Shift [months] |
Bias Score [1] |
RMSE Score [1] |
Seasonal Cycle Score [1] |
Spatial Distribution Score [1] |
Overall Score [1] |
|||
|---|---|---|---|---|---|---|---|---|---|---|---|---|---|---|---|---|
| Benchmark | [-] | 83.0 | ||||||||||||||
| CTSM51_CRUJRA | [-] | 82.0 | 82.0 | 82.8 | 93.7 | -0.329 | 10.6 | 2.57 | 0.577 | 0.536 | 0.580 | 0.487 | 0.543 | |||
| CTSM51_CRUJRA_FLDS | [-] | 79.5 | 79.5 | 82.8 | 93.7 | -2.74 | 11.5 | 2.62 | 0.520 | 0.526 | 0.575 | 0.612 | 0.552 | |||
| CTSM51_CRUNCEPV7 | [-] | 86.1 | 86.1 | 82.7 | 93.7 | 4.85 | 8.68 | 2.19 | 0.578 | 0.599 | 0.661 | 0.924 | 0.672 | |||
| CTSM51_GSWP3V1 | [-] | 89.4 | 89.3 | 82.7 | 93.7 | 7.24 | 14.4 | 2.63 | 0.519 | 0.393 | 0.586 | 0.402 | 0.459 |
Download Data |
Period Mean (original grids) [%] |
Model Period Mean (intersection) [%] |
Benchmark Period Mean (intersection) [%] |
Model Period Mean (complement) [%] |
Benchmark Period Mean (complement) [%] |
Bias [%] |
RMSE [%] |
Phase Shift [months] |
Bias Score [1] |
RMSE Score [1] |
Seasonal Cycle Score [1] |
Spatial Distribution Score [1] |
Overall Score [1] |
|||
|---|---|---|---|---|---|---|---|---|---|---|---|---|---|---|---|---|
| Benchmark | [-] | 72.3 | ||||||||||||||
| CTSM51_CRUJRA | [-] | 64.6 | 64.2 | 71.1 | 93.2 | -3.04 | 8.58 | 1.35 | 0.436 | 0.640 | 0.790 | 0.865 | 0.674 | |||
| CTSM51_CRUJRA_FLDS | [-] | 66.4 | 66.0 | 71.1 | 93.2 | -1.10 | 8.73 | 1.41 | 0.409 | 0.626 | 0.776 | 0.883 | 0.664 | |||
| CTSM51_CRUNCEPV7 | [-] | 64.2 | 63.8 | 71.2 | 93.2 | -2.48 | 7.52 | 1.29 | 0.462 | 0.657 | 0.809 | 0.945 | 0.706 | |||
| CTSM51_GSWP3V1 | [-] | 67.7 | 67.4 | 71.2 | 93.2 | -0.828 | 11.3 | 1.70 | 0.330 | 0.475 | 0.737 | 0.882 | 0.580 |
Download Data |
Period Mean (original grids) [%] |
Model Period Mean (intersection) [%] |
Benchmark Period Mean (intersection) [%] |
Model Period Mean (complement) [%] |
Benchmark Period Mean (complement) [%] |
Bias [%] |
RMSE [%] |
Phase Shift [months] |
Bias Score [1] |
RMSE Score [1] |
Seasonal Cycle Score [1] |
Spatial Distribution Score [1] |
Overall Score [1] |
|||
|---|---|---|---|---|---|---|---|---|---|---|---|---|---|---|---|---|
| Benchmark | [-] | 73.0 | ||||||||||||||
| CTSM51_CRUJRA | [-] | 74.1 | 74.0 | 72.6 | 90.3 | 1.44 | 4.80 | 1.44 | 0.612 | 0.764 | 0.772 | 0.771 | 0.737 | |||
| CTSM51_CRUJRA_FLDS | [-] | 73.6 | 73.5 | 72.6 | 90.3 | 1.10 | 5.11 | 2.13 | 0.628 | 0.681 | 0.635 | 0.754 | 0.676 | |||
| CTSM51_CRUNCEPV7 | [-] | 73.9 | 73.7 | 72.8 | 90.4 | 1.62 | 4.59 | 1.44 | 0.618 | 0.746 | 0.775 | 0.937 | 0.764 | |||
| CTSM51_GSWP3V1 | [-] | 77.1 | 77.0 | 72.8 | 90.4 | 4.16 | 9.38 | 2.19 | 0.420 | 0.438 | 0.658 | 0.859 | 0.563 |
Download Data |
Period Mean (original grids) [%] |
Model Period Mean (intersection) [%] |
Benchmark Period Mean (intersection) [%] |
Model Period Mean (complement) [%] |
Benchmark Period Mean (complement) [%] |
Bias [%] |
RMSE [%] |
Phase Shift [months] |
Bias Score [1] |
RMSE Score [1] |
Seasonal Cycle Score [1] |
Spatial Distribution Score [1] |
Overall Score [1] |
|||
|---|---|---|---|---|---|---|---|---|---|---|---|---|---|---|---|---|
| Benchmark | [-] | 79.5 | ||||||||||||||
| CTSM51_CRUJRA | [-] | 78.4 | 78.3 | 79.3 | 90.5 | -0.753 | 6.82 | 1.02 | 0.761 | 0.592 | 0.878 | 0.798 | 0.724 | |||
| CTSM51_CRUJRA_FLDS | [-] | 76.3 | 76.2 | 79.3 | 90.5 | -2.82 | 8.00 | 1.38 | 0.708 | 0.552 | 0.817 | 0.832 | 0.692 | |||
| CTSM51_CRUNCEPV7 | [-] | 80.8 | 80.7 | 79.3 | 90.5 | 1.88 | 4.50 | 0.905 | 0.758 | 0.738 | 0.902 | 0.965 | 0.820 | |||
| CTSM51_GSWP3V1 | [-] | 82.6 | 82.6 | 79.3 | 90.5 | 3.46 | 8.08 | 1.09 | 0.675 | 0.559 | 0.881 | 0.849 | 0.705 |
Download Data |
Period Mean (original grids) [%] |
Model Period Mean (intersection) [%] |
Benchmark Period Mean (intersection) [%] |
Model Period Mean (complement) [%] |
Benchmark Period Mean (complement) [%] |
Bias [%] |
RMSE [%] |
Phase Shift [months] |
Bias Score [1] |
RMSE Score [1] |
Seasonal Cycle Score [1] |
Spatial Distribution Score [1] |
Overall Score [1] |
|||
|---|---|---|---|---|---|---|---|---|---|---|---|---|---|---|---|---|
| Benchmark | [-] | 56.3 | ||||||||||||||
| CTSM51_CRUJRA | [-] | 57.9 | 57.8 | 56.2 | 80.8 | 2.40 | 5.90 | 1.05 | 0.695 | 0.734 | 0.873 | 0.962 | 0.800 | |||
| CTSM51_CRUJRA_FLDS | [-] | 57.5 | 57.5 | 56.2 | 80.8 | 2.11 | 6.00 | 1.09 | 0.695 | 0.729 | 0.864 | 0.926 | 0.789 | |||
| CTSM51_CRUNCEPV7 | [-] | 56.6 | 56.5 | 56.3 | 81.0 | 1.28 | 4.68 | 0.889 | 0.746 | 0.767 | 0.896 | 0.983 | 0.832 | |||
| CTSM51_GSWP3V1 | [-] | 64.5 | 64.4 | 56.3 | 81.0 | 8.59 | 13.6 | 1.07 | 0.437 | 0.492 | 0.867 | 0.977 | 0.653 |
Download Data |
Period Mean (original grids) [%] |
Model Period Mean (intersection) [%] |
Benchmark Period Mean (intersection) [%] |
Model Period Mean (complement) [%] |
Benchmark Period Mean (complement) [%] |
Bias [%] |
RMSE [%] |
Phase Shift [months] |
Bias Score [1] |
RMSE Score [1] |
Seasonal Cycle Score [1] |
Spatial Distribution Score [1] |
Overall Score [1] |
|||
|---|---|---|---|---|---|---|---|---|---|---|---|---|---|---|---|---|
| Benchmark | [-] | 82.0 | ||||||||||||||
| CTSM51_CRUJRA | [-] | 84.2 | 84.0 | 81.8 | 93.3 | 1.98 | 4.32 | 0.958 | 0.469 | 0.699 | 0.875 | 0.996 | 0.748 | |||
| CTSM51_CRUJRA_FLDS | [-] | 86.3 | 86.1 | 81.8 | 93.3 | 4.10 | 6.05 | 1.01 | 0.310 | 0.647 | 0.871 | 0.998 | 0.695 | |||
| CTSM51_CRUNCEPV7 | [-] | 82.8 | 82.6 | 81.8 | 93.3 | 0.762 | 3.33 | 0.951 | 0.584 | 0.708 | 0.870 | 0.988 | 0.771 | |||
| CTSM51_GSWP3V1 | [-] | 80.3 | 80.5 | 81.8 | 93.3 | -1.24 | 9.55 | 1.77 | 0.307 | 0.287 | 0.750 | 0.963 | 0.519 |
Download Data |
Period Mean (original grids) [%] |
Model Period Mean (intersection) [%] |
Benchmark Period Mean (intersection) [%] |
Model Period Mean (complement) [%] |
Benchmark Period Mean (complement) [%] |
Bias [%] |
RMSE [%] |
Phase Shift [months] |
Bias Score [1] |
RMSE Score [1] |
Seasonal Cycle Score [1] |
Spatial Distribution Score [1] |
Overall Score [1] |
|||
|---|---|---|---|---|---|---|---|---|---|---|---|---|---|---|---|---|
| Benchmark | [-] | 72.6 | ||||||||||||||
| CTSM51_CRUJRA | [-] | 71.8 | 71.6 | 72.3 | 92.0 | -0.217 | 4.62 | 1.02 | 0.622 | 0.726 | 0.865 | 0.987 | 0.785 | |||
| CTSM51_CRUJRA_FLDS | [-] | 73.6 | 73.4 | 72.3 | 92.0 | 1.48 | 5.19 | 1.10 | 0.571 | 0.713 | 0.854 | 0.985 | 0.767 | |||
| CTSM51_CRUNCEPV7 | [-] | 70.0 | 69.8 | 72.3 | 92.0 | -1.68 | 3.87 | 0.887 | 0.655 | 0.773 | 0.891 | 0.998 | 0.818 | |||
| CTSM51_GSWP3V1 | [-] | 72.0 | 71.9 | 72.3 | 92.0 | 0.0972 | 11.0 | 1.49 | 0.370 | 0.426 | 0.803 | 0.910 | 0.587 |
Download Data |
Period Mean (original grids) [%] |
Model Period Mean (intersection) [%] |
Benchmark Period Mean (intersection) [%] |
Model Period Mean (complement) [%] |
Benchmark Period Mean (complement) [%] |
Bias [%] |
RMSE [%] |
Phase Shift [months] |
Bias Score [1] |
RMSE Score [1] |
Seasonal Cycle Score [1] |
Spatial Distribution Score [1] |
Overall Score [1] |
|||
|---|---|---|---|---|---|---|---|---|---|---|---|---|---|---|---|---|
| Benchmark | [-] | 61.9 | ||||||||||||||
| CTSM51_CRUJRA | [-] | 59.1 | 59.4 | 60.6 | 91.9 | 1.60 | 12.0 | 1.45 | 0.379 | 0.627 | 0.786 | 0.788 | 0.642 | |||
| CTSM51_CRUJRA_FLDS | [-] | 59.6 | 60.0 | 60.6 | 91.9 | 1.90 | 12.3 | 1.45 | 0.374 | 0.617 | 0.787 | 0.718 | 0.623 | |||
| CTSM51_CRUNCEPV7 | [-] | 55.3 | 55.4 | 60.5 | 92.0 | -1.05 | 10.2 | 1.30 | 0.421 | 0.652 | 0.821 | 0.931 | 0.695 | |||
| CTSM51_GSWP3V1 | [-] | 64.3 | 63.6 | 60.5 | 92.0 | 5.08 | 17.7 | 1.24 | 0.240 | 0.482 | 0.826 | 0.889 | 0.584 |
Temporally integrated period mean