Mean State
Download Data |
Period Mean (original grids) [Watt/m2] |
Model Period Mean (intersection) [Watt/m2] |
Benchmark Period Mean (intersection) [Watt/m2] |
Model Period Mean (complement) [Watt/m2] |
Benchmark Period Mean (complement) [Watt/m2] |
Bias [Watt/m2] |
RMSE [Watt/m2] |
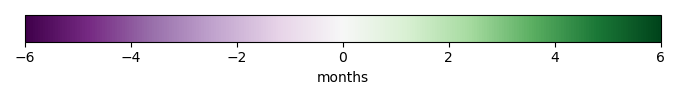
Phase Shift [months] |
Bias Score [1] |
RMSE Score [1] |
Seasonal Cycle Score [1] |
Spatial Distribution Score [1] |
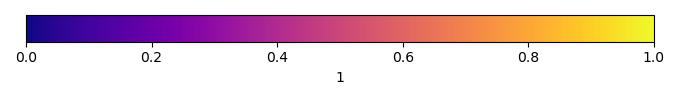
Overall Score [1] |
|||
|---|---|---|---|---|---|---|---|---|---|---|---|---|---|---|---|---|
| Benchmark | [-] | 44.1 | ||||||||||||||
| CTSM51_CRUJRA | [-] | 51.6 | 52.4 | 44.2 | 58.1 | 10.1 | 8.76 | 21.1 | 2.00 | 0.511 | 0.593 | 0.705 | 0.602 | 0.601 | ||
| CTSM51_CRUJRA_FLDS | [-] | 44.0 | 44.9 | 44.2 | 44.9 | 10.1 | 0.968 | 17.9 | 2.19 | 0.473 | 0.617 | 0.674 | 0.744 | 0.625 | ||
| CTSM51_CRUNCEPV7 | [-] | 47.1 | 47.3 | 44.2 | 56.5 | 10.1 | 3.78 | 18.4 | 1.24 | 0.428 | 0.686 | 0.815 | 0.675 | 0.658 | ||
| CTSM51_GSWP3V1 | [-] | 36.3 | 37.1 | 44.2 | 42.7 | 10.1 | -6.47 | 17.4 | 1.36 | 0.332 | 0.725 | 0.800 | 0.815 | 0.680 |
Download Data |
Period Mean (original grids) [Watt/m2] |
Model Period Mean (intersection) [Watt/m2] |
Benchmark Period Mean (intersection) [Watt/m2] |
Model Period Mean (complement) [Watt/m2] |
Benchmark Period Mean (complement) [Watt/m2] |
Bias [Watt/m2] |
RMSE [Watt/m2] |
Phase Shift [months] |
Bias Score [1] |
RMSE Score [1] |
Seasonal Cycle Score [1] |
Spatial Distribution Score [1] |
Overall Score [1] |
|||
|---|---|---|---|---|---|---|---|---|---|---|---|---|---|---|---|---|
| Benchmark | [-] | 57.5 | ||||||||||||||
| CTSM51_CRUJRA | [-] | 61.3 | 61.0 | 57.5 | 85.6 | 3.86 | 22.2 | 1.26 | 0.438 | 0.409 | 0.862 | 0.912 | 0.606 | |||
| CTSM51_CRUJRA_FLDS | [-] | 51.8 | 51.6 | 57.5 | 68.7 | -5.59 | 22.2 | 1.36 | 0.359 | 0.448 | 0.842 | 0.962 | 0.612 | |||
| CTSM51_CRUNCEPV7 | [-] | 60.4 | 60.1 | 57.5 | 82.1 | 3.05 | 18.2 | 0.970 | 0.458 | 0.569 | 0.896 | 0.954 | 0.689 | |||
| CTSM51_GSWP3V1 | [-] | 50.8 | 50.2 | 57.5 | 67.6 | -6.95 | 18.6 | 0.648 | 0.339 | 0.587 | 0.946 | 0.959 | 0.683 |
Download Data |
Period Mean (original grids) [Watt/m2] |
Model Period Mean (intersection) [Watt/m2] |
Benchmark Period Mean (intersection) [Watt/m2] |
Model Period Mean (complement) [Watt/m2] |
Benchmark Period Mean (complement) [Watt/m2] |
Bias [Watt/m2] |
RMSE [Watt/m2] |
Phase Shift [months] |
Bias Score [1] |
RMSE Score [1] |
Seasonal Cycle Score [1] |
Spatial Distribution Score [1] |
Overall Score [1] |
|||
|---|---|---|---|---|---|---|---|---|---|---|---|---|---|---|---|---|
| Benchmark | [-] | 52.8 | ||||||||||||||
| CTSM51_CRUJRA | [-] | 63.2 | 62.0 | 52.9 | 73.6 | 5.37 | 10.0 | 20.0 | 0.683 | 0.325 | 0.663 | 0.921 | 0.839 | 0.682 | ||
| CTSM51_CRUJRA_FLDS | [-] | 55.9 | 54.9 | 52.9 | 65.7 | 5.37 | 2.75 | 17.5 | 0.769 | 0.400 | 0.668 | 0.905 | 0.869 | 0.702 | ||
| CTSM51_CRUNCEPV7 | [-] | 59.8 | 58.5 | 52.9 | 72.2 | 5.37 | 6.78 | 19.6 | 0.438 | 0.347 | 0.650 | 0.958 | 0.824 | 0.686 | ||
| CTSM51_GSWP3V1 | [-] | 53.7 | 52.6 | 52.9 | 63.0 | 5.37 | 0.645 | 17.1 | 0.434 | 0.420 | 0.678 | 0.957 | 0.895 | 0.726 |
Download Data |
Period Mean (original grids) [Watt/m2] |
Model Period Mean (intersection) [Watt/m2] |
Benchmark Period Mean (intersection) [Watt/m2] |
Model Period Mean (complement) [Watt/m2] |
Benchmark Period Mean (complement) [Watt/m2] |
Bias [Watt/m2] |
RMSE [Watt/m2] |
Phase Shift [months] |
Bias Score [1] |
RMSE Score [1] |
Seasonal Cycle Score [1] |
Spatial Distribution Score [1] |
Overall Score [1] |
|||
|---|---|---|---|---|---|---|---|---|---|---|---|---|---|---|---|---|
| Benchmark | [-] | 18.0 | ||||||||||||||
| CTSM51_CRUJRA | [-] | -1.26 | -0.725 | 18.0 | -5.43 | 8.24 | -19.3 | 26.2 | 0.868 | 0.0551 | 0.297 | 0.933 | 0.512 | 0.419 | ||
| CTSM51_CRUJRA_FLDS | [-] | 8.26 | 8.59 | 18.0 | 5.23 | 8.24 | -9.81 | 20.6 | 0.592 | 0.396 | 0.289 | 0.956 | 0.843 | 0.555 | ||
| CTSM51_CRUNCEPV7 | [-] | 1.79 | 2.10 | 18.0 | -0.621 | 8.24 | -16.2 | 24.1 | 0.806 | 0.131 | 0.294 | 0.934 | 0.671 | 0.465 | ||
| CTSM51_GSWP3V1 | [-] | 13.7 | 14.2 | 18.0 | 9.06 | 8.24 | -4.41 | 20.1 | 0.738 | 0.603 | 0.257 | 0.931 | 0.961 | 0.602 |
Download Data |
Period Mean (original grids) [Watt/m2] |
Model Period Mean (intersection) [Watt/m2] |
Benchmark Period Mean (intersection) [Watt/m2] |
Model Period Mean (complement) [Watt/m2] |
Benchmark Period Mean (complement) [Watt/m2] |
Bias [Watt/m2] |
RMSE [Watt/m2] |
Phase Shift [months] |
Bias Score [1] |
RMSE Score [1] |
Seasonal Cycle Score [1] |
Spatial Distribution Score [1] |
Overall Score [1] |
|||
|---|---|---|---|---|---|---|---|---|---|---|---|---|---|---|---|---|
| Benchmark | [-] | 22.1 | ||||||||||||||
| CTSM51_CRUJRA | [-] | 46.1 | 44.5 | 22.3 | 49.8 | 10.9 | 24.8 | 26.4 | 2.19 | 0.159 | 0.710 | 0.655 | 0.792 | 0.605 | ||
| CTSM51_CRUJRA_FLDS | [-] | 39.0 | 38.0 | 22.3 | 40.6 | 10.9 | 17.4 | 19.8 | 2.50 | 0.338 | 0.726 | 0.598 | 0.833 | 0.644 | ||
| CTSM51_CRUNCEPV7 | [-] | 28.7 | 26.8 | 22.3 | 33.2 | 10.9 | 7.72 | 17.1 | 1.79 | 0.413 | 0.729 | 0.730 | 0.645 | 0.649 | ||
| CTSM51_GSWP3V1 | [-] | 19.0 | 16.9 | 22.3 | 24.8 | 10.9 | -1.34 | 15.4 | 1.41 | 0.408 | 0.772 | 0.799 | 0.721 | 0.694 |
Download Data |
Period Mean (original grids) [Watt/m2] |
Model Period Mean (intersection) [Watt/m2] |
Benchmark Period Mean (intersection) [Watt/m2] |
Model Period Mean (complement) [Watt/m2] |
Benchmark Period Mean (complement) [Watt/m2] |
Bias [Watt/m2] |
RMSE [Watt/m2] |
Phase Shift [months] |
Bias Score [1] |
RMSE Score [1] |
Seasonal Cycle Score [1] |
Spatial Distribution Score [1] |
Overall Score [1] |
|||
|---|---|---|---|---|---|---|---|---|---|---|---|---|---|---|---|---|
| Benchmark | [-] | 27.0 | ||||||||||||||
| CTSM51_CRUJRA | [-] | 12.8 | 12.6 | 27.0 | 13.1 | 14.6 | -14.4 | 19.4 | 0.850 | 0.205 | 0.489 | 0.925 | 0.938 | 0.609 | ||
| CTSM51_CRUJRA_FLDS | [-] | 18.0 | 17.8 | 27.0 | 20.1 | 14.6 | -9.13 | 16.0 | 0.570 | 0.424 | 0.495 | 0.955 | 0.926 | 0.659 | ||
| CTSM51_CRUNCEPV7 | [-] | 13.4 | 13.2 | 27.0 | 17.9 | 14.6 | -13.7 | 19.9 | 1.35 | 0.233 | 0.427 | 0.827 | 0.942 | 0.571 | ||
| CTSM51_GSWP3V1 | [-] | 21.2 | 20.8 | 27.0 | 26.8 | 14.6 | -6.02 | 14.2 | 0.429 | 0.508 | 0.510 | 0.963 | 0.964 | 0.691 |
Download Data |
Period Mean (original grids) [Watt/m2] |
Model Period Mean (intersection) [Watt/m2] |
Benchmark Period Mean (intersection) [Watt/m2] |
Model Period Mean (complement) [Watt/m2] |
Benchmark Period Mean (complement) [Watt/m2] |
Bias [Watt/m2] |
RMSE [Watt/m2] |
Phase Shift [months] |
Bias Score [1] |
RMSE Score [1] |
Seasonal Cycle Score [1] |
Spatial Distribution Score [1] |
Overall Score [1] |
|||
|---|---|---|---|---|---|---|---|---|---|---|---|---|---|---|---|---|
| Benchmark | [-] | 28.4 | ||||||||||||||
| CTSM51_CRUJRA | [-] | 34.4 | 34.1 | 28.4 | 41.7 | 22.7 | 5.52 | 19.0 | 0.755 | 0.455 | 0.425 | 0.924 | 0.928 | 0.631 | ||
| CTSM51_CRUJRA_FLDS | [-] | 33.6 | 33.3 | 28.4 | 40.9 | 22.7 | 4.89 | 17.9 | 0.778 | 0.454 | 0.475 | 0.922 | 0.889 | 0.643 | ||
| CTSM51_CRUNCEPV7 | [-] | 35.9 | 35.6 | 28.4 | 41.7 | 22.7 | 7.07 | 18.7 | 1.02 | 0.461 | 0.439 | 0.871 | 0.918 | 0.626 | ||
| CTSM51_GSWP3V1 | [-] | 34.5 | 34.5 | 28.4 | 39.6 | 22.7 | 6.06 | 17.6 | 0.764 | 0.435 | 0.491 | 0.911 | 0.937 | 0.653 |
Download Data |
Period Mean (original grids) [Watt/m2] |
Model Period Mean (intersection) [Watt/m2] |
Benchmark Period Mean (intersection) [Watt/m2] |
Model Period Mean (complement) [Watt/m2] |
Benchmark Period Mean (complement) [Watt/m2] |
Bias [Watt/m2] |
RMSE [Watt/m2] |
Phase Shift [months] |
Bias Score [1] |
RMSE Score [1] |
Seasonal Cycle Score [1] |
Spatial Distribution Score [1] |
Overall Score [1] |
|||
|---|---|---|---|---|---|---|---|---|---|---|---|---|---|---|---|---|
| Benchmark | [-] | 40.3 | ||||||||||||||
| CTSM51_CRUJRA | [-] | 55.9 | 56.0 | 40.3 | 60.4 | 14.3 | 15.5 | 22.4 | 0.382 | 0.371 | 0.522 | 0.967 | 0.925 | 0.661 | ||
| CTSM51_CRUJRA_FLDS | [-] | 46.9 | 47.3 | 40.3 | 47.4 | 14.3 | 6.31 | 16.8 | 0.455 | 0.545 | 0.576 | 0.960 | 0.960 | 0.723 | ||
| CTSM51_CRUNCEPV7 | [-] | 53.0 | 53.2 | 40.3 | 57.4 | 14.3 | 12.2 | 21.6 | 0.436 | 0.389 | 0.520 | 0.965 | 0.883 | 0.655 | ||
| CTSM51_GSWP3V1 | [-] | 36.6 | 36.3 | 40.3 | 40.3 | 14.3 | -3.89 | 17.9 | 0.439 | 0.395 | 0.621 | 0.959 | 0.938 | 0.707 |
Download Data |
Period Mean (original grids) [Watt/m2] |
Model Period Mean (intersection) [Watt/m2] |
Benchmark Period Mean (intersection) [Watt/m2] |
Model Period Mean (complement) [Watt/m2] |
Benchmark Period Mean (complement) [Watt/m2] |
Bias [Watt/m2] |
RMSE [Watt/m2] |
Phase Shift [months] |
Bias Score [1] |
RMSE Score [1] |
Seasonal Cycle Score [1] |
Spatial Distribution Score [1] |
Overall Score [1] |
|||
|---|---|---|---|---|---|---|---|---|---|---|---|---|---|---|---|---|
| Benchmark | [-] | 15.2 | ||||||||||||||
| CTSM51_CRUJRA | [-] | -9.07 | -7.91 | 15.2 | -18.6 | 2.72 | -23.8 | 29.8 | 1.24 | 0.0134 | 0.283 | 0.886 | 0.261 | 0.345 | ||
| CTSM51_CRUJRA_FLDS | [-] | -0.420 | 0.441 | 15.2 | -5.90 | 2.72 | -15.2 | 23.2 | 0.993 | 0.164 | 0.293 | 0.922 | 0.608 | 0.456 | ||
| CTSM51_CRUNCEPV7 | [-] | -3.96 | -3.15 | 15.2 | -10.4 | 2.72 | -18.8 | 25.6 | 1.13 | 0.0472 | 0.299 | 0.892 | 0.366 | 0.381 | ||
| CTSM51_GSWP3V1 | [-] | 5.18 | 5.99 | 15.2 | 1.56 | 2.72 | -9.54 | 21.7 | 1.10 | 0.408 | 0.239 | 0.883 | 0.893 | 0.532 |
Download Data |
Period Mean (original grids) [Watt/m2] |
Model Period Mean (intersection) [Watt/m2] |
Benchmark Period Mean (intersection) [Watt/m2] |
Model Period Mean (complement) [Watt/m2] |
Benchmark Period Mean (complement) [Watt/m2] |
Bias [Watt/m2] |
RMSE [Watt/m2] |
Phase Shift [months] |
Bias Score [1] |
RMSE Score [1] |
Seasonal Cycle Score [1] |
Spatial Distribution Score [1] |
Overall Score [1] |
|||
|---|---|---|---|---|---|---|---|---|---|---|---|---|---|---|---|---|
| Benchmark | [-] | 56.5 | ||||||||||||||
| CTSM51_CRUJRA | [-] | 70.0 | 70.9 | 56.7 | 57.5 | 14.5 | 13.4 | 17.4 | 0.834 | 0.338 | 0.653 | 0.937 | 0.924 | 0.701 | ||
| CTSM51_CRUJRA_FLDS | [-] | 67.6 | 68.4 | 56.7 | 57.7 | 14.5 | 10.9 | 15.7 | 0.711 | 0.408 | 0.666 | 0.948 | 0.836 | 0.705 | ||
| CTSM51_CRUNCEPV7 | [-] | 66.4 | 67.4 | 56.7 | 53.7 | 14.5 | 10.3 | 15.3 | 0.484 | 0.437 | 0.656 | 0.966 | 0.974 | 0.738 | ||
| CTSM51_GSWP3V1 | [-] | 60.1 | 60.7 | 56.7 | 53.3 | 14.5 | 3.76 | 12.9 | 0.447 | 0.509 | 0.697 | 0.968 | 0.877 | 0.750 |
Download Data |
Period Mean (original grids) [Watt/m2] |
Model Period Mean (intersection) [Watt/m2] |
Benchmark Period Mean (intersection) [Watt/m2] |
Model Period Mean (complement) [Watt/m2] |
Benchmark Period Mean (complement) [Watt/m2] |
Bias [Watt/m2] |
RMSE [Watt/m2] |
Phase Shift [months] |
Bias Score [1] |
RMSE Score [1] |
Seasonal Cycle Score [1] |
Spatial Distribution Score [1] |
Overall Score [1] |
|||
|---|---|---|---|---|---|---|---|---|---|---|---|---|---|---|---|---|
| Benchmark | [-] | 20.2 | ||||||||||||||
| CTSM51_CRUJRA | [-] | 21.5 | 21.4 | 20.2 | 26.1 | 5.93 | 1.82 | 16.7 | 0.757 | 0.489 | 0.435 | 0.927 | 0.732 | 0.604 | ||
| CTSM51_CRUJRA_FLDS | [-] | 25.6 | 25.7 | 20.2 | 27.3 | 5.93 | 5.74 | 13.7 | 0.815 | 0.509 | 0.541 | 0.920 | 0.935 | 0.689 | ||
| CTSM51_CRUNCEPV7 | [-] | 22.8 | 22.5 | 20.2 | 28.8 | 5.93 | 3.28 | 17.3 | 0.672 | 0.447 | 0.421 | 0.928 | 0.715 | 0.587 | ||
| CTSM51_GSWP3V1 | [-] | 19.2 | 18.4 | 20.2 | 29.7 | 5.93 | 0.356 | 15.0 | 0.952 | 0.463 | 0.526 | 0.898 | 0.810 | 0.644 |
Download Data |
Period Mean (original grids) [Watt/m2] |
Model Period Mean (intersection) [Watt/m2] |
Benchmark Period Mean (intersection) [Watt/m2] |
Model Period Mean (complement) [Watt/m2] |
Benchmark Period Mean (complement) [Watt/m2] |
Bias [Watt/m2] |
RMSE [Watt/m2] |
Phase Shift [months] |
Bias Score [1] |
RMSE Score [1] |
Seasonal Cycle Score [1] |
Spatial Distribution Score [1] |
Overall Score [1] |
|||
|---|---|---|---|---|---|---|---|---|---|---|---|---|---|---|---|---|
| Benchmark | [-] | 34.5 | ||||||||||||||
| CTSM51_CRUJRA | [-] | 29.0 | 39.1 | 34.6 | -10.3 | 12.5 | 4.85 | 21.9 | 1.00 | 0.337 | 0.491 | 0.886 | 0.740 | 0.589 | ||
| CTSM51_CRUJRA_FLDS | [-] | 26.7 | 37.1 | 34.6 | -13.9 | 12.5 | 2.78 | 18.6 | 0.988 | 0.419 | 0.533 | 0.886 | 0.888 | 0.652 | ||
| CTSM51_CRUNCEPV7 | [-] | 33.2 | 37.9 | 34.6 | 14.8 | 12.5 | 3.67 | 20.2 | 0.949 | 0.369 | 0.514 | 0.886 | 0.809 | 0.618 | ||
| CTSM51_GSWP3V1 | [-] | 29.8 | 34.7 | 34.6 | 10.5 | 12.5 | 0.548 | 18.4 | 0.810 | 0.425 | 0.539 | 0.908 | 0.913 | 0.665 |
Download Data |
Period Mean (original grids) [Watt/m2] |
Model Period Mean (intersection) [Watt/m2] |
Benchmark Period Mean (intersection) [Watt/m2] |
Model Period Mean (complement) [Watt/m2] |
Benchmark Period Mean (complement) [Watt/m2] |
Bias [Watt/m2] |
RMSE [Watt/m2] |
Phase Shift [months] |
Bias Score [1] |
RMSE Score [1] |
Seasonal Cycle Score [1] |
Spatial Distribution Score [1] |
Overall Score [1] |
|||
|---|---|---|---|---|---|---|---|---|---|---|---|---|---|---|---|---|
| Benchmark | [-] | 22.7 | ||||||||||||||
| CTSM51_CRUJRA | [-] | 62.3 | 61.7 | 22.7 | 62.6 | 1.93 | 40.8 | 46.8 | 1.28 | 0.135 | 0.271 | 0.835 | 0.817 | 0.466 | ||
| CTSM51_CRUJRA_FLDS | [-] | 50.1 | 51.7 | 22.7 | 48.2 | 1.93 | 30.5 | 37.2 | 1.36 | 0.130 | 0.409 | 0.826 | 0.752 | 0.505 | ||
| CTSM51_CRUNCEPV7 | [-] | 56.8 | 58.7 | 22.7 | 54.7 | 1.93 | 37.7 | 43.3 | 1.20 | 0.129 | 0.360 | 0.834 | 0.812 | 0.499 | ||
| CTSM51_GSWP3V1 | [-] | 46.1 | 48.4 | 22.7 | 43.8 | 1.93 | 27.6 | 35.8 | 1.20 | 0.146 | 0.380 | 0.846 | 0.804 | 0.511 |
Download Data |
Period Mean (original grids) [Watt/m2] |
Model Period Mean (intersection) [Watt/m2] |
Benchmark Period Mean (intersection) [Watt/m2] |
Model Period Mean (complement) [Watt/m2] |
Benchmark Period Mean (complement) [Watt/m2] |
Bias [Watt/m2] |
RMSE [Watt/m2] |
Phase Shift [months] |
Bias Score [1] |
RMSE Score [1] |
Seasonal Cycle Score [1] |
Spatial Distribution Score [1] |
Overall Score [1] |
|||
|---|---|---|---|---|---|---|---|---|---|---|---|---|---|---|---|---|
| Benchmark | [-] | 17.0 | ||||||||||||||
| CTSM51_CRUJRA | [-] | -4.83 | -4.16 | 17.0 | -13.5 | 3.52 | -22.1 | 29.5 | 1.22 | 0.0597 | 0.246 | 0.868 | 0.343 | 0.353 | ||
| CTSM51_CRUJRA_FLDS | [-] | 5.06 | 5.70 | 17.0 | -3.12 | 3.52 | -12.0 | 23.0 | 1.05 | 0.314 | 0.244 | 0.895 | 0.739 | 0.487 | ||
| CTSM51_CRUNCEPV7 | [-] | 2.53 | 3.13 | 17.0 | -4.87 | 3.52 | -14.5 | 23.8 | 1.19 | 0.206 | 0.267 | 0.871 | 0.692 | 0.461 | ||
| CTSM51_GSWP3V1 | [-] | 9.82 | 10.4 | 17.0 | 3.25 | 3.52 | -7.19 | 21.1 | 1.13 | 0.481 | 0.245 | 0.884 | 0.915 | 0.554 |
Download Data |
Period Mean (original grids) [Watt/m2] |
Model Period Mean (intersection) [Watt/m2] |
Benchmark Period Mean (intersection) [Watt/m2] |
Model Period Mean (complement) [Watt/m2] |
Benchmark Period Mean (complement) [Watt/m2] |
Bias [Watt/m2] |
RMSE [Watt/m2] |
Phase Shift [months] |
Bias Score [1] |
RMSE Score [1] |
Seasonal Cycle Score [1] |
Spatial Distribution Score [1] |
Overall Score [1] |
|||
|---|---|---|---|---|---|---|---|---|---|---|---|---|---|---|---|---|
| Benchmark | [-] | 47.7 | ||||||||||||||
| CTSM51_CRUJRA | [-] | 60.1 | 58.8 | 47.8 | 65.3 | 13.7 | 12.0 | 23.6 | 0.570 | 0.288 | 0.570 | 0.940 | 0.855 | 0.645 | ||
| CTSM51_CRUJRA_FLDS | [-] | 50.5 | 50.0 | 47.8 | 51.9 | 13.7 | 2.01 | 19.3 | 0.663 | 0.336 | 0.640 | 0.934 | 0.816 | 0.673 | ||
| CTSM51_CRUNCEPV7 | [-] | 53.6 | 52.5 | 47.8 | 58.4 | 13.7 | 5.64 | 21.5 | 0.463 | 0.296 | 0.588 | 0.961 | 0.835 | 0.654 | ||
| CTSM51_GSWP3V1 | [-] | 48.3 | 47.7 | 47.8 | 52.2 | 13.7 | 0.663 | 21.8 | 0.507 | 0.326 | 0.563 | 0.948 | 0.945 | 0.669 |
Download Data |
Period Mean (original grids) [Watt/m2] |
Model Period Mean (intersection) [Watt/m2] |
Benchmark Period Mean (intersection) [Watt/m2] |
Model Period Mean (complement) [Watt/m2] |
Benchmark Period Mean (complement) [Watt/m2] |
Bias [Watt/m2] |
RMSE [Watt/m2] |
Phase Shift [months] |
Bias Score [1] |
RMSE Score [1] |
Seasonal Cycle Score [1] |
Spatial Distribution Score [1] |
Overall Score [1] |
|||
|---|---|---|---|---|---|---|---|---|---|---|---|---|---|---|---|---|
| Benchmark | [-] | 28.6 | ||||||||||||||
| CTSM51_CRUJRA | [-] | 30.3 | 30.1 | 28.6 | 36.5 | 16.4 | 2.28 | 14.9 | 0.700 | 0.466 | 0.490 | 0.930 | 0.833 | 0.642 | ||
| CTSM51_CRUJRA_FLDS | [-] | 32.4 | 32.4 | 28.6 | 35.8 | 16.4 | 4.21 | 11.2 | 0.639 | 0.558 | 0.650 | 0.936 | 0.978 | 0.754 | ||
| CTSM51_CRUNCEPV7 | [-] | 30.4 | 30.2 | 28.6 | 37.6 | 16.4 | 2.39 | 14.0 | 1.82 | 0.516 | 0.515 | 0.712 | 0.887 | 0.629 | ||
| CTSM51_GSWP3V1 | [-] | 26.8 | 26.6 | 28.6 | 32.7 | 16.4 | -1.29 | 13.8 | 0.958 | 0.606 | 0.466 | 0.884 | 0.940 | 0.672 |
Download Data |
Period Mean (original grids) [Watt/m2] |
Model Period Mean (intersection) [Watt/m2] |
Benchmark Period Mean (intersection) [Watt/m2] |
Model Period Mean (complement) [Watt/m2] |
Benchmark Period Mean (complement) [Watt/m2] |
Bias [Watt/m2] |
RMSE [Watt/m2] |
Phase Shift [months] |
Bias Score [1] |
RMSE Score [1] |
Seasonal Cycle Score [1] |
Spatial Distribution Score [1] |
Overall Score [1] |
|||
|---|---|---|---|---|---|---|---|---|---|---|---|---|---|---|---|---|
| Benchmark | [-] | 26.7 | ||||||||||||||
| CTSM51_CRUJRA | [-] | 18.0 | 18.0 | 26.7 | 15.9 | 7.66 | -8.73 | 18.5 | 0.771 | 0.349 | 0.389 | 0.936 | 0.947 | 0.602 | ||
| CTSM51_CRUJRA_FLDS | [-] | 25.2 | 25.2 | 26.7 | 25.3 | 7.66 | -1.33 | 15.4 | 0.599 | 0.546 | 0.439 | 0.953 | 0.951 | 0.666 | ||
| CTSM51_CRUNCEPV7 | [-] | 19.0 | 19.0 | 26.7 | 20.3 | 7.66 | -7.72 | 18.0 | 0.711 | 0.392 | 0.374 | 0.931 | 0.865 | 0.587 | ||
| CTSM51_GSWP3V1 | [-] | 22.9 | 22.9 | 26.7 | 24.4 | 7.66 | -3.60 | 16.4 | 0.484 | 0.534 | 0.380 | 0.961 | 0.827 | 0.616 |
Download Data |
Period Mean (original grids) [Watt/m2] |
Model Period Mean (intersection) [Watt/m2] |
Benchmark Period Mean (intersection) [Watt/m2] |
Model Period Mean (complement) [Watt/m2] |
Benchmark Period Mean (complement) [Watt/m2] |
Bias [Watt/m2] |
RMSE [Watt/m2] |
Phase Shift [months] |
Bias Score [1] |
RMSE Score [1] |
Seasonal Cycle Score [1] |
Spatial Distribution Score [1] |
Overall Score [1] |
|||
|---|---|---|---|---|---|---|---|---|---|---|---|---|---|---|---|---|
| Benchmark | [-] | 49.7 | ||||||||||||||
| CTSM51_CRUJRA | [-] | 40.5 | 40.6 | 49.7 | 53.1 | 16.3 | -9.13 | 15.7 | 0.537 | 0.317 | 0.564 | 0.947 | 0.977 | 0.674 | ||
| CTSM51_CRUJRA_FLDS | [-] | 40.9 | 41.0 | 49.7 | 52.3 | 16.3 | -8.66 | 15.1 | 0.714 | 0.384 | 0.590 | 0.926 | 0.848 | 0.668 | ||
| CTSM51_CRUNCEPV7 | [-] | 39.4 | 39.4 | 49.7 | 52.7 | 16.3 | -10.2 | 16.2 | 0.522 | 0.319 | 0.546 | 0.950 | 0.943 | 0.661 | ||
| CTSM51_GSWP3V1 | [-] | 43.9 | 43.9 | 49.7 | 56.7 | 16.3 | -5.71 | 14.1 | 0.865 | 0.487 | 0.553 | 0.913 | 0.866 | 0.675 |
Download Data |
Period Mean (original grids) [Watt/m2] |
Model Period Mean (intersection) [Watt/m2] |
Benchmark Period Mean (intersection) [Watt/m2] |
Model Period Mean (complement) [Watt/m2] |
Benchmark Period Mean (complement) [Watt/m2] |
Bias [Watt/m2] |
RMSE [Watt/m2] |
Phase Shift [months] |
Bias Score [1] |
RMSE Score [1] |
Seasonal Cycle Score [1] |
Spatial Distribution Score [1] |
Overall Score [1] |
|||
|---|---|---|---|---|---|---|---|---|---|---|---|---|---|---|---|---|
| Benchmark | [-] | 30.2 | ||||||||||||||
| CTSM51_CRUJRA | [-] | 36.4 | 36.3 | 30.2 | 53.0 | 13.7 | 6.88 | 13.5 | 1.95 | 0.563 | 0.703 | 0.713 | 0.723 | 0.681 | ||
| CTSM51_CRUJRA_FLDS | [-] | 28.7 | 28.8 | 30.2 | 40.6 | 13.7 | -0.809 | 11.3 | 1.87 | 0.621 | 0.746 | 0.725 | 0.801 | 0.728 | ||
| CTSM51_CRUNCEPV7 | [-] | 30.3 | 30.1 | 30.2 | 49.1 | 13.7 | 0.741 | 11.6 | 1.39 | 0.623 | 0.764 | 0.806 | 0.614 | 0.714 | ||
| CTSM51_GSWP3V1 | [-] | 19.6 | 19.4 | 30.2 | 41.1 | 13.7 | -9.60 | 16.3 | 1.45 | 0.365 | 0.781 | 0.793 | 0.500 | 0.644 |
Download Data |
Period Mean (original grids) [Watt/m2] |
Model Period Mean (intersection) [Watt/m2] |
Benchmark Period Mean (intersection) [Watt/m2] |
Model Period Mean (complement) [Watt/m2] |
Benchmark Period Mean (complement) [Watt/m2] |
Bias [Watt/m2] |
RMSE [Watt/m2] |
Phase Shift [months] |
Bias Score [1] |
RMSE Score [1] |
Seasonal Cycle Score [1] |
Spatial Distribution Score [1] |
Overall Score [1] |
|||
|---|---|---|---|---|---|---|---|---|---|---|---|---|---|---|---|---|
| Benchmark | [-] | 40.3 | ||||||||||||||
| CTSM51_CRUJRA | [-] | 49.2 | 49.4 | 40.4 | 49.0 | 12.9 | 9.18 | 14.8 | 1.02 | 0.473 | 0.681 | 0.884 | 0.828 | 0.709 | ||
| CTSM51_CRUJRA_FLDS | [-] | 43.6 | 43.7 | 40.4 | 43.1 | 12.9 | 3.40 | 12.6 | 1.01 | 0.546 | 0.695 | 0.882 | 0.887 | 0.741 | ||
| CTSM51_CRUNCEPV7 | [-] | 48.5 | 48.5 | 40.4 | 50.9 | 12.9 | 8.40 | 14.7 | 0.739 | 0.449 | 0.714 | 0.924 | 0.737 | 0.708 | ||
| CTSM51_GSWP3V1 | [-] | 41.5 | 41.7 | 40.4 | 43.6 | 12.9 | 1.54 | 13.2 | 0.812 | 0.552 | 0.684 | 0.912 | 0.784 | 0.723 |
Download Data |
Period Mean (original grids) [Watt/m2] |
Model Period Mean (intersection) [Watt/m2] |
Benchmark Period Mean (intersection) [Watt/m2] |
Model Period Mean (complement) [Watt/m2] |
Benchmark Period Mean (complement) [Watt/m2] |
Bias [Watt/m2] |
RMSE [Watt/m2] |
Phase Shift [months] |
Bias Score [1] |
RMSE Score [1] |
Seasonal Cycle Score [1] |
Spatial Distribution Score [1] |
Overall Score [1] |
|||
|---|---|---|---|---|---|---|---|---|---|---|---|---|---|---|---|---|
| Benchmark | [-] | 41.5 | ||||||||||||||
| CTSM51_CRUJRA | [-] | 62.9 | 61.8 | 41.8 | 69.4 | 6.16 | 20.0 | 29.6 | 0.711 | 0.244 | 0.393 | 0.934 | 0.933 | 0.579 | ||
| CTSM51_CRUJRA_FLDS | [-] | 59.1 | 57.4 | 41.8 | 73.2 | 6.16 | 17.2 | 30.4 | 0.897 | 0.233 | 0.403 | 0.911 | 0.914 | 0.573 | ||
| CTSM51_CRUNCEPV7 | [-] | 57.9 | 57.2 | 41.8 | 65.7 | 6.16 | 15.2 | 26.5 | 0.707 | 0.276 | 0.450 | 0.933 | 0.934 | 0.609 | ||
| CTSM51_GSWP3V1 | [-] | 63.3 | 61.9 | 41.8 | 73.4 | 6.16 | 19.9 | 33.5 | 0.633 | 0.216 | 0.398 | 0.943 | 0.837 | 0.558 |
Temporally integrated period mean