Mean State
Download Data |
Period Mean (original grids) [Pg] |
Model Period Mean (intersection) [Pg] |
Benchmark Period Mean (intersection) [Pg] |
Model Period Mean (complement) [Pg] |
Benchmark Period Mean (complement) [Pg] |
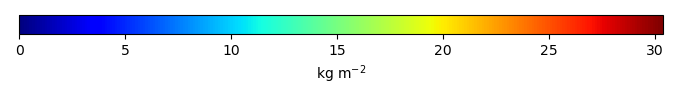
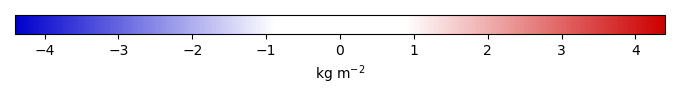
Bias [kg m-2] |
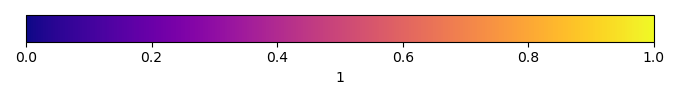
Bias Score [1] |
Spatial Distribution Score [1] |
Overall Score [1] |
|||
|---|---|---|---|---|---|---|---|---|---|---|---|---|
| Benchmark | [-] | 32.8 | ||||||||||
| I62_CRUJRA | [-] | 71.9 | 73.1 | 32.8 | 0.365 | 0.0526 | 10.3 | 0.325 | 0.542 | 0.433 | ||
| I63_CRUJRA | [-] | 71.9 | 73.0 | 32.8 | 0.365 | 0.0526 | 10.3 | 0.325 | 0.542 | 0.434 | ||
| I65_CRUJRA | [-] | 55.7 | 56.6 | 32.8 | 0.312 | 0.0526 | 6.16 | 0.425 | 0.716 | 0.570 | ||
| I67_GSWP3 | [-] | 45.5 | 45.7 | 32.8 | 0.408 | 2.31e-06 | 3.56 | 0.516 | 0.843 | 0.680 |
Download Data |
Period Mean (original grids) [Pg] |
Model Period Mean (intersection) [Pg] |
Benchmark Period Mean (intersection) [Pg] |
Model Period Mean (complement) [Pg] |
Benchmark Period Mean (complement) [Pg] |
Bias [kg m-2] |
Bias Score [1] |
Spatial Distribution Score [1] |
Overall Score [1] |
|||
|---|---|---|---|---|---|---|---|---|---|---|---|---|
| Benchmark | [-] | 8.35 | ||||||||||
| I62_CRUJRA | [-] | 9.47 | 8.21 | 8.34 | 0.192 | 0.0114 | 0.0187 | 0.440 | 0.654 | 0.547 | ||
| I63_CRUJRA | [-] | 9.47 | 8.21 | 8.34 | 0.192 | 0.0114 | 0.0187 | 0.440 | 0.654 | 0.547 | ||
| I65_CRUJRA | [-] | 6.85 | 5.92 | 8.34 | 0.181 | 0.0114 | -0.403 | 0.451 | 0.830 | 0.641 | ||
| I67_GSWP3 | [-] | 4.43 | 3.72 | 8.35 | 0.159 | 0.00323 | -0.793 | 0.429 | 0.781 | 0.605 |
Download Data |
Period Mean (original grids) [Pg] |
Model Period Mean (intersection) [Pg] |
Benchmark Period Mean (intersection) [Pg] |
Model Period Mean (complement) [Pg] |
Benchmark Period Mean (complement) [Pg] |
Bias [kg m-2] |
Bias Score [1] |
Spatial Distribution Score [1] |
Overall Score [1] |
|||
|---|---|---|---|---|---|---|---|---|---|---|---|---|
| Benchmark | [-] | 10.6 | ||||||||||
| I62_CRUJRA | [-] | 30.8 | 29.5 | 10.6 | 0.592 | 0.0246 | 2.36 | 0.307 | 0.193 | 0.250 | ||
| I63_CRUJRA | [-] | 30.8 | 29.5 | 10.6 | 0.592 | 0.0246 | 2.36 | 0.306 | 0.193 | 0.250 | ||
| I65_CRUJRA | [-] | 24.5 | 23.4 | 10.6 | 0.531 | 0.0246 | 1.63 | 0.358 | 0.270 | 0.314 | ||
| I67_GSWP3 | [-] | 11.7 | 11.1 | 10.6 | 0.417 | 0.00201 | 0.228 | 0.417 | 0.639 | 0.528 |
Download Data |
Period Mean (original grids) [Pg] |
Model Period Mean (intersection) [Pg] |
Benchmark Period Mean (intersection) [Pg] |
Model Period Mean (complement) [Pg] |
Benchmark Period Mean (complement) [Pg] |
Bias [kg m-2] |
Bias Score [1] |
Spatial Distribution Score [1] |
Overall Score [1] |
|||
|---|---|---|---|---|---|---|---|---|---|---|---|---|
| Benchmark | [-] | 4.69 | ||||||||||
| I62_CRUJRA | [-] | 10.2 | 10.1 | 4.67 | 0.135 | 0.0241 | 1.93 | 0.258 | 0.833 | 0.546 | ||
| I63_CRUJRA | [-] | 9.06 | 9.02 | 4.67 | 0.126 | 0.0241 | 1.58 | 0.296 | 0.810 | 0.553 | ||
| I65_CRUJRA | [-] | 8.20 | 8.18 | 4.67 | 0.107 | 0.0241 | 1.29 | 0.332 | 0.854 | 0.593 | ||
| I67_GSWP3 | [-] | 8.80 | 8.65 | 4.69 | 0.230 | 1.57 | 0.312 | 0.894 | 0.603 |
Download Data |
Period Mean (original grids) [Pg] |
Model Period Mean (intersection) [Pg] |
Benchmark Period Mean (intersection) [Pg] |
Model Period Mean (complement) [Pg] |
Benchmark Period Mean (complement) [Pg] |
Bias [kg m-2] |
Bias Score [1] |
Spatial Distribution Score [1] |
Overall Score [1] |
|||
|---|---|---|---|---|---|---|---|---|---|---|---|---|
| Benchmark | [-] | 27.8 | ||||||||||
| I62_CRUJRA | [-] | 70.7 | 67.7 | 26.8 | 2.61 | 0.921 | 19.4 | 0.162 | 0.648 | 0.405 | ||
| I63_CRUJRA | [-] | 70.7 | 67.7 | 26.8 | 2.61 | 0.921 | 19.4 | 0.162 | 0.648 | 0.405 | ||
| I65_CRUJRA | [-] | 54.9 | 52.6 | 26.8 | 2.04 | 0.921 | 13.3 | 0.254 | 0.815 | 0.534 | ||
| I67_GSWP3 | [-] | 49.9 | 46.8 | 27.7 | 2.76 | 0.0497 | 11.7 | 0.264 | 0.859 | 0.562 |
Download Data |
Period Mean (original grids) [Pg] |
Model Period Mean (intersection) [Pg] |
Benchmark Period Mean (intersection) [Pg] |
Model Period Mean (complement) [Pg] |
Benchmark Period Mean (complement) [Pg] |
Bias [kg m-2] |
Bias Score [1] |
Spatial Distribution Score [1] |
Overall Score [1] |
|||
|---|---|---|---|---|---|---|---|---|---|---|---|---|
| Benchmark | [-] | 43.5 | ||||||||||
| I62_CRUJRA | [-] | 97.2 | 95.2 | 43.5 | 0.373 | 0.0288 | 5.92 | 0.321 | 0.802 | 0.561 | ||
| I63_CRUJRA | [-] | 95.4 | 93.5 | 43.5 | 0.369 | 0.0288 | 5.73 | 0.330 | 0.813 | 0.571 | ||
| I65_CRUJRA | [-] | 70.9 | 69.5 | 43.5 | 0.217 | 0.0288 | 3.01 | 0.461 | 0.793 | 0.627 | ||
| I67_GSWP3 | [-] | 72.8 | 71.2 | 43.5 | 0.374 | 3.68e-05 | 3.38 | 0.454 | 0.846 | 0.650 |
Download Data |
Period Mean (original grids) [Pg] |
Model Period Mean (intersection) [Pg] |
Benchmark Period Mean (intersection) [Pg] |
Model Period Mean (complement) [Pg] |
Benchmark Period Mean (complement) [Pg] |
Bias [kg m-2] |
Bias Score [1] |
Spatial Distribution Score [1] |
Overall Score [1] |
|||
|---|---|---|---|---|---|---|---|---|---|---|---|---|
| Benchmark | [-] | 32.0 | ||||||||||
| I62_CRUJRA | [-] | 45.0 | 45.2 | 31.9 | 1.00 | 0.0700 | 1.15 | 0.337 | 0.696 | 0.517 | ||
| I63_CRUJRA | [-] | 45.1 | 45.2 | 31.9 | 1.00 | 0.0700 | 1.15 | 0.335 | 0.697 | 0.516 | ||
| I65_CRUJRA | [-] | 40.5 | 40.5 | 31.9 | 0.948 | 0.0700 | 0.840 | 0.350 | 0.748 | 0.549 | ||
| I67_GSWP3 | [-] | 42.0 | 42.1 | 32.0 | 0.856 | 0.00351 | 0.963 | 0.342 | 0.821 | 0.581 |
Download Data |
Period Mean (original grids) [Pg] |
Model Period Mean (intersection) [Pg] |
Benchmark Period Mean (intersection) [Pg] |
Model Period Mean (complement) [Pg] |
Benchmark Period Mean (complement) [Pg] |
Bias [kg m-2] |
Bias Score [1] |
Spatial Distribution Score [1] |
Overall Score [1] |
|||
|---|---|---|---|---|---|---|---|---|---|---|---|---|
| Benchmark | [-] | 21.1 | ||||||||||
| I62_CRUJRA | [-] | 42.2 | 40.1 | 20.9 | 0.981 | 0.146 | 4.22 | 0.300 | 0.561 | 0.430 | ||
| I63_CRUJRA | [-] | 42.2 | 40.1 | 20.9 | 0.981 | 0.146 | 4.22 | 0.300 | 0.561 | 0.430 | ||
| I65_CRUJRA | [-] | 34.9 | 33.3 | 20.9 | 0.770 | 0.146 | 2.93 | 0.354 | 0.693 | 0.523 | ||
| I67_GSWP3 | [-] | 27.6 | 26.1 | 21.1 | 0.794 | 0.00771 | 1.83 | 0.387 | 0.828 | 0.608 |
Download Data |
Period Mean (original grids) [Pg] |
Model Period Mean (intersection) [Pg] |
Benchmark Period Mean (intersection) [Pg] |
Model Period Mean (complement) [Pg] |
Benchmark Period Mean (complement) [Pg] |
Bias [kg m-2] |
Bias Score [1] |
Spatial Distribution Score [1] |
Overall Score [1] |
|||
|---|---|---|---|---|---|---|---|---|---|---|---|---|
| Benchmark | [-] | 3.81 | ||||||||||
| I62_CRUJRA | [-] | 12.1 | 12.5 | 3.81 | 0.112 | 0.000319 | 2.61 | 0.143 | 0.615 | 0.379 | ||
| I63_CRUJRA | [-] | 11.0 | 11.4 | 3.81 | 0.100 | 0.000319 | 2.28 | 0.175 | 0.638 | 0.406 | ||
| I65_CRUJRA | [-] | 9.22 | 9.49 | 3.81 | 0.0770 | 0.000319 | 1.70 | 0.232 | 0.751 | 0.492 | ||
| I67_GSWP3 | [-] | 11.5 | 11.8 | 3.81 | 0.156 | 1.59e-06 | 2.47 | 0.158 | 0.772 | 0.465 |
Download Data |
Period Mean (original grids) [Pg] |
Model Period Mean (intersection) [Pg] |
Benchmark Period Mean (intersection) [Pg] |
Model Period Mean (complement) [Pg] |
Benchmark Period Mean (complement) [Pg] |
Bias [kg m-2] |
Bias Score [1] |
Spatial Distribution Score [1] |
Overall Score [1] |
|||
|---|---|---|---|---|---|---|---|---|---|---|---|---|
| Benchmark | [-] | 9.16 | ||||||||||
| I62_CRUJRA | [-] | 14.4 | 13.3 | 8.87 | 0.854 | 0.289 | 1.16 | 0.126 | 0.762 | 0.444 | ||
| I63_CRUJRA | [-] | 14.4 | 13.3 | 8.87 | 0.854 | 0.289 | 1.16 | 0.126 | 0.762 | 0.444 | ||
| I65_CRUJRA | [-] | 13.4 | 12.4 | 8.87 | 0.795 | 0.289 | 1.03 | 0.135 | 0.786 | 0.461 | ||
| I67_GSWP3 | [-] | 11.6 | 10.4 | 9.14 | 1.01 | 0.0267 | 0.875 | 0.161 | 0.810 | 0.486 |
Download Data |
Period Mean (original grids) [Pg] |
Model Period Mean (intersection) [Pg] |
Benchmark Period Mean (intersection) [Pg] |
Model Period Mean (complement) [Pg] |
Benchmark Period Mean (complement) [Pg] |
Bias [kg m-2] |
Bias Score [1] |
Spatial Distribution Score [1] |
Overall Score [1] |
|||
|---|---|---|---|---|---|---|---|---|---|---|---|---|
| Benchmark | [-] | 12.0 | ||||||||||
| I62_CRUJRA | [-] | 22.9 | 22.1 | 12.0 | 0.557 | 0.0529 | 2.62 | 0.392 | 0.440 | 0.416 | ||
| I63_CRUJRA | [-] | 22.8 | 22.0 | 12.0 | 0.549 | 0.0529 | 2.60 | 0.393 | 0.441 | 0.417 | ||
| I65_CRUJRA | [-] | 17.3 | 16.6 | 12.0 | 0.431 | 0.0529 | 1.47 | 0.459 | 0.652 | 0.556 | ||
| I67_GSWP3 | [-] | 17.5 | 16.5 | 12.0 | 0.629 | 0.00608 | 1.60 | 0.431 | 0.488 | 0.459 |
Download Data |
Period Mean (original grids) [Pg] |
Model Period Mean (intersection) [Pg] |
Benchmark Period Mean (intersection) [Pg] |
Model Period Mean (complement) [Pg] |
Benchmark Period Mean (complement) [Pg] |
Bias [kg m-2] |
Bias Score [1] |
Spatial Distribution Score [1] |
Overall Score [1] |
|||
|---|---|---|---|---|---|---|---|---|---|---|---|---|
| Benchmark | [-] | 364. | ||||||||||
| I62_CRUJRA | [-] | 852. | 838. | 362. | 11.2 | 2.19 | 4.63 | 0.268 | 0.482 | 0.375 | ||
| I63_CRUJRA | [-] | 845. | 832. | 362. | 11.1 | 2.19 | 4.58 | 0.272 | 0.482 | 0.377 | ||
| I65_CRUJRA | [-] | 681. | 669. | 362. | 9.31 | 2.19 | 3.11 | 0.322 | 0.621 | 0.471 | ||
| I67_GSWP3 | [-] | 605. | 592. | 364. | 11.5 | 0.125 | 2.51 | 0.333 | 0.723 | 0.528 |
Download Data |
Period Mean (original grids) [Pg] |
Model Period Mean (intersection) [Pg] |
Benchmark Period Mean (intersection) [Pg] |
Model Period Mean (complement) [Pg] |
Benchmark Period Mean (complement) [Pg] |
Bias [kg m-2] |
Bias Score [1] |
Spatial Distribution Score [1] |
Overall Score [1] |
|||
|---|---|---|---|---|---|---|---|---|---|---|---|---|
| Benchmark | [-] | 1.24 | ||||||||||
| I62_CRUJRA | [-] | 3.30 | 2.72 | 1.23 | 0.584 | 0.00652 | 0.421 | 0.151 | 0.686 | 0.419 | ||
| I63_CRUJRA | [-] | 3.28 | 2.70 | 1.23 | 0.590 | 0.00652 | 0.418 | 0.150 | 0.684 | 0.417 | ||
| I65_CRUJRA | [-] | 3.32 | 2.75 | 1.23 | 0.586 | 0.00652 | 0.434 | 0.149 | 0.682 | 0.415 | ||
| I67_GSWP3 | [-] | 2.26 | 1.86 | 1.24 | 0.422 | 0.000602 | 0.254 | 0.188 | 0.712 | 0.450 |
Download Data |
Period Mean (original grids) [Pg] |
Model Period Mean (intersection) [Pg] |
Benchmark Period Mean (intersection) [Pg] |
Model Period Mean (complement) [Pg] |
Benchmark Period Mean (complement) [Pg] |
Bias [kg m-2] |
Bias Score [1] |
Spatial Distribution Score [1] |
Overall Score [1] |
|||
|---|---|---|---|---|---|---|---|---|---|---|---|---|
| Benchmark | [-] | 5.62 | ||||||||||
| I62_CRUJRA | [-] | 20.0 | 19.4 | 5.59 | 0.313 | 0.0265 | 2.62 | 0.155 | 0.321 | 0.238 | ||
| I63_CRUJRA | [-] | 18.8 | 18.3 | 5.59 | 0.270 | 0.0265 | 2.43 | 0.182 | 0.322 | 0.252 | ||
| I65_CRUJRA | [-] | 12.3 | 11.8 | 5.59 | 0.189 | 0.0265 | 1.26 | 0.268 | 0.595 | 0.431 | ||
| I67_GSWP3 | [-] | 18.3 | 17.7 | 5.62 | 0.381 | 1.31e-05 | 2.34 | 0.148 | 0.414 | 0.281 |
Download Data |
Period Mean (original grids) [Pg] |
Model Period Mean (intersection) [Pg] |
Benchmark Period Mean (intersection) [Pg] |
Model Period Mean (complement) [Pg] |
Benchmark Period Mean (complement) [Pg] |
Bias [kg m-2] |
Bias Score [1] |
Spatial Distribution Score [1] |
Overall Score [1] |
|||
|---|---|---|---|---|---|---|---|---|---|---|---|---|
| Benchmark | [-] | 8.21 | ||||||||||
| I62_CRUJRA | [-] | 17.1 | 16.0 | 8.09 | 0.668 | 0.122 | 4.41 | 0.323 | 0.316 | 0.320 | ||
| I63_CRUJRA | [-] | 17.1 | 16.0 | 8.09 | 0.668 | 0.122 | 4.41 | 0.323 | 0.316 | 0.320 | ||
| I65_CRUJRA | [-] | 14.1 | 13.1 | 8.09 | 0.555 | 0.122 | 3.18 | 0.363 | 0.464 | 0.414 | ||
| I67_GSWP3 | [-] | 11.6 | 10.5 | 8.19 | 0.716 | 0.0230 | 2.36 | 0.397 | 0.538 | 0.467 |
Download Data |
Period Mean (original grids) [Pg] |
Model Period Mean (intersection) [Pg] |
Benchmark Period Mean (intersection) [Pg] |
Model Period Mean (complement) [Pg] |
Benchmark Period Mean (complement) [Pg] |
Bias [kg m-2] |
Bias Score [1] |
Spatial Distribution Score [1] |
Overall Score [1] |
|||
|---|---|---|---|---|---|---|---|---|---|---|---|---|
| Benchmark | [-] | 14.8 | ||||||||||
| I62_CRUJRA | [-] | 23.8 | 23.4 | 14.8 | 0.277 | 0.0147 | 2.58 | 0.515 | 0.636 | 0.576 | ||
| I63_CRUJRA | [-] | 23.8 | 23.3 | 14.8 | 0.276 | 0.0147 | 2.56 | 0.516 | 0.637 | 0.577 | ||
| I65_CRUJRA | [-] | 22.1 | 21.8 | 14.8 | 0.250 | 0.0147 | 2.13 | 0.539 | 0.706 | 0.622 | ||
| I67_GSWP3 | [-] | 15.4 | 15.0 | 14.8 | 0.281 | 2.51e-05 | 0.415 | 0.567 | 0.830 | 0.698 |
Download Data |
Period Mean (original grids) [Pg] |
Model Period Mean (intersection) [Pg] |
Benchmark Period Mean (intersection) [Pg] |
Model Period Mean (complement) [Pg] |
Benchmark Period Mean (complement) [Pg] |
Bias [kg m-2] |
Bias Score [1] |
Spatial Distribution Score [1] |
Overall Score [1] |
|||
|---|---|---|---|---|---|---|---|---|---|---|---|---|
| Benchmark | [-] | 20.1 | ||||||||||
| I62_CRUJRA | [-] | 61.0 | 60.9 | 19.8 | 0.359 | 0.219 | 8.26 | 0.180 | 0.631 | 0.405 | ||
| I63_CRUJRA | [-] | 59.8 | 59.7 | 19.8 | 0.357 | 0.219 | 8.04 | 0.183 | 0.649 | 0.416 | ||
| I65_CRUJRA | [-] | 43.0 | 42.9 | 19.8 | 0.287 | 0.219 | 4.78 | 0.271 | 0.791 | 0.531 | ||
| I67_GSWP3 | [-] | 51.5 | 51.2 | 20.1 | 0.476 | 6.42 | 0.230 | 0.741 | 0.485 |
Download Data |
Period Mean (original grids) [Pg] |
Model Period Mean (intersection) [Pg] |
Benchmark Period Mean (intersection) [Pg] |
Model Period Mean (complement) [Pg] |
Benchmark Period Mean (complement) [Pg] |
Bias [kg m-2] |
Bias Score [1] |
Spatial Distribution Score [1] |
Overall Score [1] |
|||
|---|---|---|---|---|---|---|---|---|---|---|---|---|
| Benchmark | [-] | 8.04 | ||||||||||
| I62_CRUJRA | [-] | 9.45 | 9.43 | 7.99 | 0.0706 | 0.0515 | 0.562 | 0.323 | 0.905 | 0.614 | ||
| I63_CRUJRA | [-] | 9.46 | 9.45 | 7.99 | 0.0704 | 0.0515 | 0.566 | 0.323 | 0.904 | 0.614 | ||
| I65_CRUJRA | [-] | 6.08 | 6.07 | 7.99 | 0.0545 | 0.0515 | -0.313 | 0.350 | 0.792 | 0.571 | ||
| I67_GSWP3 | [-] | 9.16 | 9.12 | 8.04 | 0.147 | 1.99e-06 | 0.523 | 0.323 | 0.871 | 0.597 |
Download Data |
Period Mean (original grids) [Pg] |
Model Period Mean (intersection) [Pg] |
Benchmark Period Mean (intersection) [Pg] |
Model Period Mean (complement) [Pg] |
Benchmark Period Mean (complement) [Pg] |
Bias [kg m-2] |
Bias Score [1] |
Spatial Distribution Score [1] |
Overall Score [1] |
|||
|---|---|---|---|---|---|---|---|---|---|---|---|---|
| Benchmark | [-] | 88.9 | ||||||||||
| I62_CRUJRA | [-] | 238. | 237. | 88.8 | 0.566 | 0.0655 | 18.2 | 0.206 | 0.594 | 0.400 | ||
| I63_CRUJRA | [-] | 238. | 237. | 88.8 | 0.566 | 0.0655 | 18.2 | 0.206 | 0.594 | 0.400 | ||
| I65_CRUJRA | [-] | 197. | 196. | 88.8 | 0.447 | 0.0655 | 13.2 | 0.297 | 0.719 | 0.508 | ||
| I67_GSWP3 | [-] | 157. | 156. | 88.9 | 0.703 | 0.00100 | 8.29 | 0.430 | 0.853 | 0.642 |
Download Data |
Period Mean (original grids) [Pg] |
Model Period Mean (intersection) [Pg] |
Benchmark Period Mean (intersection) [Pg] |
Model Period Mean (complement) [Pg] |
Benchmark Period Mean (complement) [Pg] |
Bias [kg m-2] |
Bias Score [1] |
Spatial Distribution Score [1] |
Overall Score [1] |
|||
|---|---|---|---|---|---|---|---|---|---|---|---|---|
| Benchmark | [-] | 9.09 | ||||||||||
| I62_CRUJRA | [-] | 42.8 | 43.0 | 9.08 | 0.393 | 0.0128 | 5.37 | 0.150 | 0.193 | 0.172 | ||
| I63_CRUJRA | [-] | 42.8 | 43.1 | 9.08 | 0.393 | 0.0128 | 5.38 | 0.149 | 0.194 | 0.171 | ||
| I65_CRUJRA | [-] | 37.8 | 38.0 | 9.08 | 0.342 | 0.0128 | 4.59 | 0.179 | 0.217 | 0.198 | ||
| I67_GSWP3 | [-] | 26.9 | 27.0 | 9.09 | 0.341 | 0.000333 | 2.87 | 0.228 | 0.288 | 0.258 |
Download Data |
Period Mean (original grids) [Pg] |
Model Period Mean (intersection) [Pg] |
Benchmark Period Mean (intersection) [Pg] |
Model Period Mean (complement) [Pg] |
Benchmark Period Mean (complement) [Pg] |
Bias [kg m-2] |
Bias Score [1] |
Spatial Distribution Score [1] |
Overall Score [1] |
|||
|---|---|---|---|---|---|---|---|---|---|---|---|---|
| Benchmark | [-] | 2.45 | ||||||||||
| I62_CRUJRA | [-] | 8.65 | 8.51 | 2.40 | 0.169 | 0.0496 | 3.02 | 0.114 | 0.166 | 0.140 | ||
| I63_CRUJRA | [-] | 8.65 | 8.51 | 2.40 | 0.169 | 0.0496 | 3.02 | 0.113 | 0.166 | 0.140 | ||
| I65_CRUJRA | [-] | 8.35 | 8.19 | 2.40 | 0.170 | 0.0496 | 2.88 | 0.114 | 0.184 | 0.149 | ||
| I67_GSWP3 | [-] | 9.43 | 9.38 | 2.45 | 0.166 | 0.000743 | 2.88 | 0.115 | 0.239 | 0.177 |
Temporally integrated period mean