Mean State
Download Data |
Period Mean (original grids) [Pg] |
Model Period Mean (intersection) [Pg] |
Benchmark Period Mean (intersection) [Pg] |
Model Period Mean (complement) [Pg] |
Benchmark Period Mean (complement) [Pg] |
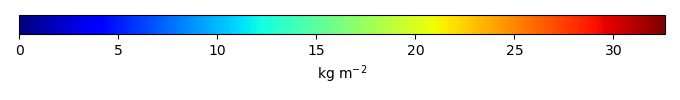
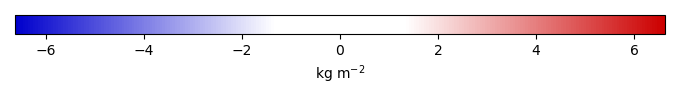
Bias [kg m-2] |
Bias Score [1] |
Spatial Distribution Score [1] |
Overall Score [1] |
|||
|---|---|---|---|---|---|---|---|---|---|---|---|---|
| Benchmark | [-] | 4.43 | ||||||||||
| I62_CRUJRA | [-] | 10.2 | 9.90 | 4.36 | 0.413 | 0.0705 | 2.18 | 0.269 | 0.587 | 0.428 | ||
| I63_CRUJRA | [-] | 9.09 | 8.82 | 4.36 | 0.353 | 0.0705 | 1.80 | 0.307 | 0.524 | 0.415 | ||
| I65_CRUJRA | [-] | 8.24 | 8.03 | 4.36 | 0.290 | 0.0705 | 1.49 | 0.361 | 0.590 | 0.476 | ||
| I67_GSWP3 | [-] | 8.85 | 8.37 | 4.43 | 0.561 | 1.71 | 0.344 | 0.747 | 0.545 |
Download Data |
Period Mean (original grids) [Pg] |
Model Period Mean (intersection) [Pg] |
Benchmark Period Mean (intersection) [Pg] |
Model Period Mean (complement) [Pg] |
Benchmark Period Mean (complement) [Pg] |
Bias [kg m-2] |
Bias Score [1] |
Spatial Distribution Score [1] |
Overall Score [1] |
|||
|---|---|---|---|---|---|---|---|---|---|---|---|---|
| Benchmark | [-] | 40.1 | ||||||||||
| I62_CRUJRA | [-] | 97.0 | 95.0 | 39.9 | 0.427 | 0.184 | 6.31 | 0.289 | 0.426 | 0.357 | ||
| I63_CRUJRA | [-] | 95.2 | 93.2 | 39.9 | 0.422 | 0.184 | 6.12 | 0.297 | 0.437 | 0.367 | ||
| I65_CRUJRA | [-] | 70.7 | 69.2 | 39.9 | 0.246 | 0.184 | 3.40 | 0.479 | 0.425 | 0.452 | ||
| I67_GSWP3 | [-] | 72.6 | 71.1 | 40.1 | 0.414 | 0.00333 | 3.75 | 0.409 | 0.482 | 0.446 |
Download Data |
Period Mean (original grids) [Pg] |
Model Period Mean (intersection) [Pg] |
Benchmark Period Mean (intersection) [Pg] |
Model Period Mean (complement) [Pg] |
Benchmark Period Mean (complement) [Pg] |
Bias [kg m-2] |
Bias Score [1] |
Spatial Distribution Score [1] |
Overall Score [1] |
|||
|---|---|---|---|---|---|---|---|---|---|---|---|---|
| Benchmark | [-] | 28.0 | ||||||||||
| I62_CRUJRA | [-] | 45.1 | 23.0 | 27.7 | 23.2 | 0.322 | -0.0571 | 0.494 | 0.448 | 0.471 | ||
| I63_CRUJRA | [-] | 45.1 | 23.0 | 27.7 | 23.3 | 0.322 | -0.0637 | 0.495 | 0.449 | 0.472 | ||
| I65_CRUJRA | [-] | 40.6 | 20.6 | 27.7 | 20.9 | 0.322 | -0.436 | 0.499 | 0.515 | 0.507 | ||
| I67_GSWP3 | [-] | 41.9 | 18.3 | 28.0 | 24.6 | 0.00891 | -0.750 | 0.507 | 0.596 | 0.551 |
Download Data |
Period Mean (original grids) [Pg] |
Model Period Mean (intersection) [Pg] |
Benchmark Period Mean (intersection) [Pg] |
Model Period Mean (complement) [Pg] |
Benchmark Period Mean (complement) [Pg] |
Bias [kg m-2] |
Bias Score [1] |
Spatial Distribution Score [1] |
Overall Score [1] |
|||
|---|---|---|---|---|---|---|---|---|---|---|---|---|
| Benchmark | [-] | 0.341 | ||||||||||
| I62_CRUJRA | [-] | 42.1 | 0.0832 | 0.341 | 40.9 | -1.80 | 0.482 | 0.742 | 0.612 | |||
| I63_CRUJRA | [-] | 42.1 | 0.0836 | 0.341 | 40.9 | -1.80 | 0.482 | 0.747 | 0.615 | |||
| I65_CRUJRA | [-] | 34.8 | 0.0711 | 0.341 | 33.8 | -1.88 | 0.465 | 0.606 | 0.535 | |||
| I67_GSWP3 | [-] | 27.6 | 0.169 | 0.341 | 26.7 | -1.27 | 0.528 | 0.681 | 0.604 |
Download Data |
Period Mean (original grids) [Pg] |
Model Period Mean (intersection) [Pg] |
Benchmark Period Mean (intersection) [Pg] |
Model Period Mean (complement) [Pg] |
Benchmark Period Mean (complement) [Pg] |
Bias [kg m-2] |
Bias Score [1] |
Spatial Distribution Score [1] |
Overall Score [1] |
|||
|---|---|---|---|---|---|---|---|---|---|---|---|---|
| Benchmark | [-] | 3.80 | ||||||||||
| I62_CRUJRA | [-] | 12.1 | 11.3 | 3.79 | 1.36 | 0.00634 | 3.03 | 0.197 | 0.410 | 0.303 | ||
| I63_CRUJRA | [-] | 11.0 | 10.3 | 3.79 | 1.18 | 0.00634 | 2.66 | 0.239 | 0.418 | 0.329 | ||
| I65_CRUJRA | [-] | 9.21 | 8.65 | 3.79 | 0.903 | 0.00634 | 1.97 | 0.324 | 0.542 | 0.433 | ||
| I67_GSWP3 | [-] | 11.4 | 10.2 | 3.80 | 1.69 | 0.000494 | 2.69 | 0.204 | 0.597 | 0.401 |
Download Data |
Period Mean (original grids) [Pg] |
Model Period Mean (intersection) [Pg] |
Benchmark Period Mean (intersection) [Pg] |
Model Period Mean (complement) [Pg] |
Benchmark Period Mean (complement) [Pg] |
Bias [kg m-2] |
Bias Score [1] |
Spatial Distribution Score [1] |
Overall Score [1] |
|||
|---|---|---|---|---|---|---|---|---|---|---|---|---|
| Benchmark | [-] | 29.4 | ||||||||||
| I62_CRUJRA | [-] | 22.9 | 21.9 | 28.9 | 0.620 | 0.540 | -0.450 | 0.537 | 0.620 | 0.578 | ||
| I63_CRUJRA | [-] | 22.8 | 21.8 | 28.9 | 0.617 | 0.540 | -0.466 | 0.539 | 0.622 | 0.580 | ||
| I65_CRUJRA | [-] | 17.2 | 16.5 | 28.9 | 0.499 | 0.540 | -1.60 | 0.599 | 0.818 | 0.708 | ||
| I67_GSWP3 | [-] | 17.5 | 16.3 | 29.4 | 0.731 | 0.0360 | -1.51 | 0.510 | 0.648 | 0.579 |
Download Data |
Period Mean (original grids) [Pg] |
Model Period Mean (intersection) [Pg] |
Benchmark Period Mean (intersection) [Pg] |
Model Period Mean (complement) [Pg] |
Benchmark Period Mean (complement) [Pg] |
Bias [kg m-2] |
Bias Score [1] |
Spatial Distribution Score [1] |
Overall Score [1] |
|||
|---|---|---|---|---|---|---|---|---|---|---|---|---|
| Benchmark | [-] | 174. | ||||||||||
| I62_CRUJRA | [-] | 852. | 274. | 172. | 575. | 2.04 | 2.55 | 0.391 | 0.458 | 0.424 | ||
| I63_CRUJRA | [-] | 845. | 268. | 172. | 575. | 2.04 | 2.41 | 0.399 | 0.464 | 0.432 | ||
| I65_CRUJRA | [-] | 680. | 206. | 172. | 472. | 2.04 | 1.03 | 0.473 | 0.612 | 0.542 | ||
| I67_GSWP3 | [-] | 605. | 217. | 174. | 386. | 0.0606 | 1.33 | 0.434 | 0.591 | 0.512 |
Download Data |
Period Mean (original grids) [Pg] |
Model Period Mean (intersection) [Pg] |
Benchmark Period Mean (intersection) [Pg] |
Model Period Mean (complement) [Pg] |
Benchmark Period Mean (complement) [Pg] |
Bias [kg m-2] |
Bias Score [1] |
Spatial Distribution Score [1] |
Overall Score [1] |
|||
|---|---|---|---|---|---|---|---|---|---|---|---|---|
| Benchmark | [-] | 4.88 | ||||||||||
| I62_CRUJRA | [-] | 3.29 | 1.65 | 4.82 | 1.64 | 0.0615 | -1.98 | 0.558 | 0.858 | 0.708 | ||
| I63_CRUJRA | [-] | 3.27 | 1.64 | 4.82 | 1.64 | 0.0615 | -1.98 | 0.557 | 0.859 | 0.708 | ||
| I65_CRUJRA | [-] | 3.31 | 1.65 | 4.82 | 1.67 | 0.0615 | -1.96 | 0.562 | 0.862 | 0.712 | ||
| I67_GSWP3 | [-] | 2.25 | 1.05 | 4.87 | 1.21 | 0.0107 | -2.38 | 0.499 | 0.759 | 0.629 |
Download Data |
Period Mean (original grids) [Pg] |
Model Period Mean (intersection) [Pg] |
Benchmark Period Mean (intersection) [Pg] |
Model Period Mean (complement) [Pg] |
Benchmark Period Mean (complement) [Pg] |
Bias [kg m-2] |
Bias Score [1] |
Spatial Distribution Score [1] |
Overall Score [1] |
|||
|---|---|---|---|---|---|---|---|---|---|---|---|---|
| Benchmark | [-] | 9.77 | ||||||||||
| I62_CRUJRA | [-] | 20.0 | 19.2 | 9.60 | 0.574 | 0.175 | 1.99 | 0.320 | 0.493 | 0.406 | ||
| I63_CRUJRA | [-] | 18.9 | 18.1 | 9.60 | 0.508 | 0.175 | 1.79 | 0.330 | 0.493 | 0.411 | ||
| I65_CRUJRA | [-] | 12.3 | 11.7 | 9.60 | 0.348 | 0.175 | 0.558 | 0.411 | 0.783 | 0.597 | ||
| I67_GSWP3 | [-] | 18.3 | 17.4 | 9.77 | 0.626 | 1.68 | 0.358 | 0.610 | 0.484 |
Download Data |
Period Mean (original grids) [Pg] |
Model Period Mean (intersection) [Pg] |
Benchmark Period Mean (intersection) [Pg] |
Model Period Mean (complement) [Pg] |
Benchmark Period Mean (complement) [Pg] |
Bias [kg m-2] |
Bias Score [1] |
Spatial Distribution Score [1] |
Overall Score [1] |
|||
|---|---|---|---|---|---|---|---|---|---|---|---|---|
| Benchmark | [-] | 0.211 | ||||||||||
| I62_CRUJRA | [-] | 17.2 | 0.0701 | 0.210 | 16.6 | 0.000277 | -1.10 | 0.568 | 0.928 | 0.748 | ||
| I63_CRUJRA | [-] | 17.2 | 0.0701 | 0.210 | 16.6 | 0.000277 | -1.10 | 0.568 | 0.928 | 0.748 | ||
| I65_CRUJRA | [-] | 14.1 | 0.0728 | 0.210 | 13.7 | 0.000277 | -1.08 | 0.577 | 0.928 | 0.752 | ||
| I67_GSWP3 | [-] | 11.6 | 0.0599 | 0.211 | 11.1 | -1.12 | 0.554 | 0.901 | 0.727 |
Download Data |
Period Mean (original grids) [Pg] |
Model Period Mean (intersection) [Pg] |
Benchmark Period Mean (intersection) [Pg] |
Model Period Mean (complement) [Pg] |
Benchmark Period Mean (complement) [Pg] |
Bias [kg m-2] |
Bias Score [1] |
Spatial Distribution Score [1] |
Overall Score [1] |
|||
|---|---|---|---|---|---|---|---|---|---|---|---|---|
| Benchmark | [-] | 16.1 | ||||||||||
| I62_CRUJRA | [-] | 23.7 | 22.3 | 16.1 | 1.25 | 0.0548 | 2.03 | 0.537 | 0.366 | 0.451 | ||
| I63_CRUJRA | [-] | 23.6 | 22.2 | 16.1 | 1.25 | 0.0548 | 2.01 | 0.538 | 0.367 | 0.452 | ||
| I65_CRUJRA | [-] | 22.0 | 20.7 | 16.1 | 1.14 | 0.0548 | 1.58 | 0.554 | 0.423 | 0.489 | ||
| I67_GSWP3 | [-] | 15.4 | 14.3 | 16.1 | 0.916 | -0.216 | 0.582 | 0.579 | 0.581 |
Download Data |
Period Mean (original grids) [Pg] |
Model Period Mean (intersection) [Pg] |
Benchmark Period Mean (intersection) [Pg] |
Model Period Mean (complement) [Pg] |
Benchmark Period Mean (complement) [Pg] |
Bias [kg m-2] |
Bias Score [1] |
Spatial Distribution Score [1] |
Overall Score [1] |
|||
|---|---|---|---|---|---|---|---|---|---|---|---|---|
| Benchmark | [-] | 24.5 | ||||||||||
| I62_CRUJRA | [-] | 60.9 | 60.6 | 24.0 | 0.553 | 0.527 | 7.48 | 0.250 | 0.463 | 0.357 | ||
| I63_CRUJRA | [-] | 59.8 | 59.4 | 24.0 | 0.551 | 0.527 | 7.27 | 0.255 | 0.479 | 0.367 | ||
| I65_CRUJRA | [-] | 42.9 | 42.7 | 24.0 | 0.432 | 0.527 | 3.98 | 0.377 | 0.645 | 0.511 | ||
| I67_GSWP3 | [-] | 51.4 | 50.9 | 24.5 | 0.676 | 5.56 | 0.313 | 0.576 | 0.444 |
Download Data |
Period Mean (original grids) [Pg] |
Model Period Mean (intersection) [Pg] |
Benchmark Period Mean (intersection) [Pg] |
Model Period Mean (complement) [Pg] |
Benchmark Period Mean (complement) [Pg] |
Bias [kg m-2] |
Bias Score [1] |
Spatial Distribution Score [1] |
Overall Score [1] |
|||
|---|---|---|---|---|---|---|---|---|---|---|---|---|
| Benchmark | [-] | 12.8 | ||||||||||
| I62_CRUJRA | [-] | 9.41 | 9.08 | 12.7 | 0.377 | 0.0995 | -0.823 | 0.539 | 0.701 | 0.620 | ||
| I63_CRUJRA | [-] | 9.42 | 9.10 | 12.7 | 0.376 | 0.0995 | -0.819 | 0.538 | 0.699 | 0.619 | ||
| I65_CRUJRA | [-] | 6.05 | 5.79 | 12.7 | 0.306 | 0.0995 | -1.80 | 0.520 | 0.857 | 0.688 | ||
| I67_GSWP3 | [-] | 9.14 | 8.83 | 12.8 | 0.414 | 0.00114 | -0.874 | 0.574 | 0.823 | 0.698 |
Temporally integrated period mean