Mean State
Download Data |
Period Mean (original grids) [Pg] |
Model Period Mean (intersection) [Pg] |
Benchmark Period Mean (intersection) [Pg] |
Model Period Mean (complement) [Pg] |
Benchmark Period Mean (complement) [Pg] |
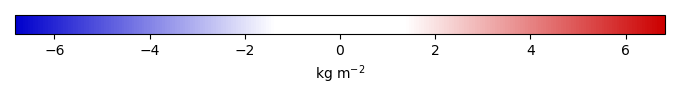
Bias [kg m-2] |
Bias Score [1] |
Spatial Distribution Score [1] |
Overall Score [1] |
|||
|---|---|---|---|---|---|---|---|---|---|---|---|---|
| Benchmark | [-] | 38.7 | ||||||||||
| I62_CRUJRA | [-] | 71.9 | 73.1 | 38.7 | 0.300 | 0.0457 | 8.21 | 0.419 | 0.594 | 0.506 | ||
| I63_CRUJRA | [-] | 71.9 | 73.1 | 38.7 | 0.300 | 0.0457 | 8.21 | 0.418 | 0.594 | 0.506 | ||
| I65_CRUJRA | [-] | 55.7 | 56.6 | 38.7 | 0.245 | 0.0457 | 4.41 | 0.510 | 0.770 | 0.640 | ||
| I67_GSWP3 | [-] | 45.5 | 45.8 | 38.7 | 0.376 | 2.83e-06 | 2.00 | 0.604 | 0.886 | 0.745 |
Download Data |
Period Mean (original grids) [Pg] |
Model Period Mean (intersection) [Pg] |
Benchmark Period Mean (intersection) [Pg] |
Model Period Mean (complement) [Pg] |
Benchmark Period Mean (complement) [Pg] |
Bias [kg m-2] |
Bias Score [1] |
Spatial Distribution Score [1] |
Overall Score [1] |
|||
|---|---|---|---|---|---|---|---|---|---|---|---|---|
| Benchmark | [-] | 11.9 | ||||||||||
| I62_CRUJRA | [-] | 9.46 | 8.35 | 11.9 | 0.0496 | 0.0196 | -0.503 | 0.512 | 0.656 | 0.584 | ||
| I63_CRUJRA | [-] | 9.46 | 8.35 | 11.9 | 0.0496 | 0.0196 | -0.503 | 0.512 | 0.656 | 0.584 | ||
| I65_CRUJRA | [-] | 6.84 | 6.06 | 11.9 | 0.0412 | 0.0196 | -0.861 | 0.511 | 0.818 | 0.664 | ||
| I67_GSWP3 | [-] | 4.43 | 3.85 | 11.9 | 0.0362 | 0.00349 | -1.19 | 0.490 | 0.745 | 0.618 |
Download Data |
Period Mean (original grids) [Pg] |
Model Period Mean (intersection) [Pg] |
Benchmark Period Mean (intersection) [Pg] |
Model Period Mean (complement) [Pg] |
Benchmark Period Mean (complement) [Pg] |
Bias [kg m-2] |
Bias Score [1] |
Spatial Distribution Score [1] |
Overall Score [1] |
|||
|---|---|---|---|---|---|---|---|---|---|---|---|---|
| Benchmark | [-] | 24.6 | ||||||||||
| I62_CRUJRA | [-] | 30.8 | 29.6 | 24.5 | 0.551 | 0.0612 | 0.786 | 0.443 | 0.391 | 0.417 | ||
| I63_CRUJRA | [-] | 30.8 | 29.6 | 24.5 | 0.551 | 0.0612 | 0.786 | 0.443 | 0.391 | 0.417 | ||
| I65_CRUJRA | [-] | 24.5 | 23.5 | 24.5 | 0.463 | 0.0612 | 0.0824 | 0.472 | 0.510 | 0.491 | ||
| I67_GSWP3 | [-] | 11.7 | 11.1 | 24.6 | 0.412 | 0.00368 | -1.26 | 0.501 | 0.844 | 0.672 |
Download Data |
Period Mean (original grids) [Pg] |
Model Period Mean (intersection) [Pg] |
Benchmark Period Mean (intersection) [Pg] |
Model Period Mean (complement) [Pg] |
Benchmark Period Mean (complement) [Pg] |
Bias [kg m-2] |
Bias Score [1] |
Spatial Distribution Score [1] |
Overall Score [1] |
|||
|---|---|---|---|---|---|---|---|---|---|---|---|---|
| Benchmark | [-] | 36.8 | ||||||||||
| I62_CRUJRA | [-] | 70.7 | 67.2 | 35.7 | 3.11 | 1.10 | 16.7 | 0.285 | 0.705 | 0.495 | ||
| I63_CRUJRA | [-] | 70.7 | 67.2 | 35.7 | 3.11 | 1.10 | 16.7 | 0.285 | 0.705 | 0.495 | ||
| I65_CRUJRA | [-] | 54.8 | 52.2 | 35.7 | 2.43 | 1.10 | 10.6 | 0.396 | 0.862 | 0.629 | ||
| I67_GSWP3 | [-] | 49.8 | 46.2 | 36.7 | 3.30 | 0.0600 | 8.97 | 0.428 | 0.903 | 0.665 |
Download Data |
Period Mean (original grids) [Pg] |
Model Period Mean (intersection) [Pg] |
Benchmark Period Mean (intersection) [Pg] |
Model Period Mean (complement) [Pg] |
Benchmark Period Mean (complement) [Pg] |
Bias [kg m-2] |
Bias Score [1] |
Spatial Distribution Score [1] |
Overall Score [1] |
|||
|---|---|---|---|---|---|---|---|---|---|---|---|---|
| Benchmark | [-] | 38.4 | ||||||||||
| I62_CRUJRA | [-] | 45.1 | 29.1 | 38.3 | 17.1 | 0.0891 | -0.649 | 0.513 | 0.625 | 0.569 | ||
| I63_CRUJRA | [-] | 45.1 | 29.1 | 38.3 | 17.0 | 0.0891 | -0.645 | 0.514 | 0.625 | 0.569 | ||
| I65_CRUJRA | [-] | 40.5 | 26.2 | 38.3 | 15.2 | 0.0891 | -1.07 | 0.513 | 0.677 | 0.595 | ||
| I67_GSWP3 | [-] | 42.0 | 29.9 | 38.4 | 13.0 | 0.00403 | -0.503 | 0.549 | 0.767 | 0.658 |
Download Data |
Period Mean (original grids) [Pg] |
Model Period Mean (intersection) [Pg] |
Benchmark Period Mean (intersection) [Pg] |
Model Period Mean (complement) [Pg] |
Benchmark Period Mean (complement) [Pg] |
Bias [kg m-2] |
Bias Score [1] |
Spatial Distribution Score [1] |
Overall Score [1] |
|||
|---|---|---|---|---|---|---|---|---|---|---|---|---|
| Benchmark | [-] | 43.7 | ||||||||||
| I62_CRUJRA | [-] | 42.2 | 40.0 | 43.4 | 1.07 | 0.257 | 0.830 | 0.507 | 0.734 | 0.621 | ||
| I63_CRUJRA | [-] | 42.2 | 40.0 | 43.4 | 1.07 | 0.257 | 0.830 | 0.507 | 0.734 | 0.621 | ||
| I65_CRUJRA | [-] | 34.9 | 33.2 | 43.4 | 0.833 | 0.257 | -0.400 | 0.524 | 0.843 | 0.684 | ||
| I67_GSWP3 | [-] | 27.6 | 26.0 | 43.7 | 0.874 | 0.0121 | -1.41 | 0.525 | 0.898 | 0.711 |
Download Data |
Period Mean (original grids) [Pg] |
Model Period Mean (intersection) [Pg] |
Benchmark Period Mean (intersection) [Pg] |
Model Period Mean (complement) [Pg] |
Benchmark Period Mean (complement) [Pg] |
Bias [kg m-2] |
Bias Score [1] |
Spatial Distribution Score [1] |
Overall Score [1] |
|||
|---|---|---|---|---|---|---|---|---|---|---|---|---|
| Benchmark | [-] | 13.7 | ||||||||||
| I62_CRUJRA | [-] | 14.3 | 5.99 | 13.5 | 8.12 | 0.139 | -0.974 | 0.465 | 0.537 | 0.501 | ||
| I63_CRUJRA | [-] | 14.3 | 5.99 | 13.5 | 8.13 | 0.139 | -0.974 | 0.465 | 0.537 | 0.501 | ||
| I65_CRUJRA | [-] | 13.4 | 5.05 | 13.5 | 8.16 | 0.139 | -1.17 | 0.465 | 0.653 | 0.559 | ||
| I67_GSWP3 | [-] | 11.6 | 3.90 | 13.6 | 7.49 | 0.0119 | -1.26 | 0.442 | 0.671 | 0.557 |
Download Data |
Period Mean (original grids) [Pg] |
Model Period Mean (intersection) [Pg] |
Benchmark Period Mean (intersection) [Pg] |
Model Period Mean (complement) [Pg] |
Benchmark Period Mean (complement) [Pg] |
Bias [kg m-2] |
Bias Score [1] |
Spatial Distribution Score [1] |
Overall Score [1] |
|||
|---|---|---|---|---|---|---|---|---|---|---|---|---|
| Benchmark | [-] | 349. | ||||||||||
| I62_CRUJRA | [-] | 851. | 564. | 347. | 285. | 2.11 | 4.02 | 0.432 | 0.482 | 0.457 | ||
| I63_CRUJRA | [-] | 845. | 564. | 347. | 278. | 2.11 | 4.02 | 0.432 | 0.482 | 0.457 | ||
| I65_CRUJRA | [-] | 680. | 463. | 347. | 215. | 2.11 | 2.41 | 0.468 | 0.625 | 0.546 | ||
| I67_GSWP3 | [-] | 604. | 372. | 349. | 230. | 0.130 | 1.12 | 0.508 | 0.755 | 0.631 |
Download Data |
Period Mean (original grids) [Pg] |
Model Period Mean (intersection) [Pg] |
Benchmark Period Mean (intersection) [Pg] |
Model Period Mean (complement) [Pg] |
Benchmark Period Mean (complement) [Pg] |
Bias [kg m-2] |
Bias Score [1] |
Spatial Distribution Score [1] |
Overall Score [1] |
|||
|---|---|---|---|---|---|---|---|---|---|---|---|---|
| Benchmark | [-] | 2.53 | ||||||||||
| I62_CRUJRA | [-] | 3.29 | 0.382 | 2.53 | 2.92 | 0.00250 | -0.965 | 0.480 | 0.0692 | 0.275 | ||
| I63_CRUJRA | [-] | 3.27 | 0.378 | 2.53 | 2.91 | 0.00250 | -0.967 | 0.481 | 0.0672 | 0.274 | ||
| I65_CRUJRA | [-] | 3.32 | 0.389 | 2.53 | 2.94 | 0.00250 | -0.961 | 0.481 | 0.0745 | 0.278 | ||
| I67_GSWP3 | [-] | 2.26 | 0.241 | 2.53 | 2.04 | 4.44e-06 | -0.995 | 0.478 | 0.0342 | 0.256 |
Download Data |
Period Mean (original grids) [Pg] |
Model Period Mean (intersection) [Pg] |
Benchmark Period Mean (intersection) [Pg] |
Model Period Mean (complement) [Pg] |
Benchmark Period Mean (complement) [Pg] |
Bias [kg m-2] |
Bias Score [1] |
Spatial Distribution Score [1] |
Overall Score [1] |
|||
|---|---|---|---|---|---|---|---|---|---|---|---|---|
| Benchmark | [-] | 11.1 | ||||||||||
| I62_CRUJRA | [-] | 17.1 | 15.9 | 10.9 | 0.773 | 0.149 | 3.50 | 0.443 | 0.479 | 0.461 | ||
| I63_CRUJRA | [-] | 17.1 | 15.9 | 10.9 | 0.773 | 0.149 | 3.50 | 0.443 | 0.479 | 0.461 | ||
| I65_CRUJRA | [-] | 14.1 | 13.0 | 10.9 | 0.639 | 0.149 | 2.27 | 0.496 | 0.653 | 0.574 | ||
| I67_GSWP3 | [-] | 11.6 | 10.3 | 11.0 | 0.822 | 0.0275 | 1.45 | 0.503 | 0.723 | 0.613 |
Download Data |
Period Mean (original grids) [Pg] |
Model Period Mean (intersection) [Pg] |
Benchmark Period Mean (intersection) [Pg] |
Model Period Mean (complement) [Pg] |
Benchmark Period Mean (complement) [Pg] |
Bias [kg m-2] |
Bias Score [1] |
Spatial Distribution Score [1] |
Overall Score [1] |
|||
|---|---|---|---|---|---|---|---|---|---|---|---|---|
| Benchmark | [-] | 1.55 | ||||||||||
| I62_CRUJRA | [-] | 23.8 | 5.31 | 1.52 | 18.3 | 0.0247 | 6.03 | 0.266 | 0.330 | 0.298 | ||
| I63_CRUJRA | [-] | 23.7 | 5.31 | 1.52 | 18.2 | 0.0247 | 6.03 | 0.266 | 0.330 | 0.298 | ||
| I65_CRUJRA | [-] | 22.1 | 4.84 | 1.52 | 17.1 | 0.0247 | 5.32 | 0.288 | 0.382 | 0.335 | ||
| I67_GSWP3 | [-] | 15.4 | 3.23 | 1.55 | 12.0 | 4.74e-05 | 3.09 | 0.383 | 0.536 | 0.459 |
Download Data |
Period Mean (original grids) [Pg] |
Model Period Mean (intersection) [Pg] |
Benchmark Period Mean (intersection) [Pg] |
Model Period Mean (complement) [Pg] |
Benchmark Period Mean (complement) [Pg] |
Bias [kg m-2] |
Bias Score [1] |
Spatial Distribution Score [1] |
Overall Score [1] |
|||
|---|---|---|---|---|---|---|---|---|---|---|---|---|
| Benchmark | [-] | 0.219 | ||||||||||
| I62_CRUJRA | [-] | 9.44 | 0.259 | 0.219 | 9.23 | 0.104 | 0.598 | 0.558 | 0.578 | |||
| I63_CRUJRA | [-] | 9.46 | 0.259 | 0.219 | 9.25 | 0.104 | 0.598 | 0.558 | 0.578 | |||
| I65_CRUJRA | [-] | 6.07 | 0.215 | 0.219 | 5.91 | -0.0339 | 0.590 | 0.374 | 0.482 | |||
| I67_GSWP3 | [-] | 9.16 | 0.189 | 0.219 | 9.08 | -0.113 | 0.614 | 0.389 | 0.502 |
Download Data |
Period Mean (original grids) [Pg] |
Model Period Mean (intersection) [Pg] |
Benchmark Period Mean (intersection) [Pg] |
Model Period Mean (complement) [Pg] |
Benchmark Period Mean (complement) [Pg] |
Bias [kg m-2] |
Bias Score [1] |
Spatial Distribution Score [1] |
Overall Score [1] |
|||
|---|---|---|---|---|---|---|---|---|---|---|---|---|
| Benchmark | [-] | 100. | ||||||||||
| I62_CRUJRA | [-] | 239. | 237. | 100. | 0.608 | 0.0690 | 16.8 | 0.270 | 0.533 | 0.402 | ||
| I63_CRUJRA | [-] | 239. | 237. | 100. | 0.608 | 0.0690 | 16.8 | 0.270 | 0.533 | 0.402 | ||
| I65_CRUJRA | [-] | 197. | 196. | 100. | 0.482 | 0.0690 | 11.8 | 0.379 | 0.659 | 0.519 | ||
| I67_GSWP3 | [-] | 157. | 155. | 100. | 0.778 | 0.000737 | 6.91 | 0.536 | 0.805 | 0.671 |
Download Data |
Period Mean (original grids) [Pg] |
Model Period Mean (intersection) [Pg] |
Benchmark Period Mean (intersection) [Pg] |
Model Period Mean (complement) [Pg] |
Benchmark Period Mean (complement) [Pg] |
Bias [kg m-2] |
Bias Score [1] |
Spatial Distribution Score [1] |
Overall Score [1] |
|||
|---|---|---|---|---|---|---|---|---|---|---|---|---|
| Benchmark | [-] | 18.4 | ||||||||||
| I62_CRUJRA | [-] | 42.8 | 43.0 | 18.4 | 0.483 | 0.0281 | 3.97 | 0.380 | 0.426 | 0.403 | ||
| I63_CRUJRA | [-] | 42.9 | 43.0 | 18.4 | 0.484 | 0.0281 | 3.98 | 0.379 | 0.427 | 0.403 | ||
| I65_CRUJRA | [-] | 37.8 | 38.0 | 18.4 | 0.421 | 0.0281 | 3.19 | 0.417 | 0.468 | 0.442 | ||
| I67_GSWP3 | [-] | 27.0 | 27.0 | 18.4 | 0.446 | 0.00509 | 1.47 | 0.514 | 0.573 | 0.544 |
Download Data |
Period Mean (original grids) [Pg] |
Model Period Mean (intersection) [Pg] |
Benchmark Period Mean (intersection) [Pg] |
Model Period Mean (complement) [Pg] |
Benchmark Period Mean (complement) [Pg] |
Bias [kg m-2] |
Bias Score [1] |
Spatial Distribution Score [1] |
Overall Score [1] |
|||
|---|---|---|---|---|---|---|---|---|---|---|---|---|
| Benchmark | [-] | 7.28 | ||||||||||
| I62_CRUJRA | [-] | 8.64 | 8.49 | 7.15 | 0.173 | 0.128 | 1.47 | 0.497 | 0.334 | 0.416 | ||
| I63_CRUJRA | [-] | 8.64 | 8.49 | 7.15 | 0.173 | 0.128 | 1.47 | 0.497 | 0.334 | 0.415 | ||
| I65_CRUJRA | [-] | 8.34 | 8.18 | 7.15 | 0.176 | 0.128 | 1.33 | 0.499 | 0.368 | 0.433 | ||
| I67_GSWP3 | [-] | 9.42 | 9.36 | 7.28 | 0.174 | 0.00117 | 1.35 | 0.481 | 0.462 | 0.471 |
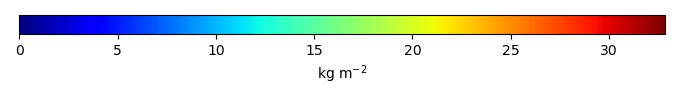
Temporally integrated period mean