Mean State
Download Data |
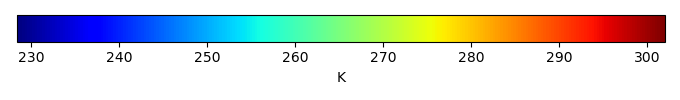
Period Mean (original grids) [K] |
Model Period Mean (intersection) [K] |
Benchmark Period Mean (intersection) [K] |
Model Period Mean (complement) [K] |
Benchmark Period Mean (complement) [K] |
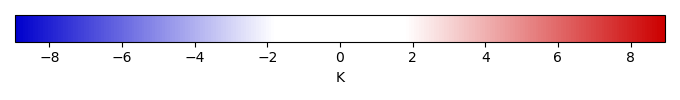
Bias [K] |
RMSE [K] |
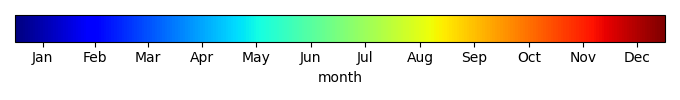
Phase Shift [months] |
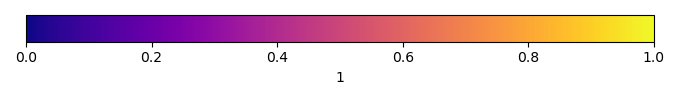
Bias Score [1] |
RMSE Score [1] |
Seasonal Cycle Score [1] |
Spatial Distribution Score [1] |
Overall Score [1] |
|||
|---|---|---|---|---|---|---|---|---|---|---|---|---|---|---|---|---|
| Benchmark | [-] | 298. | ||||||||||||||
| I62_CRUJRA | [-] | 298. | 298. | 298. | 301. | 300. | -0.571 | 1.15 | 0.714 | 0.407 | 0.679 | 0.930 | 0.963 | 0.732 | ||
| I63_CRUJRA | [-] | 298. | 298. | 298. | 301. | 300. | -0.571 | 1.15 | 0.714 | 0.407 | 0.679 | 0.930 | 0.963 | 0.732 | ||
| I65_CRUJRA | [-] | 298. | 298. | 298. | 300. | 300. | -0.628 | 1.20 | 0.733 | 0.392 | 0.669 | 0.925 | 0.967 | 0.724 | ||
| I67_GSWP3 | [-] | 299. | 299. | 298. | 300. | 300. | 0.468 | 0.723 | 0.296 | 0.574 | 0.823 | 0.970 | 0.991 | 0.836 |
Download Data |
Period Mean (original grids) [K] |
Model Period Mean (intersection) [K] |
Benchmark Period Mean (intersection) [K] |
Model Period Mean (complement) [K] |
Benchmark Period Mean (complement) [K] |
Bias [K] |
RMSE [K] |
Phase Shift [months] |
Bias Score [1] |
RMSE Score [1] |
Seasonal Cycle Score [1] |
Spatial Distribution Score [1] |
Overall Score [1] |
|||
|---|---|---|---|---|---|---|---|---|---|---|---|---|---|---|---|---|
| Benchmark | [-] | 300. | ||||||||||||||
| I62_CRUJRA | [-] | 300. | 300. | 300. | 301. | 300. | -0.293 | 1.19 | 0.409 | 0.728 | 0.701 | 0.971 | 0.988 | 0.818 | ||
| I63_CRUJRA | [-] | 300. | 300. | 300. | 301. | 300. | -0.293 | 1.19 | 0.409 | 0.728 | 0.701 | 0.971 | 0.988 | 0.818 | ||
| I65_CRUJRA | [-] | 300. | 300. | 300. | 301. | 300. | -0.303 | 1.18 | 0.408 | 0.730 | 0.708 | 0.971 | 0.986 | 0.821 | ||
| I67_GSWP3 | [-] | 301. | 301. | 300. | 301. | 299. | 0.627 | 0.867 | 0.181 | 0.708 | 0.885 | 0.985 | 0.988 | 0.890 |
Download Data |
Period Mean (original grids) [K] |
Model Period Mean (intersection) [K] |
Benchmark Period Mean (intersection) [K] |
Model Period Mean (complement) [K] |
Benchmark Period Mean (complement) [K] |
Bias [K] |
RMSE [K] |
Phase Shift [months] |
Bias Score [1] |
RMSE Score [1] |
Seasonal Cycle Score [1] |
Spatial Distribution Score [1] |
Overall Score [1] |
|||
|---|---|---|---|---|---|---|---|---|---|---|---|---|---|---|---|---|
| Benchmark | [-] | 295. | ||||||||||||||
| I62_CRUJRA | [-] | 295. | 295. | 295. | 296. | 297. | -0.379 | 1.11 | 0.513 | 0.664 | 0.760 | 0.936 | 1.00 | 0.824 | ||
| I63_CRUJRA | [-] | 295. | 295. | 295. | 296. | 297. | -0.379 | 1.11 | 0.513 | 0.664 | 0.760 | 0.936 | 1.00 | 0.824 | ||
| I65_CRUJRA | [-] | 295. | 295. | 295. | 296. | 297. | -0.398 | 1.12 | 0.524 | 0.662 | 0.758 | 0.934 | 1.00 | 0.822 | ||
| I67_GSWP3 | [-] | 296. | 296. | 295. | 296. | 299. | 0.582 | 0.865 | 0.258 | 0.688 | 0.889 | 0.970 | 0.996 | 0.886 |
Download Data |
Period Mean (original grids) [K] |
Model Period Mean (intersection) [K] |
Benchmark Period Mean (intersection) [K] |
Model Period Mean (complement) [K] |
Benchmark Period Mean (complement) [K] |
Bias [K] |
RMSE [K] |
Phase Shift [months] |
Bias Score [1] |
RMSE Score [1] |
Seasonal Cycle Score [1] |
Spatial Distribution Score [1] |
Overall Score [1] |
|||
|---|---|---|---|---|---|---|---|---|---|---|---|---|---|---|---|---|
| Benchmark | [-] | 262. | ||||||||||||||
| I62_CRUJRA | [-] | 261. | 260. | 262. | 264. | 266. | -1.12 | 2.25 | 0.0180 | 0.908 | 0.901 | 0.999 | 0.994 | 0.941 | ||
| I63_CRUJRA | [-] | 261. | 260. | 262. | 264. | 266. | -1.06 | 2.20 | 0.0191 | 0.910 | 0.905 | 0.999 | 0.994 | 0.942 | ||
| I65_CRUJRA | [-] | 260. | 260. | 262. | 264. | 266. | -1.14 | 2.29 | 0.0180 | 0.907 | 0.898 | 0.999 | 0.994 | 0.939 | ||
| I67_GSWP3 | [-] | 261. | 261. | 262. | 266. | -0.0628 | 1.16 | 0.0142 | 0.941 | 0.957 | 0.999 | 0.999 | 0.971 |
Download Data |
Period Mean (original grids) [K] |
Model Period Mean (intersection) [K] |
Benchmark Period Mean (intersection) [K] |
Model Period Mean (complement) [K] |
Benchmark Period Mean (complement) [K] |
Bias [K] |
RMSE [K] |
Phase Shift [months] |
Bias Score [1] |
RMSE Score [1] |
Seasonal Cycle Score [1] |
Spatial Distribution Score [1] |
Overall Score [1] |
|||
|---|---|---|---|---|---|---|---|---|---|---|---|---|---|---|---|---|
| Benchmark | [-] | 299. | ||||||||||||||
| I62_CRUJRA | [-] | 298. | 298. | 299. | 299. | 299. | -0.524 | 1.05 | 1.18 | 0.296 | 0.660 | 0.830 | 0.963 | 0.682 | ||
| I63_CRUJRA | [-] | 298. | 298. | 299. | 299. | 299. | -0.524 | 1.05 | 1.18 | 0.296 | 0.660 | 0.830 | 0.963 | 0.682 | ||
| I65_CRUJRA | [-] | 298. | 298. | 299. | 299. | 299. | -0.581 | 1.08 | 1.26 | 0.285 | 0.653 | 0.817 | 0.966 | 0.675 | ||
| I67_GSWP3 | [-] | 299. | 299. | 299. | 300. | 299. | 0.313 | 0.777 | 0.668 | 0.387 | 0.780 | 0.909 | 0.898 | 0.751 |
Download Data |
Period Mean (original grids) [K] |
Model Period Mean (intersection) [K] |
Benchmark Period Mean (intersection) [K] |
Model Period Mean (complement) [K] |
Benchmark Period Mean (complement) [K] |
Bias [K] |
RMSE [K] |
Phase Shift [months] |
Bias Score [1] |
RMSE Score [1] |
Seasonal Cycle Score [1] |
Spatial Distribution Score [1] |
Overall Score [1] |
|||
|---|---|---|---|---|---|---|---|---|---|---|---|---|---|---|---|---|
| Benchmark | [-] | 271. | ||||||||||||||
| I62_CRUJRA | [-] | 270. | 270. | 271. | 274. | 274. | -1.49 | 1.80 | 0.0118 | 0.896 | 0.941 | 0.999 | 0.999 | 0.955 | ||
| I63_CRUJRA | [-] | 270. | 270. | 271. | 274. | 274. | -1.41 | 1.71 | 0.0118 | 0.900 | 0.946 | 0.999 | 0.999 | 0.958 | ||
| I65_CRUJRA | [-] | 270. | 270. | 271. | 274. | 274. | -1.38 | 1.75 | 0.0118 | 0.902 | 0.938 | 0.999 | 0.998 | 0.955 | ||
| I67_GSWP3 | [-] | 271. | 271. | 271. | 274. | 275. | -0.327 | 0.882 | 0.00747 | 0.957 | 0.958 | 0.999 | 1.00 | 0.975 |
Download Data |
Period Mean (original grids) [K] |
Model Period Mean (intersection) [K] |
Benchmark Period Mean (intersection) [K] |
Model Period Mean (complement) [K] |
Benchmark Period Mean (complement) [K] |
Bias [K] |
RMSE [K] |
Phase Shift [months] |
Bias Score [1] |
RMSE Score [1] |
Seasonal Cycle Score [1] |
Spatial Distribution Score [1] |
Overall Score [1] |
|||
|---|---|---|---|---|---|---|---|---|---|---|---|---|---|---|---|---|
| Benchmark | [-] | 281. | ||||||||||||||
| I62_CRUJRA | [-] | 280. | 280. | 280. | 287. | 288. | -0.660 | 1.54 | 0.0388 | 0.873 | 0.935 | 0.997 | 0.999 | 0.948 | ||
| I63_CRUJRA | [-] | 280. | 280. | 280. | 287. | 288. | -0.648 | 1.52 | 0.0379 | 0.873 | 0.937 | 0.997 | 0.999 | 0.949 | ||
| I65_CRUJRA | [-] | 280. | 280. | 280. | 287. | 288. | -0.654 | 1.54 | 0.0395 | 0.873 | 0.935 | 0.997 | 0.999 | 0.948 | ||
| I67_GSWP3 | [-] | 280. | 280. | 280. | 287. | 288. | 0.113 | 1.18 | 0.0300 | 0.899 | 0.954 | 0.998 | 0.999 | 0.961 |
Download Data |
Period Mean (original grids) [K] |
Model Period Mean (intersection) [K] |
Benchmark Period Mean (intersection) [K] |
Model Period Mean (complement) [K] |
Benchmark Period Mean (complement) [K] |
Bias [K] |
RMSE [K] |
Phase Shift [months] |
Bias Score [1] |
RMSE Score [1] |
Seasonal Cycle Score [1] |
Spatial Distribution Score [1] |
Overall Score [1] |
|||
|---|---|---|---|---|---|---|---|---|---|---|---|---|---|---|---|---|
| Benchmark | [-] | 297. | ||||||||||||||
| I62_CRUJRA | [-] | 296. | 296. | 297. | 300. | 300. | -0.381 | 1.27 | 0.221 | 0.746 | 0.858 | 0.979 | 0.989 | 0.886 | ||
| I63_CRUJRA | [-] | 296. | 296. | 297. | 300. | 300. | -0.381 | 1.27 | 0.221 | 0.746 | 0.858 | 0.979 | 0.989 | 0.886 | ||
| I65_CRUJRA | [-] | 296. | 296. | 297. | 300. | 300. | -0.439 | 1.29 | 0.220 | 0.743 | 0.853 | 0.978 | 0.990 | 0.884 | ||
| I67_GSWP3 | [-] | 297. | 297. | 297. | 300. | 299. | 0.0253 | 1.11 | 0.150 | 0.760 | 0.893 | 0.987 | 1.00 | 0.907 |
Download Data |
Period Mean (original grids) [K] |
Model Period Mean (intersection) [K] |
Benchmark Period Mean (intersection) [K] |
Model Period Mean (complement) [K] |
Benchmark Period Mean (complement) [K] |
Bias [K] |
RMSE [K] |
Phase Shift [months] |
Bias Score [1] |
RMSE Score [1] |
Seasonal Cycle Score [1] |
Spatial Distribution Score [1] |
Overall Score [1] |
|||
|---|---|---|---|---|---|---|---|---|---|---|---|---|---|---|---|---|
| Benchmark | [-] | 264. | ||||||||||||||
| I62_CRUJRA | [-] | 263. | 263. | 264. | 264. | 265. | -1.52 | 2.11 | 0.0146 | 0.899 | 0.919 | 0.999 | 0.999 | 0.947 | ||
| I63_CRUJRA | [-] | 263. | 263. | 264. | 264. | 265. | -1.45 | 2.04 | 0.0190 | 0.903 | 0.923 | 0.999 | 0.999 | 0.949 | ||
| I65_CRUJRA | [-] | 263. | 263. | 264. | 264. | 265. | -1.55 | 2.16 | 0.0187 | 0.897 | 0.916 | 0.999 | 0.999 | 0.946 | ||
| I67_GSWP3 | [-] | 264. | 264. | 264. | 265. | 268. | -0.234 | 0.814 | 0.00777 | 0.963 | 0.963 | 0.999 | 1.00 | 0.978 |
Download Data |
Period Mean (original grids) [K] |
Model Period Mean (intersection) [K] |
Benchmark Period Mean (intersection) [K] |
Model Period Mean (complement) [K] |
Benchmark Period Mean (complement) [K] |
Bias [K] |
RMSE [K] |
Phase Shift [months] |
Bias Score [1] |
RMSE Score [1] |
Seasonal Cycle Score [1] |
Spatial Distribution Score [1] |
Overall Score [1] |
|||
|---|---|---|---|---|---|---|---|---|---|---|---|---|---|---|---|---|
| Benchmark | [-] | 295. | ||||||||||||||
| I62_CRUJRA | [-] | 295. | 295. | 295. | 293. | 294. | -0.260 | 0.729 | 0.0999 | 0.880 | 0.924 | 0.993 | 1.00 | 0.944 | ||
| I63_CRUJRA | [-] | 295. | 295. | 295. | 293. | 294. | -0.260 | 0.729 | 0.0999 | 0.880 | 0.924 | 0.993 | 1.00 | 0.944 | ||
| I65_CRUJRA | [-] | 295. | 295. | 295. | 293. | 294. | -0.283 | 0.741 | 0.105 | 0.878 | 0.923 | 0.993 | 1.00 | 0.943 | ||
| I67_GSWP3 | [-] | 295. | 295. | 295. | 292. | 294. | 0.411 | 0.642 | 0.0832 | 0.883 | 0.939 | 0.994 | 1.00 | 0.951 |
Download Data |
Period Mean (original grids) [K] |
Model Period Mean (intersection) [K] |
Benchmark Period Mean (intersection) [K] |
Model Period Mean (complement) [K] |
Benchmark Period Mean (complement) [K] |
Bias [K] |
RMSE [K] |
Phase Shift [months] |
Bias Score [1] |
RMSE Score [1] |
Seasonal Cycle Score [1] |
Spatial Distribution Score [1] |
Overall Score [1] |
|||
|---|---|---|---|---|---|---|---|---|---|---|---|---|---|---|---|---|
| Benchmark | [-] | 282. | ||||||||||||||
| I62_CRUJRA | [-] | 281. | 281. | 282. | 283. | 286. | -0.758 | 1.27 | 0.155 | 0.853 | 0.925 | 0.990 | 0.999 | 0.939 | ||
| I63_CRUJRA | [-] | 281. | 281. | 282. | 283. | 286. | -0.746 | 1.26 | 0.155 | 0.854 | 0.927 | 0.990 | 0.999 | 0.939 | ||
| I65_CRUJRA | [-] | 281. | 281. | 282. | 283. | 286. | -0.725 | 1.26 | 0.167 | 0.856 | 0.924 | 0.989 | 0.999 | 0.938 | ||
| I67_GSWP3 | [-] | 282. | 282. | 282. | 284. | 289. | -0.162 | 0.987 | 0.146 | 0.891 | 0.931 | 0.990 | 0.999 | 0.949 |
Download Data |
Period Mean (original grids) [K] |
Model Period Mean (intersection) [K] |
Benchmark Period Mean (intersection) [K] |
Model Period Mean (complement) [K] |
Benchmark Period Mean (complement) [K] |
Bias [K] |
RMSE [K] |
Phase Shift [months] |
Bias Score [1] |
RMSE Score [1] |
Seasonal Cycle Score [1] |
Spatial Distribution Score [1] |
Overall Score [1] |
|||
|---|---|---|---|---|---|---|---|---|---|---|---|---|---|---|---|---|
| Benchmark | [-] | 287. | ||||||||||||||
| I62_CRUJRA | [-] | 285. | 286. | 287. | 277. | 291. | -0.827 | 1.50 | 0.261 | 0.759 | 0.858 | 0.972 | 0.997 | 0.889 | ||
| I63_CRUJRA | [-] | 285. | 286. | 287. | 277. | 291. | -0.815 | 1.48 | 0.261 | 0.759 | 0.859 | 0.972 | 0.997 | 0.889 | ||
| I65_CRUJRA | [-] | 285. | 286. | 287. | 277. | 291. | -0.837 | 1.51 | 0.268 | 0.755 | 0.855 | 0.971 | 0.997 | 0.886 | ||
| I67_GSWP3 | [-] | 283. | 287. | 287. | 248. | 295. | 0.115 | 0.971 | 0.147 | 0.813 | 0.916 | 0.984 | 0.999 | 0.926 |
Download Data |
Period Mean (original grids) [K] |
Model Period Mean (intersection) [K] |
Benchmark Period Mean (intersection) [K] |
Model Period Mean (complement) [K] |
Benchmark Period Mean (complement) [K] |
Bias [K] |
RMSE [K] |
Phase Shift [months] |
Bias Score [1] |
RMSE Score [1] |
Seasonal Cycle Score [1] |
Spatial Distribution Score [1] |
Overall Score [1] |
|||
|---|---|---|---|---|---|---|---|---|---|---|---|---|---|---|---|---|
| Benchmark | [-] | 296. | ||||||||||||||
| I62_CRUJRA | [-] | 295. | 295. | 296. | 296. | 298. | -0.689 | 1.46 | 0.331 | 0.825 | 0.897 | 0.973 | 1.00 | 0.918 | ||
| I63_CRUJRA | [-] | 295. | 295. | 296. | 296. | 298. | -0.689 | 1.46 | 0.331 | 0.825 | 0.897 | 0.973 | 1.00 | 0.918 | ||
| I65_CRUJRA | [-] | 295. | 295. | 296. | 296. | 298. | -0.692 | 1.46 | 0.334 | 0.825 | 0.897 | 0.973 | 1.00 | 0.918 | ||
| I67_GSWP3 | [-] | 296. | 296. | 296. | 295. | 291. | 0.259 | 0.879 | 0.164 | 0.892 | 0.939 | 0.987 | 0.999 | 0.951 |
Download Data |
Period Mean (original grids) [K] |
Model Period Mean (intersection) [K] |
Benchmark Period Mean (intersection) [K] |
Model Period Mean (complement) [K] |
Benchmark Period Mean (complement) [K] |
Bias [K] |
RMSE [K] |
Phase Shift [months] |
Bias Score [1] |
RMSE Score [1] |
Seasonal Cycle Score [1] |
Spatial Distribution Score [1] |
Overall Score [1] |
|||
|---|---|---|---|---|---|---|---|---|---|---|---|---|---|---|---|---|
| Benchmark | [-] | 265. | ||||||||||||||
| I62_CRUJRA | [-] | 263. | 263. | 265. | 262. | 266. | -1.50 | 2.17 | 0.0106 | 0.886 | 0.898 | 0.999 | 0.996 | 0.935 | ||
| I63_CRUJRA | [-] | 263. | 264. | 265. | 262. | 266. | -1.48 | 2.10 | 0.0107 | 0.887 | 0.904 | 0.999 | 0.995 | 0.938 | ||
| I65_CRUJRA | [-] | 263. | 263. | 265. | 262. | 266. | -1.50 | 2.21 | 0.0106 | 0.886 | 0.894 | 0.999 | 0.995 | 0.934 | ||
| I67_GSWP3 | [-] | 265. | 265. | 265. | 264. | -0.248 | 1.05 | 0.0145 | 0.941 | 0.948 | 0.999 | 1.00 | 0.967 |
Download Data |
Period Mean (original grids) [K] |
Model Period Mean (intersection) [K] |
Benchmark Period Mean (intersection) [K] |
Model Period Mean (complement) [K] |
Benchmark Period Mean (complement) [K] |
Bias [K] |
RMSE [K] |
Phase Shift [months] |
Bias Score [1] |
RMSE Score [1] |
Seasonal Cycle Score [1] |
Spatial Distribution Score [1] |
Overall Score [1] |
|||
|---|---|---|---|---|---|---|---|---|---|---|---|---|---|---|---|---|
| Benchmark | [-] | 296. | ||||||||||||||
| I62_CRUJRA | [-] | 295. | 295. | 296. | 298. | 299. | -0.264 | 1.29 | 0.254 | 0.644 | 0.846 | 0.980 | 0.998 | 0.863 | ||
| I63_CRUJRA | [-] | 295. | 295. | 296. | 298. | 299. | -0.264 | 1.29 | 0.254 | 0.644 | 0.846 | 0.980 | 0.998 | 0.863 | ||
| I65_CRUJRA | [-] | 295. | 295. | 296. | 298. | 299. | -0.337 | 1.32 | 0.261 | 0.640 | 0.840 | 0.980 | 0.999 | 0.860 | ||
| I67_GSWP3 | [-] | 296. | 295. | 296. | 298. | 299. | 0.343 | 1.22 | 0.241 | 0.648 | 0.877 | 0.981 | 0.988 | 0.874 |
Download Data |
Period Mean (original grids) [K] |
Model Period Mean (intersection) [K] |
Benchmark Period Mean (intersection) [K] |
Model Period Mean (complement) [K] |
Benchmark Period Mean (complement) [K] |
Bias [K] |
RMSE [K] |
Phase Shift [months] |
Bias Score [1] |
RMSE Score [1] |
Seasonal Cycle Score [1] |
Spatial Distribution Score [1] |
Overall Score [1] |
|||
|---|---|---|---|---|---|---|---|---|---|---|---|---|---|---|---|---|
| Benchmark | [-] | 286. | ||||||||||||||
| I62_CRUJRA | [-] | 285. | 285. | 286. | 293. | 292. | -0.675 | 0.838 | 0.0365 | 0.915 | 0.964 | 0.998 | 1.00 | 0.968 | ||
| I63_CRUJRA | [-] | 285. | 285. | 286. | 293. | 292. | -0.672 | 0.832 | 0.0365 | 0.915 | 0.965 | 0.998 | 1.00 | 0.968 | ||
| I65_CRUJRA | [-] | 285. | 285. | 286. | 293. | 292. | -0.703 | 0.860 | 0.0360 | 0.912 | 0.964 | 0.998 | 1.00 | 0.968 | ||
| I67_GSWP3 | [-] | 286. | 286. | 286. | 293. | 295. | 0.166 | 0.519 | 0.0316 | 0.946 | 0.972 | 0.998 | 1.00 | 0.977 |
Download Data |
Period Mean (original grids) [K] |
Model Period Mean (intersection) [K] |
Benchmark Period Mean (intersection) [K] |
Model Period Mean (complement) [K] |
Benchmark Period Mean (complement) [K] |
Bias [K] |
RMSE [K] |
Phase Shift [months] |
Bias Score [1] |
RMSE Score [1] |
Seasonal Cycle Score [1] |
Spatial Distribution Score [1] |
Overall Score [1] |
|||
|---|---|---|---|---|---|---|---|---|---|---|---|---|---|---|---|---|
| Benchmark | [-] | 275. | ||||||||||||||
| I62_CRUJRA | [-] | 273. | 273. | 274. | 277. | 278. | -1.20 | 1.54 | 0.0684 | 0.884 | 0.932 | 0.995 | 0.990 | 0.947 | ||
| I63_CRUJRA | [-] | 273. | 273. | 274. | 277. | 278. | -1.15 | 1.46 | 0.0653 | 0.888 | 0.937 | 0.996 | 0.992 | 0.950 | ||
| I65_CRUJRA | [-] | 273. | 273. | 274. | 277. | 278. | -1.01 | 1.40 | 0.0713 | 0.898 | 0.930 | 0.995 | 0.992 | 0.949 | ||
| I67_GSWP3 | [-] | 274. | 274. | 274. | 278. | -0.121 | 0.774 | 0.0387 | 0.939 | 0.953 | 0.997 | 0.999 | 0.968 |
Download Data |
Period Mean (original grids) [K] |
Model Period Mean (intersection) [K] |
Benchmark Period Mean (intersection) [K] |
Model Period Mean (complement) [K] |
Benchmark Period Mean (complement) [K] |
Bias [K] |
RMSE [K] |
Phase Shift [months] |
Bias Score [1] |
RMSE Score [1] |
Seasonal Cycle Score [1] |
Spatial Distribution Score [1] |
Overall Score [1] |
|||
|---|---|---|---|---|---|---|---|---|---|---|---|---|---|---|---|---|
| Benchmark | [-] | 284. | ||||||||||||||
| I62_CRUJRA | [-] | 283. | 283. | 284. | 287. | 286. | -0.691 | 1.44 | 0.0458 | 0.860 | 0.917 | 0.997 | 1.00 | 0.938 | ||
| I63_CRUJRA | [-] | 283. | 283. | 284. | 287. | 286. | -0.690 | 1.43 | 0.0456 | 0.860 | 0.918 | 0.997 | 1.00 | 0.938 | ||
| I65_CRUJRA | [-] | 283. | 283. | 284. | 287. | 286. | -0.641 | 1.42 | 0.0482 | 0.863 | 0.916 | 0.997 | 1.00 | 0.938 | ||
| I67_GSWP3 | [-] | 284. | 284. | 284. | 286. | 285. | 0.240 | 1.12 | 0.0297 | 0.881 | 0.936 | 0.998 | 0.999 | 0.950 |
Download Data |
Period Mean (original grids) [K] |
Model Period Mean (intersection) [K] |
Benchmark Period Mean (intersection) [K] |
Model Period Mean (complement) [K] |
Benchmark Period Mean (complement) [K] |
Bias [K] |
RMSE [K] |
Phase Shift [months] |
Bias Score [1] |
RMSE Score [1] |
Seasonal Cycle Score [1] |
Spatial Distribution Score [1] |
Overall Score [1] |
|||
|---|---|---|---|---|---|---|---|---|---|---|---|---|---|---|---|---|
| Benchmark | [-] | 299. | ||||||||||||||
| I62_CRUJRA | [-] | 298. | 298. | 299. | 300. | 299. | -0.865 | 1.26 | 0.820 | 0.340 | 0.704 | 0.885 | 0.999 | 0.726 | ||
| I63_CRUJRA | [-] | 298. | 298. | 299. | 300. | 299. | -0.865 | 1.26 | 0.820 | 0.340 | 0.704 | 0.885 | 0.999 | 0.726 | ||
| I65_CRUJRA | [-] | 298. | 298. | 299. | 300. | 299. | -0.985 | 1.34 | 0.824 | 0.306 | 0.689 | 0.887 | 1.00 | 0.714 | ||
| I67_GSWP3 | [-] | 299. | 299. | 299. | 300. | 301. | 0.232 | 0.725 | 0.468 | 0.582 | 0.830 | 0.936 | 0.982 | 0.832 |
Download Data |
Period Mean (original grids) [K] |
Model Period Mean (intersection) [K] |
Benchmark Period Mean (intersection) [K] |
Model Period Mean (complement) [K] |
Benchmark Period Mean (complement) [K] |
Bias [K] |
RMSE [K] |
Phase Shift [months] |
Bias Score [1] |
RMSE Score [1] |
Seasonal Cycle Score [1] |
Spatial Distribution Score [1] |
Overall Score [1] |
|||
|---|---|---|---|---|---|---|---|---|---|---|---|---|---|---|---|---|
| Benchmark | [-] | 296. | ||||||||||||||
| I62_CRUJRA | [-] | 295. | 295. | 296. | 296. | 293. | -0.602 | 0.950 | 0.416 | 0.700 | 0.825 | 0.953 | 0.999 | 0.860 | ||
| I63_CRUJRA | [-] | 295. | 295. | 296. | 296. | 293. | -0.602 | 0.950 | 0.416 | 0.700 | 0.825 | 0.953 | 0.999 | 0.860 | ||
| I65_CRUJRA | [-] | 295. | 295. | 296. | 296. | 293. | -0.763 | 1.08 | 0.462 | 0.664 | 0.812 | 0.945 | 1.00 | 0.847 | ||
| I67_GSWP3 | [-] | 296. | 296. | 296. | 296. | 288. | 0.360 | 0.623 | 0.220 | 0.765 | 0.905 | 0.974 | 0.999 | 0.910 |
Download Data |
Period Mean (original grids) [K] |
Model Period Mean (intersection) [K] |
Benchmark Period Mean (intersection) [K] |
Model Period Mean (complement) [K] |
Benchmark Period Mean (complement) [K] |
Bias [K] |
RMSE [K] |
Phase Shift [months] |
Bias Score [1] |
RMSE Score [1] |
Seasonal Cycle Score [1] |
Spatial Distribution Score [1] |
Overall Score [1] |
|||
|---|---|---|---|---|---|---|---|---|---|---|---|---|---|---|---|---|
| Benchmark | [-] | 284. | ||||||||||||||
| I62_CRUJRA | [-] | 284. | 284. | 284. | 288. | 285. | -0.159 | 1.82 | 0.307 | 0.631 | 0.808 | 0.967 | 0.997 | 0.842 | ||
| I63_CRUJRA | [-] | 284. | 284. | 284. | 288. | 285. | -0.160 | 1.82 | 0.307 | 0.631 | 0.808 | 0.967 | 0.997 | 0.842 | ||
| I65_CRUJRA | [-] | 284. | 284. | 284. | 288. | 285. | -0.159 | 1.82 | 0.293 | 0.631 | 0.808 | 0.970 | 0.997 | 0.843 | ||
| I67_GSWP3 | [-] | 284. | 284. | 284. | 288. | 286. | 0.405 | 1.66 | 0.197 | 0.642 | 0.861 | 0.975 | 0.990 | 0.866 |
Temporally integrated period mean