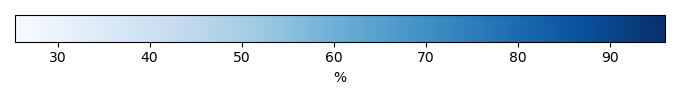
Mean State
Download Data |
Period Mean (original grids) [%] |
Model Period Mean (intersection) [%] |
Benchmark Period Mean (intersection) [%] |
Model Period Mean (complement) [%] |
Benchmark Period Mean (complement) [%] |
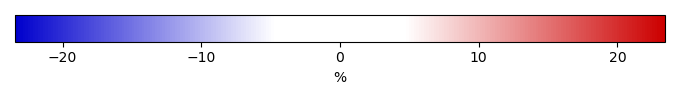
Bias [%] |
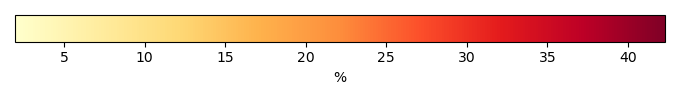
RMSE [%] |
Phase Shift [months] |
Bias Score [1] |
RMSE Score [1] |
Seasonal Cycle Score [1] |
Spatial Distribution Score [1] |
Overall Score [1] |
|||
|---|---|---|---|---|---|---|---|---|---|---|---|---|---|---|---|---|
| Benchmark | [-] | 60.2 | ||||||||||||||
| I62_CRUJRA | [-] | 76.6 | 76.5 | 58.7 | 89.5 | 18.2 | 19.3 | 1.57 | 0.0496 | 0.595 | 0.762 | 0.980 | 0.596 | |||
| I63_CRUJRA | [-] | 76.6 | 76.5 | 58.7 | 89.5 | 18.2 | 19.3 | 1.57 | 0.0496 | 0.595 | 0.762 | 0.980 | 0.596 | |||
| I65_CRUJRA | [-] | 76.7 | 76.7 | 58.7 | 89.5 | 18.4 | 19.5 | 1.57 | 0.0517 | 0.583 | 0.762 | 0.974 | 0.591 | |||
| I67_GSWP3 | [-] | 68.4 | 68.5 | 59.7 | 93.4 | 9.80 | 15.8 | 2.30 | 0.167 | 0.219 | 0.643 | 0.923 | 0.434 |
Download Data |
Period Mean (original grids) [%] |
Model Period Mean (intersection) [%] |
Benchmark Period Mean (intersection) [%] |
Model Period Mean (complement) [%] |
Benchmark Period Mean (complement) [%] |
Bias [%] |
RMSE [%] |
Phase Shift [months] |
Bias Score [1] |
RMSE Score [1] |
Seasonal Cycle Score [1] |
Spatial Distribution Score [1] |
Overall Score [1] |
|||
|---|---|---|---|---|---|---|---|---|---|---|---|---|---|---|---|---|
| Benchmark | [-] | 41.4 | ||||||||||||||
| I62_CRUJRA | [-] | 54.2 | 53.8 | 40.8 | 87.5 | 13.2 | 14.2 | 0.250 | 0.353 | 0.753 | 0.975 | 0.993 | 0.765 | |||
| I63_CRUJRA | [-] | 54.2 | 53.8 | 40.8 | 87.5 | 13.2 | 14.2 | 0.250 | 0.353 | 0.753 | 0.975 | 0.993 | 0.765 | |||
| I65_CRUJRA | [-] | 54.1 | 53.6 | 40.8 | 87.5 | 13.0 | 14.1 | 0.247 | 0.357 | 0.740 | 0.975 | 0.993 | 0.761 | |||
| I67_GSWP3 | [-] | 51.0 | 50.5 | 41.3 | 91.3 | 9.49 | 14.8 | 0.546 | 0.454 | 0.464 | 0.946 | 0.992 | 0.664 |
Download Data |
Period Mean (original grids) [%] |
Model Period Mean (intersection) [%] |
Benchmark Period Mean (intersection) [%] |
Model Period Mean (complement) [%] |
Benchmark Period Mean (complement) [%] |
Bias [%] |
RMSE [%] |
Phase Shift [months] |
Bias Score [1] |
RMSE Score [1] |
Seasonal Cycle Score [1] |
Spatial Distribution Score [1] |
Overall Score [1] |
|||
|---|---|---|---|---|---|---|---|---|---|---|---|---|---|---|---|---|
| Benchmark | [-] | 56.5 | ||||||||||||||
| I62_CRUJRA | [-] | 63.8 | 63.7 | 55.0 | 88.1 | 9.86 | 12.1 | 1.08 | 0.221 | 0.696 | 0.853 | 0.975 | 0.688 | |||
| I63_CRUJRA | [-] | 63.8 | 63.7 | 55.0 | 88.1 | 9.86 | 12.2 | 1.09 | 0.221 | 0.696 | 0.853 | 0.975 | 0.688 | |||
| I65_CRUJRA | [-] | 63.7 | 63.6 | 55.0 | 88.1 | 9.87 | 12.1 | 1.11 | 0.226 | 0.687 | 0.848 | 0.979 | 0.685 | |||
| I67_GSWP3 | [-] | 61.2 | 61.1 | 56.0 | 93.7 | 6.46 | 13.4 | 1.39 | 0.251 | 0.364 | 0.804 | 0.943 | 0.545 |
Download Data |
Period Mean (original grids) [%] |
Model Period Mean (intersection) [%] |
Benchmark Period Mean (intersection) [%] |
Model Period Mean (complement) [%] |
Benchmark Period Mean (complement) [%] |
Bias [%] |
RMSE [%] |
Phase Shift [months] |
Bias Score [1] |
RMSE Score [1] |
Seasonal Cycle Score [1] |
Spatial Distribution Score [1] |
Overall Score [1] |
|||
|---|---|---|---|---|---|---|---|---|---|---|---|---|---|---|---|---|
| Benchmark | [-] | 74.9 | ||||||||||||||
| I62_CRUJRA | [-] | 83.3 | 83.3 | 73.4 | 92.8 | 10.3 | 17.0 | 2.63 | 0.562 | 0.548 | 0.583 | 0.274 | 0.503 | |||
| I63_CRUJRA | [-] | 83.4 | 83.3 | 73.4 | 92.8 | 10.3 | 17.0 | 2.66 | 0.562 | 0.547 | 0.576 | 0.281 | 0.503 | |||
| I65_CRUJRA | [-] | 83.6 | 83.6 | 73.4 | 92.8 | 10.6 | 17.0 | 2.58 | 0.557 | 0.555 | 0.590 | 0.274 | 0.506 | |||
| I67_GSWP3 | [-] | 88.1 | 88.1 | 74.5 | 95.0 | 14.0 | 19.4 | 2.48 | 0.443 | 0.562 | 0.607 | 0.129 | 0.461 |
Download Data |
Period Mean (original grids) [%] |
Model Period Mean (intersection) [%] |
Benchmark Period Mean (intersection) [%] |
Model Period Mean (complement) [%] |
Benchmark Period Mean (complement) [%] |
Bias [%] |
RMSE [%] |
Phase Shift [months] |
Bias Score [1] |
RMSE Score [1] |
Seasonal Cycle Score [1] |
Spatial Distribution Score [1] |
Overall Score [1] |
|||
|---|---|---|---|---|---|---|---|---|---|---|---|---|---|---|---|---|
| Benchmark | [-] | 73.7 | ||||||||||||||
| I62_CRUJRA | [-] | 85.5 | 85.6 | 69.7 | 87.3 | 15.1 | 19.6 | 2.22 | 0.00255 | 0.516 | 0.650 | 0.319 | 0.401 | |||
| I63_CRUJRA | [-] | 85.5 | 85.6 | 69.7 | 87.3 | 15.1 | 19.6 | 2.22 | 0.00255 | 0.516 | 0.650 | 0.319 | 0.401 | |||
| I65_CRUJRA | [-] | 85.7 | 85.8 | 69.7 | 87.3 | 15.4 | 19.8 | 2.20 | 0.00251 | 0.512 | 0.654 | 0.322 | 0.401 | |||
| I67_GSWP3 | [-] | 85.2 | 85.2 | 72.6 | 92.9 | 11.7 | 18.5 | 2.24 | 0.00185 | 0.402 | 0.658 | 0.172 | 0.327 |
Download Data |
Period Mean (original grids) [%] |
Model Period Mean (intersection) [%] |
Benchmark Period Mean (intersection) [%] |
Model Period Mean (complement) [%] |
Benchmark Period Mean (complement) [%] |
Bias [%] |
RMSE [%] |
Phase Shift [months] |
Bias Score [1] |
RMSE Score [1] |
Seasonal Cycle Score [1] |
Spatial Distribution Score [1] |
Overall Score [1] |
|||
|---|---|---|---|---|---|---|---|---|---|---|---|---|---|---|---|---|
| Benchmark | [-] | 72.2 | ||||||||||||||
| I62_CRUJRA | [-] | 80.9 | 80.9 | 72.0 | 89.5 | 8.91 | 13.8 | 1.70 | 0.594 | 0.566 | 0.760 | 0.595 | 0.616 | |||
| I63_CRUJRA | [-] | 80.8 | 80.9 | 72.0 | 89.5 | 8.88 | 14.0 | 1.75 | 0.595 | 0.560 | 0.751 | 0.602 | 0.614 | |||
| I65_CRUJRA | [-] | 80.4 | 80.4 | 72.0 | 89.5 | 8.43 | 13.5 | 1.76 | 0.612 | 0.566 | 0.751 | 0.583 | 0.615 | |||
| I67_GSWP3 | [-] | 82.3 | 82.4 | 72.2 | 95.0 | 10.3 | 14.6 | 1.99 | 0.552 | 0.585 | 0.713 | 0.421 | 0.571 |
Download Data |
Period Mean (original grids) [%] |
Model Period Mean (intersection) [%] |
Benchmark Period Mean (intersection) [%] |
Model Period Mean (complement) [%] |
Benchmark Period Mean (complement) [%] |
Bias [%] |
RMSE [%] |
Phase Shift [months] |
Bias Score [1] |
RMSE Score [1] |
Seasonal Cycle Score [1] |
Spatial Distribution Score [1] |
Overall Score [1] |
|||
|---|---|---|---|---|---|---|---|---|---|---|---|---|---|---|---|---|
| Benchmark | [-] | 53.2 | ||||||||||||||
| I62_CRUJRA | [-] | 64.5 | 64.7 | 52.6 | 87.6 | 12.5 | 16.8 | 1.62 | 0.425 | 0.584 | 0.756 | 0.721 | 0.614 | |||
| I63_CRUJRA | [-] | 64.5 | 64.6 | 52.6 | 87.6 | 12.5 | 16.8 | 1.64 | 0.425 | 0.584 | 0.752 | 0.724 | 0.614 | |||
| I65_CRUJRA | [-] | 64.5 | 64.6 | 52.6 | 87.6 | 12.5 | 16.8 | 1.62 | 0.425 | 0.583 | 0.755 | 0.732 | 0.616 | |||
| I67_GSWP3 | [-] | 65.2 | 65.4 | 53.1 | 94.2 | 13.2 | 20.1 | 1.83 | 0.426 | 0.542 | 0.723 | 0.837 | 0.614 |
Download Data |
Period Mean (original grids) [%] |
Model Period Mean (intersection) [%] |
Benchmark Period Mean (intersection) [%] |
Model Period Mean (complement) [%] |
Benchmark Period Mean (complement) [%] |
Bias [%] |
RMSE [%] |
Phase Shift [months] |
Bias Score [1] |
RMSE Score [1] |
Seasonal Cycle Score [1] |
Spatial Distribution Score [1] |
Overall Score [1] |
|||
|---|---|---|---|---|---|---|---|---|---|---|---|---|---|---|---|---|
| Benchmark | [-] | 55.1 | ||||||||||||||
| I62_CRUJRA | [-] | 66.4 | 66.4 | 52.6 | 88.5 | 15.4 | 18.3 | 1.17 | 0.128 | 0.663 | 0.822 | 0.915 | 0.638 | |||
| I63_CRUJRA | [-] | 66.4 | 66.4 | 52.6 | 88.5 | 15.4 | 18.3 | 1.17 | 0.128 | 0.663 | 0.822 | 0.915 | 0.638 | |||
| I65_CRUJRA | [-] | 66.6 | 66.6 | 52.6 | 88.5 | 15.6 | 18.5 | 1.17 | 0.127 | 0.656 | 0.822 | 0.925 | 0.637 | |||
| I67_GSWP3 | [-] | 62.4 | 62.2 | 54.6 | 92.8 | 10.5 | 17.6 | 1.41 | 0.232 | 0.376 | 0.786 | 0.970 | 0.548 |
Download Data |
Period Mean (original grids) [%] |
Model Period Mean (intersection) [%] |
Benchmark Period Mean (intersection) [%] |
Model Period Mean (complement) [%] |
Benchmark Period Mean (complement) [%] |
Bias [%] |
RMSE [%] |
Phase Shift [months] |
Bias Score [1] |
RMSE Score [1] |
Seasonal Cycle Score [1] |
Spatial Distribution Score [1] |
Overall Score [1] |
|||
|---|---|---|---|---|---|---|---|---|---|---|---|---|---|---|---|---|
| Benchmark | [-] | 79.1 | ||||||||||||||
| I62_CRUJRA | [-] | 86.3 | 86.3 | 78.5 | 93.3 | 7.99 | 13.0 | 2.66 | 0.619 | 0.570 | 0.556 | 0.373 | 0.537 | |||
| I63_CRUJRA | [-] | 86.5 | 86.4 | 78.5 | 93.3 | 8.14 | 13.2 | 2.67 | 0.611 | 0.567 | 0.553 | 0.404 | 0.540 | |||
| I65_CRUJRA | [-] | 86.6 | 86.5 | 78.5 | 93.3 | 8.24 | 13.0 | 2.62 | 0.608 | 0.577 | 0.564 | 0.376 | 0.541 | |||
| I67_GSWP3 | [-] | 88.6 | 88.6 | 79.0 | 94.8 | 9.98 | 14.1 | 3.16 | 0.550 | 0.596 | 0.467 | 0.272 | 0.496 |
Download Data |
Period Mean (original grids) [%] |
Model Period Mean (intersection) [%] |
Benchmark Period Mean (intersection) [%] |
Model Period Mean (complement) [%] |
Benchmark Period Mean (complement) [%] |
Bias [%] |
RMSE [%] |
Phase Shift [months] |
Bias Score [1] |
RMSE Score [1] |
Seasonal Cycle Score [1] |
Spatial Distribution Score [1] |
Overall Score [1] |
|||
|---|---|---|---|---|---|---|---|---|---|---|---|---|---|---|---|---|
| Benchmark | [-] | 47.0 | ||||||||||||||
| I62_CRUJRA | [-] | 49.4 | 49.3 | 44.0 | 84.6 | 7.30 | 10.9 | 0.782 | 0.297 | 0.694 | 0.872 | 0.930 | 0.697 | |||
| I63_CRUJRA | [-] | 49.4 | 49.3 | 44.0 | 84.6 | 7.30 | 10.9 | 0.783 | 0.297 | 0.694 | 0.871 | 0.930 | 0.697 | |||
| I65_CRUJRA | [-] | 49.4 | 49.3 | 44.0 | 84.6 | 7.30 | 10.9 | 0.776 | 0.298 | 0.686 | 0.872 | 0.932 | 0.695 | |||
| I67_GSWP3 | [-] | 49.9 | 49.9 | 46.4 | 87.2 | 7.15 | 12.1 | 0.731 | 0.295 | 0.627 | 0.886 | 0.934 | 0.674 |
Download Data |
Period Mean (original grids) [%] |
Model Period Mean (intersection) [%] |
Benchmark Period Mean (intersection) [%] |
Model Period Mean (complement) [%] |
Benchmark Period Mean (complement) [%] |
Bias [%] |
RMSE [%] |
Phase Shift [months] |
Bias Score [1] |
RMSE Score [1] |
Seasonal Cycle Score [1] |
Spatial Distribution Score [1] |
Overall Score [1] |
|||
|---|---|---|---|---|---|---|---|---|---|---|---|---|---|---|---|---|
| Benchmark | [-] | 73.2 | ||||||||||||||
| I62_CRUJRA | [-] | 78.6 | 78.6 | 71.9 | 87.8 | 6.56 | 11.2 | 0.643 | 0.436 | 0.629 | 0.938 | 0.690 | 0.664 | |||
| I63_CRUJRA | [-] | 78.6 | 78.6 | 71.9 | 87.8 | 6.56 | 11.2 | 0.652 | 0.436 | 0.627 | 0.937 | 0.691 | 0.663 | |||
| I65_CRUJRA | [-] | 78.4 | 78.4 | 71.9 | 87.8 | 6.41 | 11.1 | 0.657 | 0.442 | 0.630 | 0.936 | 0.677 | 0.663 | |||
| I67_GSWP3 | [-] | 77.9 | 77.9 | 73.1 | 89.2 | 4.68 | 10.9 | 0.951 | 0.448 | 0.644 | 0.912 | 0.854 | 0.701 |
Download Data |
Period Mean (original grids) [%] |
Model Period Mean (intersection) [%] |
Benchmark Period Mean (intersection) [%] |
Model Period Mean (complement) [%] |
Benchmark Period Mean (complement) [%] |
Bias [%] |
RMSE [%] |
Phase Shift [months] |
Bias Score [1] |
RMSE Score [1] |
Seasonal Cycle Score [1] |
Spatial Distribution Score [1] |
Overall Score [1] |
|||
|---|---|---|---|---|---|---|---|---|---|---|---|---|---|---|---|---|
| Benchmark | [-] | 62.5 | ||||||||||||||
| I62_CRUJRA | [-] | 69.8 | 69.8 | 61.1 | 88.5 | 9.33 | 14.5 | 1.58 | 0.298 | 0.606 | 0.757 | 0.842 | 0.622 | |||
| I63_CRUJRA | [-] | 69.8 | 69.8 | 61.1 | 88.5 | 9.34 | 14.5 | 1.59 | 0.299 | 0.605 | 0.755 | 0.843 | 0.621 | |||
| I65_CRUJRA | [-] | 69.8 | 69.8 | 61.1 | 88.5 | 9.36 | 14.6 | 1.58 | 0.300 | 0.602 | 0.756 | 0.844 | 0.621 | |||
| I67_GSWP3 | [-] | 69.7 | 69.7 | 62.2 | 92.3 | 8.64 | 14.4 | 1.63 | 0.329 | 0.489 | 0.763 | 0.952 | 0.604 |
Download Data |
Period Mean (original grids) [%] |
Model Period Mean (intersection) [%] |
Benchmark Period Mean (intersection) [%] |
Model Period Mean (complement) [%] |
Benchmark Period Mean (complement) [%] |
Bias [%] |
RMSE [%] |
Phase Shift [months] |
Bias Score [1] |
RMSE Score [1] |
Seasonal Cycle Score [1] |
Spatial Distribution Score [1] |
Overall Score [1] |
|||
|---|---|---|---|---|---|---|---|---|---|---|---|---|---|---|---|---|
| Benchmark | [-] | 37.5 | ||||||||||||||
| I62_CRUJRA | [-] | 48.5 | 48.6 | 35.6 | 86.3 | 14.0 | 17.1 | 0.777 | 0.189 | 0.578 | 0.892 | 0.895 | 0.626 | |||
| I63_CRUJRA | [-] | 48.5 | 48.5 | 35.6 | 86.3 | 14.0 | 17.1 | 0.780 | 0.189 | 0.578 | 0.892 | 0.895 | 0.626 | |||
| I65_CRUJRA | [-] | 48.5 | 48.6 | 35.6 | 86.3 | 14.0 | 17.1 | 0.777 | 0.188 | 0.577 | 0.892 | 0.895 | 0.626 | |||
| I67_GSWP3 | [-] | 40.2 | 40.3 | 37.2 | 92.2 | 5.07 | 13.7 | 0.723 | 0.324 | 0.434 | 0.913 | 0.820 | 0.585 |
Download Data |
Period Mean (original grids) [%] |
Model Period Mean (intersection) [%] |
Benchmark Period Mean (intersection) [%] |
Model Period Mean (complement) [%] |
Benchmark Period Mean (complement) [%] |
Bias [%] |
RMSE [%] |
Phase Shift [months] |
Bias Score [1] |
RMSE Score [1] |
Seasonal Cycle Score [1] |
Spatial Distribution Score [1] |
Overall Score [1] |
|||
|---|---|---|---|---|---|---|---|---|---|---|---|---|---|---|---|---|
| Benchmark | [-] | 84.5 | ||||||||||||||
| I62_CRUJRA | [-] | 79.1 | 79.0 | 84.0 | 92.8 | -4.47 | 12.7 | 2.73 | 0.529 | 0.464 | 0.558 | 0.746 | 0.552 | |||
| I63_CRUJRA | [-] | 79.3 | 79.2 | 84.0 | 92.8 | -4.28 | 12.6 | 2.77 | 0.536 | 0.465 | 0.550 | 0.748 | 0.553 | |||
| I65_CRUJRA | [-] | 79.0 | 79.0 | 84.0 | 92.8 | -4.50 | 12.6 | 2.68 | 0.528 | 0.469 | 0.566 | 0.764 | 0.559 | |||
| I67_GSWP3 | [-] | 88.6 | 88.6 | 84.3 | 95.0 | 4.91 | 10.3 | 2.32 | 0.581 | 0.577 | 0.654 | 0.466 | 0.571 |
Download Data |
Period Mean (original grids) [%] |
Model Period Mean (intersection) [%] |
Benchmark Period Mean (intersection) [%] |
Model Period Mean (complement) [%] |
Benchmark Period Mean (complement) [%] |
Bias [%] |
RMSE [%] |
Phase Shift [months] |
Bias Score [1] |
RMSE Score [1] |
Seasonal Cycle Score [1] |
Spatial Distribution Score [1] |
Overall Score [1] |
|||
|---|---|---|---|---|---|---|---|---|---|---|---|---|---|---|---|---|
| Benchmark | [-] | 62.2 | ||||||||||||||
| I62_CRUJRA | [-] | 65.5 | 65.5 | 56.9 | 88.3 | 11.1 | 16.4 | 1.71 | 0.114 | 0.576 | 0.732 | 0.920 | 0.583 | |||
| I63_CRUJRA | [-] | 65.5 | 65.5 | 56.9 | 88.3 | 11.1 | 16.4 | 1.71 | 0.114 | 0.576 | 0.732 | 0.920 | 0.583 | |||
| I65_CRUJRA | [-] | 65.8 | 65.8 | 56.9 | 88.3 | 11.5 | 16.7 | 1.69 | 0.112 | 0.574 | 0.736 | 0.928 | 0.585 | |||
| I67_GSWP3 | [-] | 66.9 | 66.9 | 61.2 | 90.6 | 8.21 | 17.6 | 1.93 | 0.0900 | 0.443 | 0.701 | 0.804 | 0.496 |
Download Data |
Period Mean (original grids) [%] |
Model Period Mean (intersection) [%] |
Benchmark Period Mean (intersection) [%] |
Model Period Mean (complement) [%] |
Benchmark Period Mean (complement) [%] |
Bias [%] |
RMSE [%] |
Phase Shift [months] |
Bias Score [1] |
RMSE Score [1] |
Seasonal Cycle Score [1] |
Spatial Distribution Score [1] |
Overall Score [1] |
|||
|---|---|---|---|---|---|---|---|---|---|---|---|---|---|---|---|---|
| Benchmark | [-] | 65.3 | ||||||||||||||
| I62_CRUJRA | [-] | 72.8 | 72.9 | 64.1 | 89.2 | 8.99 | 13.6 | 4.47 | 0.339 | 0.406 | 0.207 | 0.504 | 0.372 | |||
| I63_CRUJRA | [-] | 72.8 | 72.9 | 64.1 | 89.2 | 8.99 | 13.6 | 4.53 | 0.339 | 0.405 | 0.194 | 0.504 | 0.369 | |||
| I65_CRUJRA | [-] | 72.9 | 73.0 | 64.1 | 89.2 | 9.14 | 13.8 | 4.52 | 0.336 | 0.403 | 0.197 | 0.508 | 0.369 | |||
| I67_GSWP3 | [-] | 76.6 | 76.7 | 65.1 | 94.7 | 11.5 | 14.7 | 2.03 | 0.206 | 0.552 | 0.709 | 0.567 | 0.518 |
Download Data |
Period Mean (original grids) [%] |
Model Period Mean (intersection) [%] |
Benchmark Period Mean (intersection) [%] |
Model Period Mean (complement) [%] |
Benchmark Period Mean (complement) [%] |
Bias [%] |
RMSE [%] |
Phase Shift [months] |
Bias Score [1] |
RMSE Score [1] |
Seasonal Cycle Score [1] |
Spatial Distribution Score [1] |
Overall Score [1] |
|||
|---|---|---|---|---|---|---|---|---|---|---|---|---|---|---|---|---|
| Benchmark | [-] | 77.2 | ||||||||||||||
| I62_CRUJRA | [-] | 76.5 | 76.6 | 76.8 | 88.6 | -0.0222 | 11.8 | 1.51 | 0.817 | 0.473 | 0.797 | 0.865 | 0.685 | |||
| I63_CRUJRA | [-] | 76.6 | 76.6 | 76.8 | 88.6 | -0.00793 | 12.0 | 1.55 | 0.817 | 0.466 | 0.789 | 0.869 | 0.681 | |||
| I65_CRUJRA | [-] | 75.8 | 75.8 | 76.8 | 88.6 | -0.744 | 12.0 | 1.59 | 0.815 | 0.467 | 0.784 | 0.879 | 0.683 | |||
| I67_GSWP3 | [-] | 82.2 | 82.2 | 77.1 | 95.0 | 5.27 | 7.73 | 1.12 | 0.649 | 0.735 | 0.876 | 0.815 | 0.762 |
Download Data |
Period Mean (original grids) [%] |
Model Period Mean (intersection) [%] |
Benchmark Period Mean (intersection) [%] |
Model Period Mean (complement) [%] |
Benchmark Period Mean (complement) [%] |
Bias [%] |
RMSE [%] |
Phase Shift [months] |
Bias Score [1] |
RMSE Score [1] |
Seasonal Cycle Score [1] |
Spatial Distribution Score [1] |
Overall Score [1] |
|||
|---|---|---|---|---|---|---|---|---|---|---|---|---|---|---|---|---|
| Benchmark | [-] | 51.8 | ||||||||||||||
| I62_CRUJRA | [-] | 56.9 | 57.1 | 51.2 | 88.1 | 6.38 | 9.61 | 0.916 | 0.593 | 0.669 | 0.893 | 0.955 | 0.756 | |||
| I63_CRUJRA | [-] | 56.9 | 57.1 | 51.2 | 88.1 | 6.41 | 9.63 | 0.957 | 0.592 | 0.670 | 0.886 | 0.955 | 0.755 | |||
| I65_CRUJRA | [-] | 56.6 | 56.8 | 51.2 | 88.1 | 6.14 | 9.50 | 0.975 | 0.602 | 0.665 | 0.884 | 0.945 | 0.752 | |||
| I67_GSWP3 | [-] | 64.2 | 64.3 | 51.8 | 94.8 | 12.9 | 15.3 | 0.818 | 0.368 | 0.616 | 0.908 | 0.973 | 0.696 |
Download Data |
Period Mean (original grids) [%] |
Model Period Mean (intersection) [%] |
Benchmark Period Mean (intersection) [%] |
Model Period Mean (complement) [%] |
Benchmark Period Mean (complement) [%] |
Bias [%] |
RMSE [%] |
Phase Shift [months] |
Bias Score [1] |
RMSE Score [1] |
Seasonal Cycle Score [1] |
Spatial Distribution Score [1] |
Overall Score [1] |
|||
|---|---|---|---|---|---|---|---|---|---|---|---|---|---|---|---|---|
| Benchmark | [-] | 64.8 | ||||||||||||||
| I62_CRUJRA | [-] | 86.6 | 86.6 | 64.1 | 89.6 | 22.3 | 23.1 | 0.913 | 0.0107 | 0.695 | 0.883 | 0.982 | 0.653 | |||
| I63_CRUJRA | [-] | 86.6 | 86.6 | 64.1 | 89.6 | 22.3 | 23.1 | 0.913 | 0.0107 | 0.695 | 0.883 | 0.982 | 0.653 | |||
| I65_CRUJRA | [-] | 87.1 | 87.1 | 64.1 | 89.6 | 22.8 | 23.6 | 0.905 | 0.0102 | 0.685 | 0.884 | 0.982 | 0.649 | |||
| I67_GSWP3 | [-] | 80.3 | 80.4 | 64.6 | 91.6 | 15.9 | 18.9 | 1.77 | 0.0535 | 0.223 | 0.752 | 0.990 | 0.448 |
Download Data |
Period Mean (original grids) [%] |
Model Period Mean (intersection) [%] |
Benchmark Period Mean (intersection) [%] |
Model Period Mean (complement) [%] |
Benchmark Period Mean (complement) [%] |
Bias [%] |
RMSE [%] |
Phase Shift [months] |
Bias Score [1] |
RMSE Score [1] |
Seasonal Cycle Score [1] |
Spatial Distribution Score [1] |
Overall Score [1] |
|||
|---|---|---|---|---|---|---|---|---|---|---|---|---|---|---|---|---|
| Benchmark | [-] | 59.3 | ||||||||||||||
| I62_CRUJRA | [-] | 74.1 | 73.9 | 58.3 | 91.4 | 15.9 | 17.2 | 1.05 | 0.0884 | 0.662 | 0.867 | 0.950 | 0.646 | |||
| I63_CRUJRA | [-] | 74.1 | 73.9 | 58.3 | 91.4 | 15.9 | 17.2 | 1.05 | 0.0884 | 0.662 | 0.867 | 0.950 | 0.646 | |||
| I65_CRUJRA | [-] | 74.7 | 74.5 | 58.3 | 91.4 | 16.5 | 17.7 | 1.03 | 0.0855 | 0.641 | 0.870 | 0.970 | 0.642 | |||
| I67_GSWP3 | [-] | 72.0 | 71.9 | 58.9 | 93.4 | 13.4 | 17.2 | 1.33 | 0.187 | 0.417 | 0.835 | 0.986 | 0.568 |
Download Data |
Period Mean (original grids) [%] |
Model Period Mean (intersection) [%] |
Benchmark Period Mean (intersection) [%] |
Model Period Mean (complement) [%] |
Benchmark Period Mean (complement) [%] |
Bias [%] |
RMSE [%] |
Phase Shift [months] |
Bias Score [1] |
RMSE Score [1] |
Seasonal Cycle Score [1] |
Spatial Distribution Score [1] |
Overall Score [1] |
|||
|---|---|---|---|---|---|---|---|---|---|---|---|---|---|---|---|---|
| Benchmark | [-] | 56.9 | ||||||||||||||
| I62_CRUJRA | [-] | 58.3 | 58.4 | 53.3 | 88.9 | 7.16 | 12.7 | 1.12 | 0.319 | 0.666 | 0.852 | 0.858 | 0.672 | |||
| I63_CRUJRA | [-] | 58.3 | 58.4 | 53.3 | 88.9 | 7.17 | 12.7 | 1.12 | 0.319 | 0.666 | 0.852 | 0.858 | 0.672 | |||
| I65_CRUJRA | [-] | 58.3 | 58.4 | 53.3 | 88.9 | 7.17 | 12.7 | 1.14 | 0.319 | 0.666 | 0.850 | 0.857 | 0.672 | |||
| I67_GSWP3 | [-] | 63.4 | 63.6 | 56.3 | 94.5 | 8.48 | 18.4 | 1.28 | 0.238 | 0.532 | 0.822 | 0.873 | 0.600 |
Temporally integrated period mean