Mean State
Download Data |
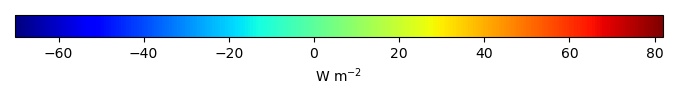
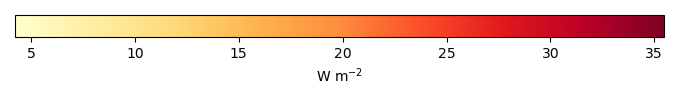
Period Mean (original grids) [W m-2] |
Model Period Mean (intersection) [W m-2] |
Benchmark Period Mean (intersection) [W m-2] |
Model Period Mean (complement) [W m-2] |
Benchmark Period Mean (complement) [W m-2] |
Bias [W m-2] |
RMSE [W m-2] |
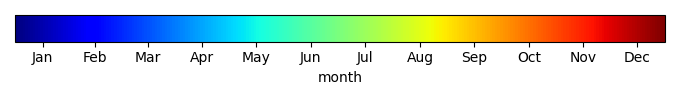
Phase Shift [months] |
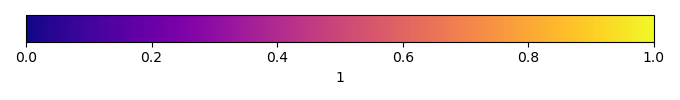
Bias Score [1] |
RMSE Score [1] |
Seasonal Cycle Score [1] |
Spatial Distribution Score [1] |
Overall Score [1] |
|||
|---|---|---|---|---|---|---|---|---|---|---|---|---|---|---|---|---|
| Benchmark | [-] | 48.0 | ||||||||||||||
| I62_CRUJRA | [-] | 39.8 | 39.4 | 48.0 | 45.1 | 45.5 | -8.06 | 20.0 | 2.62 | 0.376 | 0.500 | 0.595 | 0.815 | 0.558 | ||
| I63_CRUJRA | [-] | 39.8 | 39.5 | 48.0 | 45.1 | 45.5 | -8.05 | 20.0 | 2.62 | 0.376 | 0.500 | 0.595 | 0.815 | 0.557 | ||
| I65_CRUJRA | [-] | 37.6 | 37.3 | 48.0 | 42.7 | 45.5 | -10.1 | 21.8 | 2.56 | 0.332 | 0.484 | 0.608 | 0.775 | 0.537 | ||
| I67_GSWP3 | [-] | 35.7 | 35.6 | 47.8 | 41.1 | -11.5 | 17.1 | 1.67 | 0.359 | 0.683 | 0.762 | 0.932 | 0.683 |
Download Data |
Period Mean (original grids) [W m-2] |
Model Period Mean (intersection) [W m-2] |
Benchmark Period Mean (intersection) [W m-2] |
Model Period Mean (complement) [W m-2] |
Benchmark Period Mean (complement) [W m-2] |
Bias [W m-2] |
RMSE [W m-2] |
Phase Shift [months] |
Bias Score [1] |
RMSE Score [1] |
Seasonal Cycle Score [1] |
Spatial Distribution Score [1] |
Overall Score [1] |
|||
|---|---|---|---|---|---|---|---|---|---|---|---|---|---|---|---|---|
| Benchmark | [-] | 55.5 | ||||||||||||||
| I62_CRUJRA | [-] | 50.7 | 50.9 | 55.5 | 59.5 | 73.6 | -4.74 | 23.6 | 1.60 | 0.447 | 0.244 | 0.784 | 0.769 | 0.497 | ||
| I63_CRUJRA | [-] | 50.7 | 50.9 | 55.5 | 59.5 | 73.6 | -4.74 | 23.6 | 1.60 | 0.447 | 0.244 | 0.784 | 0.769 | 0.497 | ||
| I65_CRUJRA | [-] | 50.9 | 51.1 | 55.5 | 59.7 | 73.6 | -4.53 | 22.8 | 1.53 | 0.441 | 0.278 | 0.796 | 0.766 | 0.512 | ||
| I67_GSWP3 | [-] | 49.1 | 49.1 | 55.4 | 52.0 | -6.28 | 17.8 | 0.908 | 0.478 | 0.445 | 0.908 | 0.992 | 0.653 |
Download Data |
Period Mean (original grids) [W m-2] |
Model Period Mean (intersection) [W m-2] |
Benchmark Period Mean (intersection) [W m-2] |
Model Period Mean (complement) [W m-2] |
Benchmark Period Mean (complement) [W m-2] |
Bias [W m-2] |
RMSE [W m-2] |
Phase Shift [months] |
Bias Score [1] |
RMSE Score [1] |
Seasonal Cycle Score [1] |
Spatial Distribution Score [1] |
Overall Score [1] |
|||
|---|---|---|---|---|---|---|---|---|---|---|---|---|---|---|---|---|
| Benchmark | [-] | 55.7 | ||||||||||||||
| I62_CRUJRA | [-] | 55.6 | 55.7 | 55.6 | 55.4 | 71.8 | 0.380 | 19.7 | 1.53 | 0.432 | 0.435 | 0.793 | 0.657 | 0.550 | ||
| I63_CRUJRA | [-] | 55.6 | 55.7 | 55.6 | 55.4 | 71.8 | 0.382 | 19.7 | 1.53 | 0.432 | 0.434 | 0.793 | 0.657 | 0.550 | ||
| I65_CRUJRA | [-] | 55.8 | 55.9 | 55.6 | 54.9 | 71.8 | 0.657 | 19.3 | 1.53 | 0.446 | 0.446 | 0.791 | 0.671 | 0.560 | ||
| I67_GSWP3 | [-] | 54.4 | 54.4 | 55.4 | 55.0 | 68.6 | -0.515 | 14.5 | 0.799 | 0.618 | 0.547 | 0.911 | 0.904 | 0.705 |
Download Data |
Period Mean (original grids) [W m-2] |
Model Period Mean (intersection) [W m-2] |
Benchmark Period Mean (intersection) [W m-2] |
Model Period Mean (complement) [W m-2] |
Benchmark Period Mean (complement) [W m-2] |
Bias [W m-2] |
RMSE [W m-2] |
Phase Shift [months] |
Bias Score [1] |
RMSE Score [1] |
Seasonal Cycle Score [1] |
Spatial Distribution Score [1] |
Overall Score [1] |
|||
|---|---|---|---|---|---|---|---|---|---|---|---|---|---|---|---|---|
| Benchmark | [-] | 18.8 | ||||||||||||||
| I62_CRUJRA | [-] | 8.97 | 9.19 | 18.8 | 6.05 | 21.5 | -9.72 | 13.4 | 0.338 | 0.432 | 0.658 | 0.977 | 0.937 | 0.733 | ||
| I63_CRUJRA | [-] | 8.27 | 8.51 | 18.8 | 5.07 | 21.5 | -10.4 | 14.4 | 0.336 | 0.395 | 0.620 | 0.977 | 0.921 | 0.707 | ||
| I65_CRUJRA | [-] | 9.34 | 9.58 | 18.8 | 6.16 | 21.5 | -9.37 | 13.6 | 0.321 | 0.452 | 0.629 | 0.979 | 0.929 | 0.724 | ||
| I67_GSWP3 | [-] | 11.5 | 11.7 | 18.7 | 9.34 | -7.12 | 12.6 | 0.593 | 0.544 | 0.619 | 0.945 | 0.808 | 0.707 |
Download Data |
Period Mean (original grids) [W m-2] |
Model Period Mean (intersection) [W m-2] |
Benchmark Period Mean (intersection) [W m-2] |
Model Period Mean (complement) [W m-2] |
Benchmark Period Mean (complement) [W m-2] |
Bias [W m-2] |
RMSE [W m-2] |
Phase Shift [months] |
Bias Score [1] |
RMSE Score [1] |
Seasonal Cycle Score [1] |
Spatial Distribution Score [1] |
Overall Score [1] |
|||
|---|---|---|---|---|---|---|---|---|---|---|---|---|---|---|---|---|
| Benchmark | [-] | 33.4 | ||||||||||||||
| I62_CRUJRA | [-] | 34.0 | 32.8 | 32.6 | 36.9 | 54.8 | 1.04 | 12.6 | 2.20 | 0.599 | 0.697 | 0.656 | 0.962 | 0.722 | ||
| I63_CRUJRA | [-] | 34.0 | 32.8 | 32.6 | 36.9 | 54.8 | 1.04 | 12.6 | 2.21 | 0.599 | 0.697 | 0.654 | 0.962 | 0.722 | ||
| I65_CRUJRA | [-] | 30.0 | 28.8 | 32.6 | 33.1 | 54.8 | -3.04 | 12.7 | 2.37 | 0.590 | 0.699 | 0.624 | 0.947 | 0.712 | ||
| I67_GSWP3 | [-] | 16.7 | 15.0 | 32.7 | 21.2 | -16.1 | 17.0 | 1.47 | 0.317 | 0.830 | 0.763 | 0.935 | 0.735 |
Download Data |
Period Mean (original grids) [W m-2] |
Model Period Mean (intersection) [W m-2] |
Benchmark Period Mean (intersection) [W m-2] |
Model Period Mean (complement) [W m-2] |
Benchmark Period Mean (complement) [W m-2] |
Bias [W m-2] |
RMSE [W m-2] |
Phase Shift [months] |
Bias Score [1] |
RMSE Score [1] |
Seasonal Cycle Score [1] |
Spatial Distribution Score [1] |
Overall Score [1] |
|||
|---|---|---|---|---|---|---|---|---|---|---|---|---|---|---|---|---|
| Benchmark | [-] | 22.2 | ||||||||||||||
| I62_CRUJRA | [-] | 18.8 | 18.8 | 22.2 | 18.0 | 31.7 | -3.43 | 11.2 | 0.589 | 0.648 | 0.611 | 0.946 | 0.844 | 0.732 | ||
| I63_CRUJRA | [-] | 18.5 | 18.5 | 22.2 | 17.7 | 31.7 | -3.69 | 11.3 | 0.714 | 0.640 | 0.605 | 0.933 | 0.842 | 0.725 | ||
| I65_CRUJRA | [-] | 18.9 | 18.8 | 22.2 | 19.3 | 31.7 | -3.40 | 11.7 | 0.620 | 0.638 | 0.587 | 0.943 | 0.844 | 0.720 | ||
| I67_GSWP3 | [-] | 19.8 | 19.8 | 22.3 | 25.3 | -2.50 | 10.5 | 0.595 | 0.629 | 0.640 | 0.950 | 0.673 | 0.706 |
Download Data |
Period Mean (original grids) [W m-2] |
Model Period Mean (intersection) [W m-2] |
Benchmark Period Mean (intersection) [W m-2] |
Model Period Mean (complement) [W m-2] |
Benchmark Period Mean (complement) [W m-2] |
Bias [W m-2] |
RMSE [W m-2] |
Phase Shift [months] |
Bias Score [1] |
RMSE Score [1] |
Seasonal Cycle Score [1] |
Spatial Distribution Score [1] |
Overall Score [1] |
|||
|---|---|---|---|---|---|---|---|---|---|---|---|---|---|---|---|---|
| Benchmark | [-] | 33.2 | ||||||||||||||
| I62_CRUJRA | [-] | 33.8 | 33.9 | 33.2 | 28.2 | 39.3 | 0.699 | 11.7 | 0.921 | 0.554 | 0.591 | 0.901 | 0.948 | 0.717 | ||
| I63_CRUJRA | [-] | 33.6 | 33.7 | 33.2 | 28.2 | 39.3 | 0.533 | 11.7 | 0.930 | 0.559 | 0.590 | 0.900 | 0.948 | 0.717 | ||
| I65_CRUJRA | [-] | 33.7 | 33.8 | 33.2 | 28.0 | 39.3 | 0.602 | 11.7 | 0.930 | 0.560 | 0.591 | 0.899 | 0.949 | 0.718 | ||
| I67_GSWP3 | [-] | 33.6 | 33.7 | 33.2 | 28.3 | 0.533 | 11.8 | 0.939 | 0.548 | 0.588 | 0.892 | 0.818 | 0.687 |
Download Data |
Period Mean (original grids) [W m-2] |
Model Period Mean (intersection) [W m-2] |
Benchmark Period Mean (intersection) [W m-2] |
Model Period Mean (complement) [W m-2] |
Benchmark Period Mean (complement) [W m-2] |
Bias [W m-2] |
RMSE [W m-2] |
Phase Shift [months] |
Bias Score [1] |
RMSE Score [1] |
Seasonal Cycle Score [1] |
Spatial Distribution Score [1] |
Overall Score [1] |
|||
|---|---|---|---|---|---|---|---|---|---|---|---|---|---|---|---|---|
| Benchmark | [-] | 43.4 | ||||||||||||||
| I62_CRUJRA | [-] | 37.3 | 37.2 | 43.4 | 36.6 | 46.9 | -6.38 | 15.6 | 0.780 | 0.543 | 0.531 | 0.925 | 0.912 | 0.688 | ||
| I63_CRUJRA | [-] | 37.2 | 37.2 | 43.4 | 36.6 | 46.9 | -6.40 | 15.6 | 0.779 | 0.543 | 0.531 | 0.925 | 0.911 | 0.688 | ||
| I65_CRUJRA | [-] | 36.3 | 36.3 | 43.4 | 34.4 | 46.9 | -7.35 | 16.0 | 0.756 | 0.516 | 0.535 | 0.928 | 0.884 | 0.680 | ||
| I67_GSWP3 | [-] | 32.0 | 31.7 | 43.2 | 33.4 | -11.5 | 18.2 | 0.717 | 0.351 | 0.538 | 0.927 | 0.982 | 0.667 |
Download Data |
Period Mean (original grids) [W m-2] |
Model Period Mean (intersection) [W m-2] |
Benchmark Period Mean (intersection) [W m-2] |
Model Period Mean (complement) [W m-2] |
Benchmark Period Mean (complement) [W m-2] |
Bias [W m-2] |
RMSE [W m-2] |
Phase Shift [months] |
Bias Score [1] |
RMSE Score [1] |
Seasonal Cycle Score [1] |
Spatial Distribution Score [1] |
Overall Score [1] |
|||
|---|---|---|---|---|---|---|---|---|---|---|---|---|---|---|---|---|
| Benchmark | [-] | 14.4 | ||||||||||||||
| I62_CRUJRA | [-] | 2.87 | 3.36 | 14.4 | -1.05 | 17.0 | -11.2 | 13.8 | 0.443 | 0.350 | 0.695 | 0.970 | 0.326 | 0.607 | ||
| I63_CRUJRA | [-] | 1.96 | 2.46 | 14.4 | -1.94 | 17.0 | -12.1 | 15.0 | 0.524 | 0.310 | 0.659 | 0.965 | 0.286 | 0.576 | ||
| I65_CRUJRA | [-] | 3.00 | 3.50 | 14.4 | -1.15 | 17.0 | -11.1 | 13.9 | 0.479 | 0.355 | 0.682 | 0.968 | 0.317 | 0.601 | ||
| I67_GSWP3 | [-] | 4.48 | 4.85 | 14.4 | 1.42 | -9.61 | 13.9 | 0.670 | 0.407 | 0.659 | 0.946 | 0.345 | 0.603 |
Download Data |
Period Mean (original grids) [W m-2] |
Model Period Mean (intersection) [W m-2] |
Benchmark Period Mean (intersection) [W m-2] |
Model Period Mean (complement) [W m-2] |
Benchmark Period Mean (complement) [W m-2] |
Bias [W m-2] |
RMSE [W m-2] |
Phase Shift [months] |
Bias Score [1] |
RMSE Score [1] |
Seasonal Cycle Score [1] |
Spatial Distribution Score [1] |
Overall Score [1] |
|||
|---|---|---|---|---|---|---|---|---|---|---|---|---|---|---|---|---|
| Benchmark | [-] | 58.2 | ||||||||||||||
| I62_CRUJRA | [-] | 65.7 | 66.4 | 58.2 | 56.1 | 57.0 | 7.41 | 13.3 | 0.532 | 0.452 | 0.675 | 0.958 | 0.894 | 0.731 | ||
| I63_CRUJRA | [-] | 65.7 | 66.4 | 58.2 | 56.1 | 57.0 | 7.41 | 13.3 | 0.531 | 0.453 | 0.675 | 0.959 | 0.895 | 0.731 | ||
| I65_CRUJRA | [-] | 65.7 | 66.4 | 58.2 | 55.9 | 57.0 | 7.42 | 13.4 | 0.558 | 0.442 | 0.675 | 0.955 | 0.885 | 0.726 | ||
| I67_GSWP3 | [-] | 55.7 | 56.4 | 57.8 | 47.4 | -2.26 | 9.86 | 0.592 | 0.600 | 0.714 | 0.950 | 0.904 | 0.776 |
Download Data |
Period Mean (original grids) [W m-2] |
Model Period Mean (intersection) [W m-2] |
Benchmark Period Mean (intersection) [W m-2] |
Model Period Mean (complement) [W m-2] |
Benchmark Period Mean (complement) [W m-2] |
Bias [W m-2] |
RMSE [W m-2] |
Phase Shift [months] |
Bias Score [1] |
RMSE Score [1] |
Seasonal Cycle Score [1] |
Spatial Distribution Score [1] |
Overall Score [1] |
|||
|---|---|---|---|---|---|---|---|---|---|---|---|---|---|---|---|---|
| Benchmark | [-] | 23.9 | ||||||||||||||
| I62_CRUJRA | [-] | 26.9 | 27.1 | 23.8 | 25.1 | 32.6 | 3.44 | 12.6 | 0.691 | 0.503 | 0.535 | 0.924 | 0.967 | 0.693 | ||
| I63_CRUJRA | [-] | 26.8 | 27.0 | 23.8 | 25.1 | 32.6 | 3.32 | 12.5 | 0.707 | 0.506 | 0.537 | 0.923 | 0.964 | 0.693 | ||
| I65_CRUJRA | [-] | 27.0 | 27.1 | 23.8 | 25.7 | 32.6 | 3.49 | 12.6 | 0.706 | 0.510 | 0.529 | 0.924 | 0.974 | 0.693 | ||
| I67_GSWP3 | [-] | 18.9 | 18.3 | 23.8 | 22.9 | 55.1 | -4.60 | 9.76 | 0.757 | 0.554 | 0.686 | 0.924 | 0.948 | 0.760 |
Download Data |
Period Mean (original grids) [W m-2] |
Model Period Mean (intersection) [W m-2] |
Benchmark Period Mean (intersection) [W m-2] |
Model Period Mean (complement) [W m-2] |
Benchmark Period Mean (complement) [W m-2] |
Bias [W m-2] |
RMSE [W m-2] |
Phase Shift [months] |
Bias Score [1] |
RMSE Score [1] |
Seasonal Cycle Score [1] |
Spatial Distribution Score [1] |
Overall Score [1] |
|||
|---|---|---|---|---|---|---|---|---|---|---|---|---|---|---|---|---|
| Benchmark | [-] | 39.1 | ||||||||||||||
| I62_CRUJRA | [-] | 27.0 | 36.3 | 39.0 | -23.7 | 51.2 | -2.69 | 14.3 | 1.03 | 0.493 | 0.583 | 0.876 | 0.918 | 0.691 | ||
| I63_CRUJRA | [-] | 26.8 | 36.1 | 39.0 | -23.8 | 51.2 | -2.85 | 14.4 | 1.04 | 0.489 | 0.580 | 0.874 | 0.912 | 0.687 | ||
| I65_CRUJRA | [-] | 26.6 | 35.8 | 39.0 | -23.9 | 51.2 | -3.15 | 14.5 | 1.03 | 0.482 | 0.582 | 0.875 | 0.914 | 0.687 | ||
| I67_GSWP3 | [-] | 27.2 | 33.4 | 39.0 | -6.10 | 57.0 | -5.54 | 13.4 | 0.892 | 0.488 | 0.640 | 0.900 | 0.949 | 0.723 |
Download Data |
Period Mean (original grids) [W m-2] |
Model Period Mean (intersection) [W m-2] |
Benchmark Period Mean (intersection) [W m-2] |
Model Period Mean (complement) [W m-2] |
Benchmark Period Mean (complement) [W m-2] |
Bias [W m-2] |
RMSE [W m-2] |
Phase Shift [months] |
Bias Score [1] |
RMSE Score [1] |
Seasonal Cycle Score [1] |
Spatial Distribution Score [1] |
Overall Score [1] |
|||
|---|---|---|---|---|---|---|---|---|---|---|---|---|---|---|---|---|
| Benchmark | [-] | 49.8 | ||||||||||||||
| I62_CRUJRA | [-] | 42.4 | 42.1 | 49.8 | 53.0 | 73.8 | -7.03 | 12.9 | 1.12 | 0.407 | 0.670 | 0.859 | 0.910 | 0.703 | ||
| I63_CRUJRA | [-] | 42.4 | 42.1 | 49.8 | 53.0 | 73.8 | -7.04 | 12.9 | 1.12 | 0.407 | 0.670 | 0.859 | 0.910 | 0.703 | ||
| I65_CRUJRA | [-] | 42.4 | 42.1 | 49.8 | 52.9 | 73.8 | -7.06 | 12.9 | 1.12 | 0.408 | 0.670 | 0.858 | 0.910 | 0.703 | ||
| I67_GSWP3 | [-] | 38.8 | 38.4 | 49.8 | 51.8 | 83.8 | -10.8 | 14.7 | 1.27 | 0.282 | 0.724 | 0.843 | 0.889 | 0.692 |
Download Data |
Period Mean (original grids) [W m-2] |
Model Period Mean (intersection) [W m-2] |
Benchmark Period Mean (intersection) [W m-2] |
Model Period Mean (complement) [W m-2] |
Benchmark Period Mean (complement) [W m-2] |
Bias [W m-2] |
RMSE [W m-2] |
Phase Shift [months] |
Bias Score [1] |
RMSE Score [1] |
Seasonal Cycle Score [1] |
Spatial Distribution Score [1] |
Overall Score [1] |
|||
|---|---|---|---|---|---|---|---|---|---|---|---|---|---|---|---|---|
| Benchmark | [-] | 19.1 | ||||||||||||||
| I62_CRUJRA | [-] | 7.99 | 8.82 | 19.1 | 2.59 | 20.7 | -10.8 | 15.4 | 0.394 | 0.368 | 0.590 | 0.970 | 0.469 | 0.597 | ||
| I63_CRUJRA | [-] | 6.79 | 7.65 | 19.1 | 1.27 | 20.7 | -12.0 | 16.5 | 0.480 | 0.327 | 0.575 | 0.961 | 0.416 | 0.570 | ||
| I65_CRUJRA | [-] | 7.80 | 8.60 | 19.1 | 2.63 | 20.7 | -11.0 | 16.0 | 0.419 | 0.367 | 0.559 | 0.967 | 0.473 | 0.585 | ||
| I67_GSWP3 | [-] | 9.40 | 9.72 | 19.2 | 7.36 | -9.62 | 14.1 | 0.451 | 0.408 | 0.611 | 0.961 | 0.790 | 0.676 |
Download Data |
Period Mean (original grids) [W m-2] |
Model Period Mean (intersection) [W m-2] |
Benchmark Period Mean (intersection) [W m-2] |
Model Period Mean (complement) [W m-2] |
Benchmark Period Mean (complement) [W m-2] |
Bias [W m-2] |
RMSE [W m-2] |
Phase Shift [months] |
Bias Score [1] |
RMSE Score [1] |
Seasonal Cycle Score [1] |
Spatial Distribution Score [1] |
Overall Score [1] |
|||
|---|---|---|---|---|---|---|---|---|---|---|---|---|---|---|---|---|
| Benchmark | [-] | 53.7 | ||||||||||||||
| I62_CRUJRA | [-] | 47.7 | 47.2 | 53.6 | 50.7 | 62.3 | -5.48 | 15.9 | 0.778 | 0.498 | 0.564 | 0.922 | 0.982 | 0.706 | ||
| I63_CRUJRA | [-] | 47.7 | 47.2 | 53.6 | 50.7 | 62.3 | -5.47 | 15.9 | 0.778 | 0.498 | 0.564 | 0.922 | 0.982 | 0.706 | ||
| I65_CRUJRA | [-] | 46.6 | 46.1 | 53.6 | 49.2 | 62.3 | -6.58 | 16.1 | 0.740 | 0.479 | 0.574 | 0.927 | 0.986 | 0.708 | ||
| I67_GSWP3 | [-] | 43.9 | 44.0 | 53.8 | 44.5 | -9.13 | 16.4 | 0.572 | 0.438 | 0.629 | 0.943 | 0.966 | 0.721 |
Download Data |
Period Mean (original grids) [W m-2] |
Model Period Mean (intersection) [W m-2] |
Benchmark Period Mean (intersection) [W m-2] |
Model Period Mean (complement) [W m-2] |
Benchmark Period Mean (complement) [W m-2] |
Bias [W m-2] |
RMSE [W m-2] |
Phase Shift [months] |
Bias Score [1] |
RMSE Score [1] |
Seasonal Cycle Score [1] |
Spatial Distribution Score [1] |
Overall Score [1] |
|||
|---|---|---|---|---|---|---|---|---|---|---|---|---|---|---|---|---|
| Benchmark | [-] | 29.7 | ||||||||||||||
| I62_CRUJRA | [-] | 32.5 | 32.8 | 29.6 | 28.7 | 55.3 | 3.29 | 10.3 | 0.870 | 0.619 | 0.644 | 0.897 | 0.947 | 0.750 | ||
| I63_CRUJRA | [-] | 32.3 | 32.6 | 29.6 | 28.6 | 55.3 | 3.14 | 10.5 | 0.872 | 0.618 | 0.635 | 0.897 | 0.939 | 0.745 | ||
| I65_CRUJRA | [-] | 32.3 | 32.6 | 29.6 | 28.2 | 55.3 | 3.12 | 10.3 | 0.944 | 0.623 | 0.643 | 0.882 | 0.963 | 0.751 | ||
| I67_GSWP3 | [-] | 27.5 | 27.3 | 29.6 | 28.9 | -2.02 | 8.87 | 1.04 | 0.758 | 0.644 | 0.860 | 0.982 | 0.777 |
Download Data |
Period Mean (original grids) [W m-2] |
Model Period Mean (intersection) [W m-2] |
Benchmark Period Mean (intersection) [W m-2] |
Model Period Mean (complement) [W m-2] |
Benchmark Period Mean (complement) [W m-2] |
Bias [W m-2] |
RMSE [W m-2] |
Phase Shift [months] |
Bias Score [1] |
RMSE Score [1] |
Seasonal Cycle Score [1] |
Spatial Distribution Score [1] |
Overall Score [1] |
|||
|---|---|---|---|---|---|---|---|---|---|---|---|---|---|---|---|---|
| Benchmark | [-] | 26.5 | ||||||||||||||
| I62_CRUJRA | [-] | 26.7 | 27.0 | 26.4 | 22.8 | 32.2 | 0.265 | 11.4 | 0.641 | 0.658 | 0.572 | 0.946 | 0.597 | 0.669 | ||
| I63_CRUJRA | [-] | 26.5 | 26.8 | 26.4 | 22.6 | 32.2 | 0.0624 | 11.3 | 0.659 | 0.643 | 0.582 | 0.945 | 0.581 | 0.667 | ||
| I65_CRUJRA | [-] | 26.6 | 26.8 | 26.4 | 23.3 | 32.2 | 0.113 | 11.5 | 0.661 | 0.665 | 0.564 | 0.947 | 0.613 | 0.671 | ||
| I67_GSWP3 | [-] | 21.1 | 21.1 | 26.4 | 20.7 | -5.45 | 11.1 | 0.645 | 0.588 | 0.612 | 0.943 | 0.826 | 0.716 |
Download Data |
Period Mean (original grids) [W m-2] |
Model Period Mean (intersection) [W m-2] |
Benchmark Period Mean (intersection) [W m-2] |
Model Period Mean (complement) [W m-2] |
Benchmark Period Mean (complement) [W m-2] |
Bias [W m-2] |
RMSE [W m-2] |
Phase Shift [months] |
Bias Score [1] |
RMSE Score [1] |
Seasonal Cycle Score [1] |
Spatial Distribution Score [1] |
Overall Score [1] |
|||
|---|---|---|---|---|---|---|---|---|---|---|---|---|---|---|---|---|
| Benchmark | [-] | 41.6 | ||||||||||||||
| I62_CRUJRA | [-] | 39.2 | 39.2 | 41.6 | 47.3 | 49.2 | -2.47 | 10.7 | 0.733 | 0.596 | 0.604 | 0.918 | 0.991 | 0.743 | ||
| I63_CRUJRA | [-] | 38.9 | 38.9 | 41.6 | 47.3 | 49.2 | -2.75 | 10.9 | 0.724 | 0.588 | 0.597 | 0.919 | 0.990 | 0.738 | ||
| I65_CRUJRA | [-] | 39.3 | 39.3 | 41.6 | 48.1 | 49.2 | -2.34 | 10.9 | 0.784 | 0.596 | 0.595 | 0.913 | 0.989 | 0.738 | ||
| I67_GSWP3 | [-] | 41.9 | 41.7 | 41.5 | 48.2 | 0.113 | 10.6 | 0.992 | 0.616 | 0.591 | 0.899 | 0.993 | 0.738 |
Download Data |
Period Mean (original grids) [W m-2] |
Model Period Mean (intersection) [W m-2] |
Benchmark Period Mean (intersection) [W m-2] |
Model Period Mean (complement) [W m-2] |
Benchmark Period Mean (complement) [W m-2] |
Bias [W m-2] |
RMSE [W m-2] |
Phase Shift [months] |
Bias Score [1] |
RMSE Score [1] |
Seasonal Cycle Score [1] |
Spatial Distribution Score [1] |
Overall Score [1] |
|||
|---|---|---|---|---|---|---|---|---|---|---|---|---|---|---|---|---|
| Benchmark | [-] | 32.2 | ||||||||||||||
| I62_CRUJRA | [-] | 24.9 | 24.5 | 32.2 | 40.8 | 51.9 | -7.44 | 14.1 | 1.26 | 0.464 | 0.699 | 0.835 | 0.683 | 0.676 | ||
| I63_CRUJRA | [-] | 24.9 | 24.5 | 32.2 | 40.8 | 51.9 | -7.44 | 14.1 | 1.26 | 0.464 | 0.699 | 0.835 | 0.683 | 0.676 | ||
| I65_CRUJRA | [-] | 21.1 | 20.7 | 32.2 | 38.1 | 51.9 | -11.2 | 16.5 | 1.27 | 0.316 | 0.717 | 0.831 | 0.599 | 0.636 | ||
| I67_GSWP3 | [-] | 18.8 | 18.4 | 31.8 | 33.7 | -13.1 | 15.3 | 0.995 | 0.342 | 0.801 | 0.877 | 0.683 | 0.701 |
Download Data |
Period Mean (original grids) [W m-2] |
Model Period Mean (intersection) [W m-2] |
Benchmark Period Mean (intersection) [W m-2] |
Model Period Mean (complement) [W m-2] |
Benchmark Period Mean (complement) [W m-2] |
Bias [W m-2] |
RMSE [W m-2] |
Phase Shift [months] |
Bias Score [1] |
RMSE Score [1] |
Seasonal Cycle Score [1] |
Spatial Distribution Score [1] |
Overall Score [1] |
|||
|---|---|---|---|---|---|---|---|---|---|---|---|---|---|---|---|---|
| Benchmark | [-] | 43.0 | ||||||||||||||
| I62_CRUJRA | [-] | 43.9 | 44.0 | 43.0 | 41.4 | 40.0 | 1.06 | 13.9 | 1.63 | 0.563 | 0.598 | 0.790 | 0.920 | 0.694 | ||
| I63_CRUJRA | [-] | 43.9 | 44.0 | 43.0 | 41.4 | 40.0 | 1.06 | 13.9 | 1.62 | 0.563 | 0.598 | 0.790 | 0.920 | 0.694 | ||
| I65_CRUJRA | [-] | 43.4 | 43.6 | 43.0 | 39.6 | 40.0 | 0.573 | 13.6 | 1.60 | 0.562 | 0.610 | 0.790 | 0.910 | 0.696 | ||
| I67_GSWP3 | [-] | 40.9 | 41.1 | 42.7 | 39.9 | -1.43 | 11.0 | 0.979 | 0.647 | 0.684 | 0.902 | 0.881 | 0.759 |
Download Data |
Period Mean (original grids) [W m-2] |
Model Period Mean (intersection) [W m-2] |
Benchmark Period Mean (intersection) [W m-2] |
Model Period Mean (complement) [W m-2] |
Benchmark Period Mean (complement) [W m-2] |
Bias [W m-2] |
RMSE [W m-2] |
Phase Shift [months] |
Bias Score [1] |
RMSE Score [1] |
Seasonal Cycle Score [1] |
Spatial Distribution Score [1] |
Overall Score [1] |
|||
|---|---|---|---|---|---|---|---|---|---|---|---|---|---|---|---|---|
| Benchmark | [-] | 51.7 | ||||||||||||||
| I62_CRUJRA | [-] | 56.5 | 55.6 | 51.6 | 67.6 | 56.7 | 4.24 | 16.6 | 0.758 | 0.335 | 0.558 | 0.938 | 0.881 | 0.654 | ||
| I63_CRUJRA | [-] | 56.5 | 55.6 | 51.6 | 67.6 | 56.7 | 4.24 | 16.6 | 0.754 | 0.334 | 0.557 | 0.938 | 0.881 | 0.653 | ||
| I65_CRUJRA | [-] | 56.4 | 55.5 | 51.6 | 67.7 | 56.7 | 4.11 | 16.7 | 0.758 | 0.334 | 0.557 | 0.937 | 0.883 | 0.654 | ||
| I67_GSWP3 | [-] | 55.1 | 54.9 | 51.6 | 53.3 | 29.1 | 2.59 | 18.1 | 0.700 | 0.289 | 0.594 | 0.937 | 0.639 | 0.611 |
Temporally integrated period mean