Mean State
Download Data |
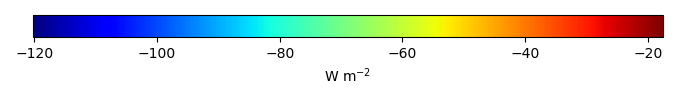
Period Mean (original grids) [W m-2] |
Model Period Mean (intersection) [W m-2] |
Benchmark Period Mean (intersection) [W m-2] |
Model Period Mean (complement) [W m-2] |
Benchmark Period Mean (complement) [W m-2] |
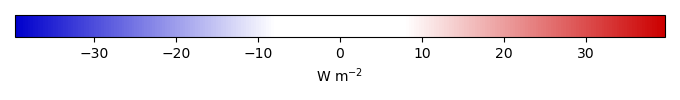
Bias [W m-2] |
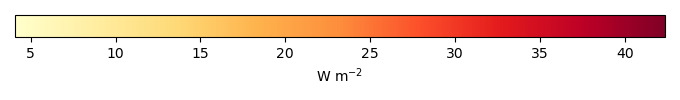
RMSE [W m-2] |
Phase Shift [months] |
Bias Score [1] |
RMSE Score [1] |
Seasonal Cycle Score [1] |
Spatial Distribution Score [1] |
Overall Score [1] |
|||
|---|---|---|---|---|---|---|---|---|---|---|---|---|---|---|---|---|
| Benchmark | [-] | -48.2 | ||||||||||||||
| I62_CRUJRA | [-] | -66.1 | -65.8 | -48.3 | -46.6 | -17.9 | 19.6 | 2.34 | 0.219 | 0.674 | 0.617 | 0.936 | 0.624 | |||
| I63_CRUJRA | [-] | -66.1 | -65.8 | -48.3 | -46.6 | -17.9 | 19.6 | 2.34 | 0.219 | 0.674 | 0.617 | 0.937 | 0.624 | |||
| I65_CRUJRA | [-] | -66.0 | -65.7 | -48.3 | -46.6 | -17.7 | 19.5 | 2.40 | 0.237 | 0.669 | 0.608 | 0.924 | 0.622 | |||
| I67_GSWP3 | [-] | -68.3 | -68.2 | -48.5 | -46.1 | -20.0 | 21.4 | 1.65 | 0.113 | 0.727 | 0.767 | 0.989 | 0.665 |
Download Data |
Period Mean (original grids) [W m-2] |
Model Period Mean (intersection) [W m-2] |
Benchmark Period Mean (intersection) [W m-2] |
Model Period Mean (complement) [W m-2] |
Benchmark Period Mean (complement) [W m-2] |
Bias [W m-2] |
RMSE [W m-2] |
Phase Shift [months] |
Bias Score [1] |
RMSE Score [1] |
Seasonal Cycle Score [1] |
Spatial Distribution Score [1] |
Overall Score [1] |
|||
|---|---|---|---|---|---|---|---|---|---|---|---|---|---|---|---|---|
| Benchmark | [-] | -74.6 | ||||||||||||||
| I62_CRUJRA | [-] | -95.6 | -96.4 | -74.9 | -53.6 | -21.3 | 26.1 | 0.492 | 0.152 | 0.382 | 0.935 | 0.916 | 0.554 | |||
| I63_CRUJRA | [-] | -95.6 | -96.4 | -74.9 | -53.6 | -21.2 | 26.1 | 0.492 | 0.152 | 0.382 | 0.935 | 0.916 | 0.554 | |||
| I65_CRUJRA | [-] | -95.9 | -96.6 | -74.9 | -53.6 | -21.5 | 26.1 | 0.507 | 0.156 | 0.400 | 0.931 | 0.887 | 0.555 | |||
| I67_GSWP3 | [-] | -98.6 | -99.3 | -75.4 | -47.1 | -23.6 | 25.5 | 0.346 | 0.106 | 0.633 | 0.965 | 0.869 | 0.641 |
Download Data |
Period Mean (original grids) [W m-2] |
Model Period Mean (intersection) [W m-2] |
Benchmark Period Mean (intersection) [W m-2] |
Model Period Mean (complement) [W m-2] |
Benchmark Period Mean (complement) [W m-2] |
Bias [W m-2] |
RMSE [W m-2] |
Phase Shift [months] |
Bias Score [1] |
RMSE Score [1] |
Seasonal Cycle Score [1] |
Spatial Distribution Score [1] |
Overall Score [1] |
|||
|---|---|---|---|---|---|---|---|---|---|---|---|---|---|---|---|---|
| Benchmark | [-] | -72.9 | ||||||||||||||
| I62_CRUJRA | [-] | -86.5 | -86.7 | -73.4 | -61.5 | -12.2 | 19.0 | 1.59 | 0.304 | 0.495 | 0.775 | 0.941 | 0.602 | |||
| I63_CRUJRA | [-] | -86.5 | -86.7 | -73.4 | -61.5 | -12.2 | 19.0 | 1.59 | 0.304 | 0.495 | 0.776 | 0.941 | 0.602 | |||
| I65_CRUJRA | [-] | -86.8 | -87.0 | -73.4 | -61.5 | -12.4 | 19.2 | 1.57 | 0.301 | 0.493 | 0.779 | 0.946 | 0.603 | |||
| I67_GSWP3 | [-] | -91.1 | -91.2 | -73.4 | -58.3 | -16.0 | 19.4 | 1.65 | 0.179 | 0.656 | 0.769 | 0.956 | 0.643 |
Download Data |
Period Mean (original grids) [W m-2] |
Model Period Mean (intersection) [W m-2] |
Benchmark Period Mean (intersection) [W m-2] |
Model Period Mean (complement) [W m-2] |
Benchmark Period Mean (complement) [W m-2] |
Bias [W m-2] |
RMSE [W m-2] |
Phase Shift [months] |
Bias Score [1] |
RMSE Score [1] |
Seasonal Cycle Score [1] |
Spatial Distribution Score [1] |
Overall Score [1] |
|||
|---|---|---|---|---|---|---|---|---|---|---|---|---|---|---|---|---|
| Benchmark | [-] | -43.9 | ||||||||||||||
| I62_CRUJRA | [-] | -41.9 | -41.9 | -43.7 | -45.3 | 1.56 | 10.9 | 1.84 | 0.614 | 0.425 | 0.740 | 0.915 | 0.624 | |||
| I63_CRUJRA | [-] | -42.1 | -42.2 | -43.7 | -45.3 | 1.37 | 10.5 | 1.80 | 0.620 | 0.449 | 0.743 | 0.921 | 0.636 | |||
| I65_CRUJRA | [-] | -42.1 | -42.2 | -43.7 | -45.3 | 1.34 | 10.9 | 1.75 | 0.621 | 0.428 | 0.755 | 0.908 | 0.628 | |||
| I67_GSWP3 | [-] | -40.0 | -40.0 | -43.6 | -44.2 | 3.01 | 16.0 | 1.74 | 0.580 | 0.202 | 0.755 | 0.995 | 0.547 |
Download Data |
Period Mean (original grids) [W m-2] |
Model Period Mean (intersection) [W m-2] |
Benchmark Period Mean (intersection) [W m-2] |
Model Period Mean (complement) [W m-2] |
Benchmark Period Mean (complement) [W m-2] |
Bias [W m-2] |
RMSE [W m-2] |
Phase Shift [months] |
Bias Score [1] |
RMSE Score [1] |
Seasonal Cycle Score [1] |
Spatial Distribution Score [1] |
Overall Score [1] |
|||
|---|---|---|---|---|---|---|---|---|---|---|---|---|---|---|---|---|
| Benchmark | [-] | -42.1 | ||||||||||||||
| I62_CRUJRA | [-] | -48.4 | -48.4 | -40.5 | -47.5 | -8.56 | 13.7 | 2.36 | 0.349 | 0.777 | 0.626 | 0.933 | 0.693 | |||
| I63_CRUJRA | [-] | -48.4 | -48.4 | -40.5 | -47.5 | -8.56 | 13.7 | 2.36 | 0.349 | 0.777 | 0.626 | 0.933 | 0.693 | |||
| I65_CRUJRA | [-] | -47.9 | -47.9 | -40.5 | -47.5 | -8.08 | 13.5 | 2.36 | 0.360 | 0.773 | 0.625 | 0.934 | 0.693 | |||
| I67_GSWP3 | [-] | -48.4 | -48.5 | -41.9 | -47.9 | -6.24 | 12.0 | 2.24 | 0.333 | 0.791 | 0.659 | 0.939 | 0.703 |
Download Data |
Period Mean (original grids) [W m-2] |
Model Period Mean (intersection) [W m-2] |
Benchmark Period Mean (intersection) [W m-2] |
Model Period Mean (complement) [W m-2] |
Benchmark Period Mean (complement) [W m-2] |
Bias [W m-2] |
RMSE [W m-2] |
Phase Shift [months] |
Bias Score [1] |
RMSE Score [1] |
Seasonal Cycle Score [1] |
Spatial Distribution Score [1] |
Overall Score [1] |
|||
|---|---|---|---|---|---|---|---|---|---|---|---|---|---|---|---|---|
| Benchmark | [-] | -47.3 | ||||||||||||||
| I62_CRUJRA | [-] | -51.1 | -51.0 | -47.2 | -56.4 | -3.84 | 10.2 | 1.26 | 0.555 | 0.480 | 0.846 | 0.962 | 0.665 | |||
| I63_CRUJRA | [-] | -51.4 | -51.3 | -47.2 | -56.4 | -4.12 | 9.95 | 1.22 | 0.534 | 0.507 | 0.852 | 0.956 | 0.671 | |||
| I65_CRUJRA | [-] | -52.0 | -52.0 | -47.2 | -56.4 | -4.81 | 11.1 | 1.31 | 0.504 | 0.448 | 0.837 | 0.954 | 0.638 | |||
| I67_GSWP3 | [-] | -51.4 | -51.3 | -47.1 | -56.3 | -4.21 | 12.3 | 1.81 | 0.483 | 0.419 | 0.752 | 0.910 | 0.596 |
Download Data |
Period Mean (original grids) [W m-2] |
Model Period Mean (intersection) [W m-2] |
Benchmark Period Mean (intersection) [W m-2] |
Model Period Mean (complement) [W m-2] |
Benchmark Period Mean (complement) [W m-2] |
Bias [W m-2] |
RMSE [W m-2] |
Phase Shift [months] |
Bias Score [1] |
RMSE Score [1] |
Seasonal Cycle Score [1] |
Spatial Distribution Score [1] |
Overall Score [1] |
|||
|---|---|---|---|---|---|---|---|---|---|---|---|---|---|---|---|---|
| Benchmark | [-] | -66.9 | ||||||||||||||
| I62_CRUJRA | [-] | -78.0 | -77.7 | -67.1 | -56.1 | -9.88 | 14.8 | 0.986 | 0.379 | 0.548 | 0.880 | 0.988 | 0.669 | |||
| I63_CRUJRA | [-] | -77.9 | -77.7 | -67.1 | -56.1 | -9.87 | 14.7 | 0.970 | 0.378 | 0.554 | 0.882 | 0.988 | 0.671 | |||
| I65_CRUJRA | [-] | -77.9 | -77.7 | -67.1 | -56.1 | -9.86 | 14.6 | 0.988 | 0.380 | 0.550 | 0.880 | 0.990 | 0.670 | |||
| I67_GSWP3 | [-] | -73.4 | -73.1 | -66.6 | -53.4 | -5.37 | 12.8 | 1.17 | 0.465 | 0.617 | 0.845 | 0.976 | 0.704 |
Download Data |
Period Mean (original grids) [W m-2] |
Model Period Mean (intersection) [W m-2] |
Benchmark Period Mean (intersection) [W m-2] |
Model Period Mean (complement) [W m-2] |
Benchmark Period Mean (complement) [W m-2] |
Bias [W m-2] |
RMSE [W m-2] |
Phase Shift [months] |
Bias Score [1] |
RMSE Score [1] |
Seasonal Cycle Score [1] |
Spatial Distribution Score [1] |
Overall Score [1] |
|||
|---|---|---|---|---|---|---|---|---|---|---|---|---|---|---|---|---|
| Benchmark | [-] | -59.6 | ||||||||||||||
| I62_CRUJRA | [-] | -83.1 | -83.1 | -60.3 | -51.3 | -20.3 | 23.9 | 1.21 | 0.160 | 0.486 | 0.831 | 0.975 | 0.588 | |||
| I63_CRUJRA | [-] | -83.1 | -83.1 | -60.3 | -51.3 | -20.3 | 23.9 | 1.21 | 0.160 | 0.487 | 0.831 | 0.975 | 0.588 | |||
| I65_CRUJRA | [-] | -83.0 | -82.9 | -60.3 | -51.3 | -20.0 | 23.8 | 1.21 | 0.169 | 0.478 | 0.832 | 0.970 | 0.585 | |||
| I67_GSWP3 | [-] | -82.5 | -82.6 | -59.7 | -51.0 | -19.3 | 21.7 | 1.26 | 0.153 | 0.633 | 0.828 | 0.990 | 0.648 |
Download Data |
Period Mean (original grids) [W m-2] |
Model Period Mean (intersection) [W m-2] |
Benchmark Period Mean (intersection) [W m-2] |
Model Period Mean (complement) [W m-2] |
Benchmark Period Mean (complement) [W m-2] |
Bias [W m-2] |
RMSE [W m-2] |
Phase Shift [months] |
Bias Score [1] |
RMSE Score [1] |
Seasonal Cycle Score [1] |
Spatial Distribution Score [1] |
Overall Score [1] |
|||
|---|---|---|---|---|---|---|---|---|---|---|---|---|---|---|---|---|
| Benchmark | [-] | -40.4 | ||||||||||||||
| I62_CRUJRA | [-] | -41.3 | -41.4 | -40.3 | -42.6 | -0.846 | 9.88 | 2.00 | 0.709 | 0.466 | 0.724 | 0.957 | 0.664 | |||
| I63_CRUJRA | [-] | -41.5 | -41.5 | -40.3 | -42.6 | -0.995 | 9.44 | 1.99 | 0.697 | 0.500 | 0.722 | 0.933 | 0.670 | |||
| I65_CRUJRA | [-] | -41.4 | -41.5 | -40.3 | -42.6 | -0.928 | 10.2 | 2.00 | 0.704 | 0.445 | 0.722 | 0.943 | 0.652 | |||
| I67_GSWP3 | [-] | -40.4 | -40.4 | -40.3 | -46.4 | 0.0668 | 16.1 | 2.39 | 0.628 | 0.181 | 0.647 | 0.896 | 0.507 |
Download Data |
Period Mean (original grids) [W m-2] |
Model Period Mean (intersection) [W m-2] |
Benchmark Period Mean (intersection) [W m-2] |
Model Period Mean (complement) [W m-2] |
Benchmark Period Mean (complement) [W m-2] |
Bias [W m-2] |
RMSE [W m-2] |
Phase Shift [months] |
Bias Score [1] |
RMSE Score [1] |
Seasonal Cycle Score [1] |
Spatial Distribution Score [1] |
Overall Score [1] |
|||
|---|---|---|---|---|---|---|---|---|---|---|---|---|---|---|---|---|
| Benchmark | [-] | -88.1 | ||||||||||||||
| I62_CRUJRA | [-] | -98.9 | -99.0 | -90.0 | -64.8 | -6.31 | 11.6 | 0.973 | 0.515 | 0.687 | 0.854 | 0.986 | 0.746 | |||
| I63_CRUJRA | [-] | -98.9 | -99.0 | -90.0 | -64.8 | -6.31 | 11.6 | 0.973 | 0.516 | 0.687 | 0.854 | 0.986 | 0.746 | |||
| I65_CRUJRA | [-] | -98.9 | -99.0 | -90.0 | -64.8 | -6.29 | 11.7 | 0.918 | 0.507 | 0.687 | 0.865 | 0.986 | 0.747 | |||
| I67_GSWP3 | [-] | -101. | -101. | -87.9 | -66.9 | -7.97 | 12.4 | 1.05 | 0.450 | 0.730 | 0.858 | 0.990 | 0.752 |
Download Data |
Period Mean (original grids) [W m-2] |
Model Period Mean (intersection) [W m-2] |
Benchmark Period Mean (intersection) [W m-2] |
Model Period Mean (complement) [W m-2] |
Benchmark Period Mean (complement) [W m-2] |
Bias [W m-2] |
RMSE [W m-2] |
Phase Shift [months] |
Bias Score [1] |
RMSE Score [1] |
Seasonal Cycle Score [1] |
Spatial Distribution Score [1] |
Overall Score [1] |
|||
|---|---|---|---|---|---|---|---|---|---|---|---|---|---|---|---|---|
| Benchmark | [-] | -53.4 | ||||||||||||||
| I62_CRUJRA | [-] | -60.1 | -60.2 | -52.7 | -61.1 | -8.51 | 15.2 | 1.44 | 0.335 | 0.451 | 0.805 | 0.953 | 0.599 | |||
| I63_CRUJRA | [-] | -60.2 | -60.2 | -52.7 | -61.1 | -8.54 | 15.2 | 1.43 | 0.335 | 0.457 | 0.806 | 0.955 | 0.602 | |||
| I65_CRUJRA | [-] | -60.6 | -60.6 | -52.7 | -61.1 | -8.92 | 15.8 | 1.44 | 0.324 | 0.430 | 0.805 | 0.963 | 0.590 | |||
| I67_GSWP3 | [-] | -57.9 | -57.9 | -53.3 | -63.1 | -5.44 | 12.2 | 1.81 | 0.433 | 0.619 | 0.751 | 0.992 | 0.683 |
Download Data |
Period Mean (original grids) [W m-2] |
Model Period Mean (intersection) [W m-2] |
Benchmark Period Mean (intersection) [W m-2] |
Model Period Mean (complement) [W m-2] |
Benchmark Period Mean (complement) [W m-2] |
Bias [W m-2] |
RMSE [W m-2] |
Phase Shift [months] |
Bias Score [1] |
RMSE Score [1] |
Seasonal Cycle Score [1] |
Spatial Distribution Score [1] |
Overall Score [1] |
|||
|---|---|---|---|---|---|---|---|---|---|---|---|---|---|---|---|---|
| Benchmark | [-] | -61.0 | ||||||||||||||
| I62_CRUJRA | [-] | -69.8 | -69.8 | -61.3 | -54.0 | -7.86 | 16.3 | 1.69 | 0.377 | 0.565 | 0.745 | 0.940 | 0.639 | |||
| I63_CRUJRA | [-] | -69.8 | -69.8 | -61.3 | -54.0 | -7.87 | 16.3 | 1.69 | 0.375 | 0.570 | 0.744 | 0.940 | 0.640 | |||
| I65_CRUJRA | [-] | -69.8 | -69.8 | -61.3 | -54.0 | -7.89 | 16.4 | 1.68 | 0.377 | 0.559 | 0.746 | 0.940 | 0.636 | |||
| I67_GSWP3 | [-] | -72.6 | -72.6 | -61.0 | -54.4 | -10.2 | 15.8 | 1.54 | 0.337 | 0.610 | 0.781 | 0.986 | 0.665 |
Download Data |
Period Mean (original grids) [W m-2] |
Model Period Mean (intersection) [W m-2] |
Benchmark Period Mean (intersection) [W m-2] |
Model Period Mean (complement) [W m-2] |
Benchmark Period Mean (complement) [W m-2] |
Bias [W m-2] |
RMSE [W m-2] |
Phase Shift [months] |
Bias Score [1] |
RMSE Score [1] |
Seasonal Cycle Score [1] |
Spatial Distribution Score [1] |
Overall Score [1] |
|||
|---|---|---|---|---|---|---|---|---|---|---|---|---|---|---|---|---|
| Benchmark | [-] | -103. | ||||||||||||||
| I62_CRUJRA | [-] | -113. | -113. | -104. | -72.7 | -8.17 | 14.5 | 1.00 | 0.510 | 0.612 | 0.848 | 0.971 | 0.711 | |||
| I63_CRUJRA | [-] | -113. | -113. | -104. | -72.7 | -8.17 | 14.5 | 1.00 | 0.510 | 0.612 | 0.848 | 0.971 | 0.711 | |||
| I65_CRUJRA | [-] | -113. | -113. | -104. | -72.7 | -8.20 | 14.5 | 0.995 | 0.509 | 0.611 | 0.850 | 0.971 | 0.710 | |||
| I67_GSWP3 | [-] | -115. | -115. | -103. | -71.5 | -10.4 | 15.4 | 0.919 | 0.414 | 0.659 | 0.861 | 0.989 | 0.716 |
Download Data |
Period Mean (original grids) [W m-2] |
Model Period Mean (intersection) [W m-2] |
Benchmark Period Mean (intersection) [W m-2] |
Model Period Mean (complement) [W m-2] |
Benchmark Period Mean (complement) [W m-2] |
Bias [W m-2] |
RMSE [W m-2] |
Phase Shift [months] |
Bias Score [1] |
RMSE Score [1] |
Seasonal Cycle Score [1] |
Spatial Distribution Score [1] |
Overall Score [1] |
|||
|---|---|---|---|---|---|---|---|---|---|---|---|---|---|---|---|---|
| Benchmark | [-] | -41.2 | ||||||||||||||
| I62_CRUJRA | [-] | -43.8 | -43.8 | -41.2 | -42.0 | -2.74 | 10.1 | 1.96 | 0.517 | 0.526 | 0.708 | 0.994 | 0.654 | |||
| I63_CRUJRA | [-] | -43.7 | -43.7 | -41.2 | -42.0 | -2.60 | 10.1 | 2.12 | 0.517 | 0.532 | 0.673 | 0.995 | 0.650 | |||
| I65_CRUJRA | [-] | -44.2 | -44.2 | -41.2 | -42.0 | -3.13 | 10.7 | 1.97 | 0.505 | 0.495 | 0.705 | 0.995 | 0.639 | |||
| I67_GSWP3 | [-] | -42.9 | -42.9 | -41.2 | -40.2 | -1.63 | 12.6 | 2.18 | 0.546 | 0.339 | 0.670 | 0.969 | 0.573 |
Download Data |
Period Mean (original grids) [W m-2] |
Model Period Mean (intersection) [W m-2] |
Benchmark Period Mean (intersection) [W m-2] |
Model Period Mean (complement) [W m-2] |
Benchmark Period Mean (complement) [W m-2] |
Bias [W m-2] |
RMSE [W m-2] |
Phase Shift [months] |
Bias Score [1] |
RMSE Score [1] |
Seasonal Cycle Score [1] |
Spatial Distribution Score [1] |
Overall Score [1] |
|||
|---|---|---|---|---|---|---|---|---|---|---|---|---|---|---|---|---|
| Benchmark | [-] | -65.4 | ||||||||||||||
| I62_CRUJRA | [-] | -85.2 | -85.3 | -67.3 | -55.6 | -14.6 | 19.9 | 2.07 | 0.293 | 0.543 | 0.653 | 0.962 | 0.599 | |||
| I63_CRUJRA | [-] | -85.1 | -85.3 | -67.3 | -55.6 | -14.6 | 19.9 | 2.07 | 0.293 | 0.543 | 0.653 | 0.962 | 0.599 | |||
| I65_CRUJRA | [-] | -84.8 | -85.0 | -67.3 | -55.6 | -14.2 | 19.6 | 2.11 | 0.309 | 0.534 | 0.645 | 0.968 | 0.598 | |||
| I67_GSWP3 | [-] | -85.6 | -85.7 | -66.1 | -54.2 | -15.4 | 19.1 | 2.04 | 0.259 | 0.643 | 0.661 | 0.989 | 0.639 |
Download Data |
Period Mean (original grids) [W m-2] |
Model Period Mean (intersection) [W m-2] |
Benchmark Period Mean (intersection) [W m-2] |
Model Period Mean (complement) [W m-2] |
Benchmark Period Mean (complement) [W m-2] |
Bias [W m-2] |
RMSE [W m-2] |
Phase Shift [months] |
Bias Score [1] |
RMSE Score [1] |
Seasonal Cycle Score [1] |
Spatial Distribution Score [1] |
Overall Score [1] |
|||
|---|---|---|---|---|---|---|---|---|---|---|---|---|---|---|---|---|
| Benchmark | [-] | -50.4 | ||||||||||||||
| I62_CRUJRA | [-] | -63.0 | -62.8 | -50.0 | -60.2 | -12.8 | 15.6 | 2.80 | 0.123 | 0.571 | 0.512 | 0.971 | 0.550 | |||
| I63_CRUJRA | [-] | -63.0 | -62.8 | -50.0 | -60.2 | -12.8 | 15.6 | 2.79 | 0.122 | 0.576 | 0.513 | 0.970 | 0.551 | |||
| I65_CRUJRA | [-] | -62.6 | -62.5 | -50.0 | -60.2 | -12.4 | 15.3 | 2.79 | 0.134 | 0.580 | 0.515 | 0.961 | 0.554 | |||
| I67_GSWP3 | [-] | -63.0 | -62.9 | -50.3 | -61.0 | -12.7 | 15.2 | 2.90 | 0.116 | 0.611 | 0.511 | 0.996 | 0.569 |
Download Data |
Period Mean (original grids) [W m-2] |
Model Period Mean (intersection) [W m-2] |
Benchmark Period Mean (intersection) [W m-2] |
Model Period Mean (complement) [W m-2] |
Benchmark Period Mean (complement) [W m-2] |
Bias [W m-2] |
RMSE [W m-2] |
Phase Shift [months] |
Bias Score [1] |
RMSE Score [1] |
Seasonal Cycle Score [1] |
Spatial Distribution Score [1] |
Overall Score [1] |
|||
|---|---|---|---|---|---|---|---|---|---|---|---|---|---|---|---|---|
| Benchmark | [-] | -45.2 | ||||||||||||||
| I62_CRUJRA | [-] | -52.0 | -52.0 | -45.2 | -45.8 | -6.68 | 11.0 | 1.41 | 0.368 | 0.574 | 0.827 | 0.976 | 0.664 | |||
| I63_CRUJRA | [-] | -52.1 | -52.2 | -45.2 | -45.8 | -6.83 | 10.9 | 1.41 | 0.357 | 0.594 | 0.828 | 0.979 | 0.671 | |||
| I65_CRUJRA | [-] | -53.2 | -53.2 | -45.2 | -45.8 | -7.86 | 12.0 | 1.45 | 0.302 | 0.555 | 0.822 | 0.981 | 0.643 | |||
| I67_GSWP3 | [-] | -52.4 | -52.4 | -45.2 | -45.3 | -7.00 | 11.0 | 1.75 | 0.367 | 0.545 | 0.768 | 0.960 | 0.637 |
Download Data |
Period Mean (original grids) [W m-2] |
Model Period Mean (intersection) [W m-2] |
Benchmark Period Mean (intersection) [W m-2] |
Model Period Mean (complement) [W m-2] |
Benchmark Period Mean (complement) [W m-2] |
Bias [W m-2] |
RMSE [W m-2] |
Phase Shift [months] |
Bias Score [1] |
RMSE Score [1] |
Seasonal Cycle Score [1] |
Spatial Distribution Score [1] |
Overall Score [1] |
|||
|---|---|---|---|---|---|---|---|---|---|---|---|---|---|---|---|---|
| Benchmark | [-] | -78.6 | ||||||||||||||
| I62_CRUJRA | [-] | -85.0 | -84.7 | -79.0 | -54.6 | -5.50 | 12.6 | 0.809 | 0.473 | 0.595 | 0.921 | 0.989 | 0.715 | |||
| I63_CRUJRA | [-] | -84.9 | -84.7 | -79.0 | -54.6 | -5.49 | 12.6 | 0.809 | 0.473 | 0.597 | 0.921 | 0.989 | 0.716 | |||
| I65_CRUJRA | [-] | -85.7 | -85.4 | -79.0 | -54.6 | -6.15 | 12.8 | 0.805 | 0.464 | 0.584 | 0.921 | 0.984 | 0.707 | |||
| I67_GSWP3 | [-] | -87.1 | -87.0 | -78.9 | -54.6 | -7.46 | 11.8 | 0.815 | 0.423 | 0.679 | 0.910 | 0.974 | 0.733 |
Download Data |
Period Mean (original grids) [W m-2] |
Model Period Mean (intersection) [W m-2] |
Benchmark Period Mean (intersection) [W m-2] |
Model Period Mean (complement) [W m-2] |
Benchmark Period Mean (complement) [W m-2] |
Bias [W m-2] |
RMSE [W m-2] |
Phase Shift [months] |
Bias Score [1] |
RMSE Score [1] |
Seasonal Cycle Score [1] |
Spatial Distribution Score [1] |
Overall Score [1] |
|||
|---|---|---|---|---|---|---|---|---|---|---|---|---|---|---|---|---|
| Benchmark | [-] | -32.5 | ||||||||||||||
| I62_CRUJRA | [-] | -45.9 | -45.8 | -32.2 | -44.6 | -13.9 | 15.7 | 2.06 | 0.230 | 0.775 | 0.680 | 0.979 | 0.688 | |||
| I63_CRUJRA | [-] | -45.9 | -45.8 | -32.2 | -44.6 | -13.9 | 15.7 | 2.06 | 0.230 | 0.775 | 0.680 | 0.979 | 0.688 | |||
| I65_CRUJRA | [-] | -44.9 | -44.8 | -32.2 | -44.6 | -13.0 | 15.0 | 2.04 | 0.268 | 0.767 | 0.682 | 0.977 | 0.692 | |||
| I67_GSWP3 | [-] | -51.9 | -51.8 | -32.4 | -46.3 | -19.5 | 20.7 | 1.63 | 0.0798 | 0.821 | 0.778 | 0.969 | 0.694 |
Download Data |
Period Mean (original grids) [W m-2] |
Model Period Mean (intersection) [W m-2] |
Benchmark Period Mean (intersection) [W m-2] |
Model Period Mean (complement) [W m-2] |
Benchmark Period Mean (complement) [W m-2] |
Bias [W m-2] |
RMSE [W m-2] |
Phase Shift [months] |
Bias Score [1] |
RMSE Score [1] |
Seasonal Cycle Score [1] |
Spatial Distribution Score [1] |
Overall Score [1] |
|||
|---|---|---|---|---|---|---|---|---|---|---|---|---|---|---|---|---|
| Benchmark | [-] | -54.8 | ||||||||||||||
| I62_CRUJRA | [-] | -67.9 | -68.4 | -54.7 | -57.4 | -13.4 | 15.9 | 1.88 | 0.289 | 0.650 | 0.723 | 0.977 | 0.658 | |||
| I63_CRUJRA | [-] | -67.8 | -68.4 | -54.7 | -57.4 | -13.4 | 15.9 | 1.88 | 0.289 | 0.650 | 0.723 | 0.977 | 0.658 | |||
| I65_CRUJRA | [-] | -66.9 | -67.4 | -54.7 | -57.4 | -12.3 | 15.3 | 1.79 | 0.345 | 0.648 | 0.739 | 0.958 | 0.667 | |||
| I67_GSWP3 | [-] | -72.7 | -73.1 | -54.7 | -60.8 | -17.8 | 19.2 | 1.78 | 0.116 | 0.726 | 0.732 | 0.994 | 0.659 |
Download Data |
Period Mean (original grids) [W m-2] |
Model Period Mean (intersection) [W m-2] |
Benchmark Period Mean (intersection) [W m-2] |
Model Period Mean (complement) [W m-2] |
Benchmark Period Mean (complement) [W m-2] |
Bias [W m-2] |
RMSE [W m-2] |
Phase Shift [months] |
Bias Score [1] |
RMSE Score [1] |
Seasonal Cycle Score [1] |
Spatial Distribution Score [1] |
Overall Score [1] |
|||
|---|---|---|---|---|---|---|---|---|---|---|---|---|---|---|---|---|
| Benchmark | [-] | -78.0 | ||||||||||||||
| I62_CRUJRA | [-] | -94.4 | -94.1 | -81.2 | -49.6 | -8.69 | 20.6 | 1.15 | 0.240 | 0.600 | 0.851 | 0.961 | 0.650 | |||
| I63_CRUJRA | [-] | -94.4 | -94.0 | -81.2 | -49.6 | -8.64 | 20.6 | 1.14 | 0.240 | 0.600 | 0.851 | 0.961 | 0.650 | |||
| I65_CRUJRA | [-] | -94.4 | -94.1 | -81.2 | -49.6 | -8.73 | 20.6 | 1.14 | 0.238 | 0.599 | 0.851 | 0.961 | 0.650 | |||
| I67_GSWP3 | [-] | -87.1 | -86.8 | -78.4 | -50.4 | -5.96 | 19.3 | 1.31 | 0.331 | 0.646 | 0.820 | 0.872 | 0.663 |
Temporally integrated period mean