Mean State
Download Data |
Period Mean (original grids) [W m-2] |
Bias [W m-2] |
RMSE [W m-2] |
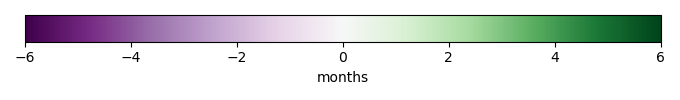
Phase Shift [months] |
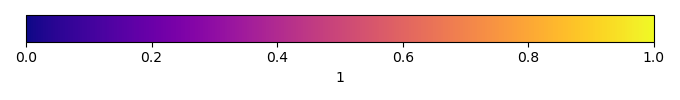
Bias Score [1] |
RMSE Score [1] |
Seasonal Cycle Score [1] |
Overall Score [1] |
|||
|---|---|---|---|---|---|---|---|---|---|---|---|
| Benchmark | [-] | -30.7 | |||||||||
| I62_CRUJRA | [-] | -52.6 | -21.9 | 25.4 | 1.02 | 0.00 | 0.716 | 0.933 | 0.591 | ||
| I63_CRUJRA | [-] | -52.6 | -21.9 | 25.4 | 1.02 | 0.00 | 0.716 | 0.933 | 0.591 | ||
| I65_CRUJRA | [-] | -50.6 | -19.9 | 23.6 | 1.02 | 0.00 | 0.714 | 0.933 | 0.590 | ||
| I67_GSWP3 | [-] | -65.4 | -34.7 | 35.5 | 3.07 | 0.00 | 0.668 | 0.494 | 0.457 |
Download Data |
Period Mean (original grids) [W m-2] |
Bias [W m-2] |
RMSE [W m-2] |
Phase Shift [months] |
Bias Score [1] |
RMSE Score [1] |
Seasonal Cycle Score [1] |
Overall Score [1] |
|||
|---|---|---|---|---|---|---|---|---|---|---|---|
| Benchmark | [-] | -72.1 | |||||||||
| I62_CRUJRA | [-] | -95.6 | -23.5 | 31.0 | 0.983 | 0.00 | 0.00 | 0.937 | 0.234 | ||
| I63_CRUJRA | [-] | -95.6 | -23.5 | 31.0 | 0.983 | 0.00 | 0.00 | 0.937 | 0.234 | ||
| I65_CRUJRA | [-] | -95.5 | -23.4 | 30.9 | 0.983 | 0.00 | 0.00 | 0.937 | 0.234 | ||
| I67_GSWP3 | [-] | -105. | -33.1 | 31.7 | 0.00 | 0.00 | 0.504 | 1.00 | 0.502 |
Download Data |
Period Mean (original grids) [W m-2] |
Bias [W m-2] |
RMSE [W m-2] |
Phase Shift [months] |
Bias Score [1] |
RMSE Score [1] |
Seasonal Cycle Score [1] |
Overall Score [1] |
|||
|---|---|---|---|---|---|---|---|---|---|---|---|
| Benchmark | [-] | -32.4 | |||||||||
| I62_CRUJRA | [-] | -40.0 | -7.56 | 20.1 | 1.50 | 0.275 | 0.177 | 0.847 | 0.369 | ||
| I63_CRUJRA | [-] | -40.3 | -7.89 | 20.4 | 1.50 | 0.245 | 0.160 | 0.847 | 0.353 | ||
| I65_CRUJRA | [-] | -40.1 | -7.70 | 20.0 | 1.50 | 0.263 | 0.183 | 0.847 | 0.369 | ||
| I67_GSWP3 | [-] | -37.2 | -4.79 | 20.6 | 0.983 | 0.541 | 0.125 | 0.882 | 0.418 |
Download Data |
Period Mean (original grids) [W m-2] |
Bias [W m-2] |
RMSE [W m-2] |
Phase Shift [months] |
Bias Score [1] |
RMSE Score [1] |
Seasonal Cycle Score [1] |
Overall Score [1] |
|||
|---|---|---|---|---|---|---|---|---|---|---|---|
| Benchmark | [-] | -32.8 | |||||||||
| I62_CRUJRA | [-] | -53.9 | -21.1 | 23.3 | 0.00 | 0.00 | 0.622 | 1.00 | 0.561 | ||
| I63_CRUJRA | [-] | -53.9 | -21.1 | 23.3 | 0.00 | 0.00 | 0.622 | 1.00 | 0.561 | ||
| I65_CRUJRA | [-] | -53.5 | -20.6 | 22.8 | 0.00 | 0.00 | 0.624 | 1.00 | 0.562 | ||
| I67_GSWP3 | [-] | -51.5 | -18.6 | 19.0 | 1.02 | 0.00 | 0.744 | 0.933 | 0.605 |
Download Data |
Period Mean (original grids) [W m-2] |
Bias [W m-2] |
RMSE [W m-2] |
Phase Shift [months] |
Bias Score [1] |
RMSE Score [1] |
Seasonal Cycle Score [1] |
Overall Score [1] |
|||
|---|---|---|---|---|---|---|---|---|---|---|---|
| Benchmark | [-] | -38.3 | |||||||||
| I62_CRUJRA | [-] | -47.0 | -8.62 | 12.0 | 0.00 | 0.312 | 0.492 | 1.00 | 0.574 | ||
| I63_CRUJRA | [-] | -47.1 | -8.81 | 12.1 | 0.00 | 0.297 | 0.491 | 1.00 | 0.570 | ||
| I65_CRUJRA | [-] | -47.6 | -9.25 | 12.4 | 0.00 | 0.263 | 0.495 | 1.00 | 0.563 | ||
| I67_GSWP3 | [-] | -54.3 | -16.0 | 22.0 | 0.983 | 0.00 | 0.108 | 0.937 | 0.288 |
Download Data |
Period Mean (original grids) [W m-2] |
Bias [W m-2] |
RMSE [W m-2] |
Phase Shift [months] |
Bias Score [1] |
RMSE Score [1] |
Seasonal Cycle Score [1] |
Overall Score [1] |
|||
|---|---|---|---|---|---|---|---|---|---|---|---|
| Benchmark | [-] | -55.6 | |||||||||
| I62_CRUJRA | [-] | -63.0 | -7.39 | 12.2 | 1.68 | 0.477 | 0.542 | 0.690 | 0.563 | ||
| I63_CRUJRA | [-] | -63.0 | -7.40 | 12.1 | 1.68 | 0.477 | 0.537 | 0.690 | 0.560 | ||
| I65_CRUJRA | [-] | -62.9 | -7.30 | 12.0 | 1.68 | 0.482 | 0.534 | 0.690 | 0.560 | ||
| I67_GSWP3 | [-] | -58.1 | -2.51 | 14.7 | 0.672 | 0.260 | 0.424 | 0.917 | 0.506 |
Download Data |
Period Mean (original grids) [W m-2] |
Bias [W m-2] |
RMSE [W m-2] |
Phase Shift [months] |
Bias Score [1] |
RMSE Score [1] |
Seasonal Cycle Score [1] |
Overall Score [1] |
|||
|---|---|---|---|---|---|---|---|---|---|---|---|
| Benchmark | [-] | -68.9 | |||||||||
| I62_CRUJRA | [-] | -88.0 | -17.4 | 21.4 | 0.917 | 0.124 | 0.480 | 0.904 | 0.497 | ||
| I63_CRUJRA | [-] | -88.0 | -17.4 | 21.4 | 0.917 | 0.124 | 0.480 | 0.904 | 0.497 | ||
| I65_CRUJRA | [-] | -87.0 | -16.4 | 20.8 | 0.733 | 0.181 | 0.478 | 0.938 | 0.519 | ||
| I67_GSWP3 | [-] | -88.5 | -19.6 | 22.6 | 0.788 | 0.0734 | 0.487 | 0.914 | 0.490 |
Download Data |
Period Mean (original grids) [W m-2] |
Bias [W m-2] |
RMSE [W m-2] |
Phase Shift [months] |
Bias Score [1] |
RMSE Score [1] |
Seasonal Cycle Score [1] |
Overall Score [1] |
|||
|---|---|---|---|---|---|---|---|---|---|---|---|
| Benchmark | [-] | -47.4 | |||||||||
| I62_CRUJRA | [-] | -62.3 | -14.9 | 19.0 | 0.897 | 0.161 | 0.392 | 0.899 | 0.461 | ||
| I63_CRUJRA | [-] | -62.3 | -14.9 | 19.0 | 0.897 | 0.161 | 0.393 | 0.899 | 0.461 | ||
| I65_CRUJRA | [-] | -62.5 | -15.1 | 19.2 | 0.897 | 0.153 | 0.387 | 0.899 | 0.457 | ||
| I67_GSWP3 | [-] | -57.4 | -10.0 | 15.7 | 1.04 | 0.322 | 0.394 | 0.894 | 0.501 |
Download Data |
Period Mean (original grids) [W m-2] |
Bias [W m-2] |
RMSE [W m-2] |
Phase Shift [months] |
Bias Score [1] |
RMSE Score [1] |
Seasonal Cycle Score [1] |
Overall Score [1] |
|||
|---|---|---|---|---|---|---|---|---|---|---|---|
| Benchmark | [-] | -54.8 | |||||||||
| I62_CRUJRA | [-] | -68.7 | -13.8 | 19.1 | 1.02 | 0.258 | 0.409 | 0.879 | 0.489 | ||
| I63_CRUJRA | [-] | -68.8 | -13.8 | 19.2 | 1.05 | 0.253 | 0.404 | 0.877 | 0.485 | ||
| I65_CRUJRA | [-] | -68.7 | -13.8 | 19.2 | 0.992 | 0.255 | 0.400 | 0.885 | 0.485 | ||
| I67_GSWP3 | [-] | -67.4 | -12.7 | 18.5 | 1.05 | 0.304 | 0.405 | 0.886 | 0.500 |
Download Data |
Period Mean (original grids) [W m-2] |
Bias [W m-2] |
RMSE [W m-2] |
Phase Shift [months] |
Bias Score [1] |
RMSE Score [1] |
Seasonal Cycle Score [1] |
Overall Score [1] |
|||
|---|---|---|---|---|---|---|---|---|---|---|---|
| Benchmark | [-] | -33.6 | |||||||||
| I62_CRUJRA | [-] | -43.4 | -9.78 | 14.6 | 0.517 | 0.211 | 0.242 | 0.965 | 0.415 | ||
| I63_CRUJRA | [-] | -43.5 | -9.91 | 14.6 | 0.517 | 0.205 | 0.248 | 0.965 | 0.417 | ||
| I65_CRUJRA | [-] | -44.5 | -10.9 | 17.5 | 0.517 | 0.119 | 0.0714 | 0.965 | 0.307 | ||
| I67_GSWP3 | [-] | -43.2 | -9.57 | 17.4 | 1.52 | 0.161 | 0.169 | 0.841 | 0.335 |
Download Data |
Period Mean (original grids) [W m-2] |
Bias [W m-2] |
RMSE [W m-2] |
Phase Shift [months] |
Bias Score [1] |
RMSE Score [1] |
Seasonal Cycle Score [1] |
Overall Score [1] |
|||
|---|---|---|---|---|---|---|---|---|---|---|---|
| Benchmark | [-] | -40.8 | |||||||||
| I62_CRUJRA | [-] | -62.5 | -21.8 | 24.6 | 1.02 | 0.119 | 0.498 | 0.887 | 0.500 | ||
| I63_CRUJRA | [-] | -62.5 | -21.8 | 24.5 | 1.02 | 0.119 | 0.501 | 0.887 | 0.502 | ||
| I65_CRUJRA | [-] | -62.4 | -21.7 | 24.4 | 1.02 | 0.126 | 0.497 | 0.887 | 0.502 | ||
| I67_GSWP3 | [-] | -60.0 | -19.2 | 22.8 | 1.15 | 0.199 | 0.441 | 0.879 | 0.490 |
Download Data |
Period Mean (original grids) [W m-2] |
Bias [W m-2] |
RMSE [W m-2] |
Phase Shift [months] |
Bias Score [1] |
RMSE Score [1] |
Seasonal Cycle Score [1] |
Overall Score [1] |
|||
|---|---|---|---|---|---|---|---|---|---|---|---|
| Benchmark | [-] | -49.4 | |||||||||
| I62_CRUJRA | [-] | -52.0 | -2.67 | 10.5 | 0.148 | 0.672 | 0.355 | 0.990 | 0.593 | ||
| I63_CRUJRA | [-] | -52.2 | -2.80 | 10.5 | 0.590 | 0.667 | 0.357 | 0.960 | 0.585 | ||
| I65_CRUJRA | [-] | -53.6 | -4.20 | 10.9 | 0.148 | 0.583 | 0.359 | 0.990 | 0.573 | ||
| I67_GSWP3 | [-] | -51.4 | -2.07 | 10.9 | 0.443 | 0.665 | 0.356 | 0.970 | 0.587 |
Download Data |
Period Mean (original grids) [W m-2] |
Bias [W m-2] |
RMSE [W m-2] |
Phase Shift [months] |
Bias Score [1] |
RMSE Score [1] |
Seasonal Cycle Score [1] |
Overall Score [1] |
|||
|---|---|---|---|---|---|---|---|---|---|---|---|
| Benchmark | [-] | -80.7 | |||||||||
| I62_CRUJRA | [-] | -85.9 | -5.20 | 17.2 | 1.81 | 0.618 | 0.278 | 0.760 | 0.483 | ||
| I63_CRUJRA | [-] | -86.1 | -5.41 | 18.0 | 1.81 | 0.596 | 0.244 | 0.760 | 0.461 | ||
| I65_CRUJRA | [-] | -86.5 | -5.73 | 18.0 | 1.81 | 0.592 | 0.248 | 0.760 | 0.462 | ||
| I67_GSWP3 | [-] | -90.2 | -9.50 | 19.9 | 1.52 | 0.561 | 0.318 | 0.806 | 0.501 |
Download Data |
Period Mean (original grids) [W m-2] |
Bias [W m-2] |
RMSE [W m-2] |
Phase Shift [months] |
Bias Score [1] |
RMSE Score [1] |
Seasonal Cycle Score [1] |
Overall Score [1] |
|||
|---|---|---|---|---|---|---|---|---|---|---|---|
| Benchmark | [-] | -35.2 | |||||||||
| I62_CRUJRA | [-] | -42.6 | -7.42 | 8.55 | 1.51 | 0.550 | 0.800 | 0.753 | 0.726 | ||
| I63_CRUJRA | [-] | -42.6 | -7.42 | 8.55 | 1.51 | 0.550 | 0.800 | 0.753 | 0.726 | ||
| I65_CRUJRA | [-] | -41.9 | -6.73 | 7.97 | 1.51 | 0.592 | 0.796 | 0.753 | 0.734 | ||
| I67_GSWP3 | [-] | -45.7 | -10.5 | 10.8 | 0.983 | 0.364 | 0.704 | 0.937 | 0.677 |
Temporally integrated period mean