Mean State
Download Data |
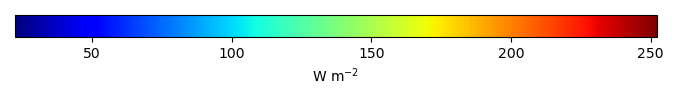
Period Mean (original grids) [W m-2] |
Model Period Mean (intersection) [W m-2] |
Benchmark Period Mean (intersection) [W m-2] |
Model Period Mean (complement) [W m-2] |
Benchmark Period Mean (complement) [W m-2] |
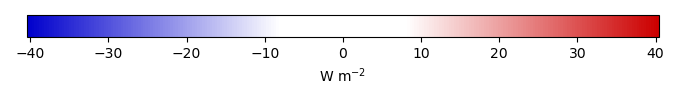
Bias [W m-2] |
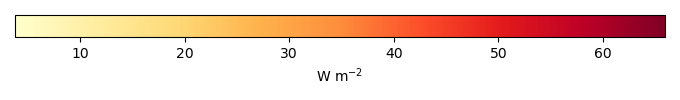
RMSE [W m-2] |
Phase Shift [months] |
Bias Score [1] |
RMSE Score [1] |
Seasonal Cycle Score [1] |
Spatial Distribution Score [1] |
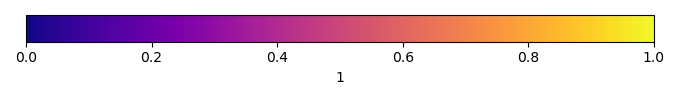
Overall Score [1] |
|||
|---|---|---|---|---|---|---|---|---|---|---|---|---|---|---|---|---|
| Benchmark | [-] | 184. | ||||||||||||||
| I62_CRUJRA | [-] | 179. | 179. | 183. | 204. | -5.15 | 24.7 | 2.25 | 0.457 | 0.289 | 0.658 | 0.947 | 0.528 | |||
| I63_CRUJRA | [-] | 179. | 179. | 183. | 204. | -5.15 | 24.7 | 2.25 | 0.457 | 0.289 | 0.658 | 0.947 | 0.528 | |||
| I65_CRUJRA | [-] | 179. | 179. | 183. | 204. | -4.78 | 24.6 | 2.25 | 0.463 | 0.287 | 0.657 | 0.947 | 0.528 | |||
| I67_GSWP3 | [-] | 176. | 176. | 184. | 205. | -7.18 | 12.4 | 0.809 | 0.608 | 0.762 | 0.900 | 0.904 | 0.787 |
Download Data |
Period Mean (original grids) [W m-2] |
Model Period Mean (intersection) [W m-2] |
Benchmark Period Mean (intersection) [W m-2] |
Model Period Mean (complement) [W m-2] |
Benchmark Period Mean (complement) [W m-2] |
Bias [W m-2] |
RMSE [W m-2] |
Phase Shift [months] |
Bias Score [1] |
RMSE Score [1] |
Seasonal Cycle Score [1] |
Spatial Distribution Score [1] |
Overall Score [1] |
|||
|---|---|---|---|---|---|---|---|---|---|---|---|---|---|---|---|---|
| Benchmark | [-] | 198. | ||||||||||||||
| I62_CRUJRA | [-] | 194. | 194. | 198. | 216. | -3.78 | 28.4 | 2.01 | 0.397 | 0.173 | 0.693 | 0.936 | 0.474 | |||
| I63_CRUJRA | [-] | 194. | 194. | 198. | 216. | -3.78 | 28.4 | 2.01 | 0.397 | 0.173 | 0.693 | 0.936 | 0.474 | |||
| I65_CRUJRA | [-] | 195. | 195. | 198. | 216. | -2.86 | 28.7 | 2.14 | 0.393 | 0.160 | 0.668 | 0.934 | 0.463 | |||
| I67_GSWP3 | [-] | 194. | 194. | 198. | 196. | -4.12 | 11.5 | 0.908 | 0.587 | 0.714 | 0.875 | 0.837 | 0.745 |
Download Data |
Period Mean (original grids) [W m-2] |
Model Period Mean (intersection) [W m-2] |
Benchmark Period Mean (intersection) [W m-2] |
Model Period Mean (complement) [W m-2] |
Benchmark Period Mean (complement) [W m-2] |
Bias [W m-2] |
RMSE [W m-2] |
Phase Shift [months] |
Bias Score [1] |
RMSE Score [1] |
Seasonal Cycle Score [1] |
Spatial Distribution Score [1] |
Overall Score [1] |
|||
|---|---|---|---|---|---|---|---|---|---|---|---|---|---|---|---|---|
| Benchmark | [-] | 201. | ||||||||||||||
| I62_CRUJRA | [-] | 191. | 191. | 200. | 219. | -8.76 | 19.2 | 1.49 | 0.438 | 0.528 | 0.785 | 0.999 | 0.656 | |||
| I63_CRUJRA | [-] | 191. | 191. | 200. | 219. | -8.76 | 19.2 | 1.48 | 0.438 | 0.528 | 0.785 | 0.999 | 0.656 | |||
| I65_CRUJRA | [-] | 191. | 191. | 200. | 219. | -8.47 | 19.1 | 1.49 | 0.446 | 0.519 | 0.785 | 0.999 | 0.654 | |||
| I67_GSWP3 | [-] | 194. | 194. | 200. | 219. | -7.47 | 11.6 | 0.645 | 0.671 | 0.770 | 0.924 | 0.956 | 0.818 |
Download Data |
Period Mean (original grids) [W m-2] |
Model Period Mean (intersection) [W m-2] |
Benchmark Period Mean (intersection) [W m-2] |
Model Period Mean (complement) [W m-2] |
Benchmark Period Mean (complement) [W m-2] |
Bias [W m-2] |
RMSE [W m-2] |
Phase Shift [months] |
Bias Score [1] |
RMSE Score [1] |
Seasonal Cycle Score [1] |
Spatial Distribution Score [1] |
Overall Score [1] |
|||
|---|---|---|---|---|---|---|---|---|---|---|---|---|---|---|---|---|
| Benchmark | [-] | 71.2 | ||||||||||||||
| I62_CRUJRA | [-] | 69.3 | 69.4 | 71.0 | 73.0 | -2.15 | 13.7 | 0.187 | 0.734 | 0.536 | 0.988 | 0.917 | 0.742 | |||
| I63_CRUJRA | [-] | 67.6 | 67.7 | 71.0 | 73.0 | -3.77 | 12.8 | 0.190 | 0.698 | 0.587 | 0.987 | 0.937 | 0.759 | |||
| I65_CRUJRA | [-] | 68.8 | 68.8 | 71.0 | 73.0 | -2.73 | 13.5 | 0.193 | 0.724 | 0.545 | 0.987 | 0.925 | 0.745 | |||
| I67_GSWP3 | [-] | 72.7 | 72.8 | 70.4 | 67.4 | 1.80 | 12.2 | 0.253 | 0.706 | 0.626 | 0.983 | 0.959 | 0.780 |
Download Data |
Period Mean (original grids) [W m-2] |
Model Period Mean (intersection) [W m-2] |
Benchmark Period Mean (intersection) [W m-2] |
Model Period Mean (complement) [W m-2] |
Benchmark Period Mean (complement) [W m-2] |
Bias [W m-2] |
RMSE [W m-2] |
Phase Shift [months] |
Bias Score [1] |
RMSE Score [1] |
Seasonal Cycle Score [1] |
Spatial Distribution Score [1] |
Overall Score [1] |
|||
|---|---|---|---|---|---|---|---|---|---|---|---|---|---|---|---|---|
| Benchmark | [-] | 190. | ||||||||||||||
| I62_CRUJRA | [-] | 187. | 187. | 186. | 204. | 3.76 | 18.2 | 1.78 | 0.502 | 0.649 | 0.736 | 0.995 | 0.706 | |||
| I63_CRUJRA | [-] | 187. | 187. | 186. | 204. | 3.76 | 18.2 | 1.78 | 0.502 | 0.649 | 0.736 | 0.995 | 0.706 | |||
| I65_CRUJRA | [-] | 188. | 188. | 186. | 204. | 4.18 | 18.4 | 1.78 | 0.498 | 0.648 | 0.737 | 0.995 | 0.705 | |||
| I67_GSWP3 | [-] | 168. | 168. | 189. | 208. | -16.1 | 18.0 | 0.977 | 0.465 | 0.814 | 0.850 | 0.924 | 0.773 |
Download Data |
Period Mean (original grids) [W m-2] |
Model Period Mean (intersection) [W m-2] |
Benchmark Period Mean (intersection) [W m-2] |
Model Period Mean (complement) [W m-2] |
Benchmark Period Mean (complement) [W m-2] |
Bias [W m-2] |
RMSE [W m-2] |
Phase Shift [months] |
Bias Score [1] |
RMSE Score [1] |
Seasonal Cycle Score [1] |
Spatial Distribution Score [1] |
Overall Score [1] |
|||
|---|---|---|---|---|---|---|---|---|---|---|---|---|---|---|---|---|
| Benchmark | [-] | 100. | ||||||||||||||
| I62_CRUJRA | [-] | 96.6 | 96.4 | 99.9 | 117. | -3.41 | 12.7 | 0.385 | 0.603 | 0.576 | 0.973 | 0.996 | 0.745 | |||
| I63_CRUJRA | [-] | 96.2 | 96.0 | 99.9 | 117. | -3.77 | 12.7 | 0.378 | 0.598 | 0.576 | 0.974 | 0.995 | 0.744 | |||
| I65_CRUJRA | [-] | 97.0 | 96.8 | 99.9 | 117. | -3.01 | 13.3 | 0.388 | 0.600 | 0.551 | 0.973 | 0.996 | 0.734 | |||
| I67_GSWP3 | [-] | 99.3 | 99.3 | 99.3 | 118. | 0.324 | 7.75 | 0.186 | 0.810 | 0.726 | 0.988 | 0.981 | 0.846 |
Download Data |
Period Mean (original grids) [W m-2] |
Model Period Mean (intersection) [W m-2] |
Benchmark Period Mean (intersection) [W m-2] |
Model Period Mean (complement) [W m-2] |
Benchmark Period Mean (complement) [W m-2] |
Bias [W m-2] |
RMSE [W m-2] |
Phase Shift [months] |
Bias Score [1] |
RMSE Score [1] |
Seasonal Cycle Score [1] |
Spatial Distribution Score [1] |
Overall Score [1] |
|||
|---|---|---|---|---|---|---|---|---|---|---|---|---|---|---|---|---|
| Benchmark | [-] | 140. | ||||||||||||||
| I62_CRUJRA | [-] | 141. | 140. | 140. | 154. | 0.396 | 15.6 | 0.593 | 0.500 | 0.520 | 0.943 | 0.930 | 0.683 | |||
| I63_CRUJRA | [-] | 140. | 140. | 140. | 154. | 0.189 | 15.5 | 0.593 | 0.505 | 0.521 | 0.943 | 0.934 | 0.685 | |||
| I65_CRUJRA | [-] | 141. | 140. | 140. | 154. | 0.448 | 15.6 | 0.597 | 0.499 | 0.517 | 0.943 | 0.929 | 0.681 | |||
| I67_GSWP3 | [-] | 135. | 135. | 140. | 156. | -4.56 | 12.1 | 0.321 | 0.560 | 0.604 | 0.974 | 0.998 | 0.748 |
Download Data |
Period Mean (original grids) [W m-2] |
Model Period Mean (intersection) [W m-2] |
Benchmark Period Mean (intersection) [W m-2] |
Model Period Mean (complement) [W m-2] |
Benchmark Period Mean (complement) [W m-2] |
Bias [W m-2] |
RMSE [W m-2] |
Phase Shift [months] |
Bias Score [1] |
RMSE Score [1] |
Seasonal Cycle Score [1] |
Spatial Distribution Score [1] |
Overall Score [1] |
|||
|---|---|---|---|---|---|---|---|---|---|---|---|---|---|---|---|---|
| Benchmark | [-] | 182. | ||||||||||||||
| I62_CRUJRA | [-] | 178. | 178. | 180. | 205. | -1.66 | 18.6 | 0.568 | 0.573 | 0.478 | 0.949 | 0.999 | 0.695 | |||
| I63_CRUJRA | [-] | 178. | 178. | 180. | 205. | -1.69 | 18.6 | 0.568 | 0.573 | 0.478 | 0.949 | 0.998 | 0.695 | |||
| I65_CRUJRA | [-] | 178. | 178. | 180. | 205. | -1.57 | 18.6 | 0.569 | 0.574 | 0.477 | 0.949 | 0.999 | 0.695 | |||
| I67_GSWP3 | [-] | 170. | 170. | 181. | 210. | -9.76 | 16.1 | 0.338 | 0.501 | 0.655 | 0.970 | 0.846 | 0.726 |
Download Data |
Period Mean (original grids) [W m-2] |
Model Period Mean (intersection) [W m-2] |
Benchmark Period Mean (intersection) [W m-2] |
Model Period Mean (complement) [W m-2] |
Benchmark Period Mean (complement) [W m-2] |
Bias [W m-2] |
RMSE [W m-2] |
Phase Shift [months] |
Bias Score [1] |
RMSE Score [1] |
Seasonal Cycle Score [1] |
Spatial Distribution Score [1] |
Overall Score [1] |
|||
|---|---|---|---|---|---|---|---|---|---|---|---|---|---|---|---|---|
| Benchmark | [-] | 63.6 | ||||||||||||||
| I62_CRUJRA | [-] | 62.4 | 62.7 | 64.0 | 54.2 | -2.31 | 11.5 | 0.177 | 0.731 | 0.606 | 0.988 | 0.992 | 0.785 | |||
| I63_CRUJRA | [-] | 60.8 | 61.2 | 64.0 | 54.2 | -3.81 | 11.0 | 0.166 | 0.693 | 0.639 | 0.989 | 0.997 | 0.792 | |||
| I65_CRUJRA | [-] | 61.9 | 62.2 | 64.0 | 54.2 | -2.79 | 11.5 | 0.169 | 0.721 | 0.606 | 0.989 | 0.996 | 0.784 | |||
| I67_GSWP3 | [-] | 66.4 | 66.8 | 62.8 | 58.3 | 2.34 | 10.1 | 0.208 | 0.779 | 0.663 | 0.986 | 0.990 | 0.816 |
Download Data |
Period Mean (original grids) [W m-2] |
Model Period Mean (intersection) [W m-2] |
Benchmark Period Mean (intersection) [W m-2] |
Model Period Mean (complement) [W m-2] |
Benchmark Period Mean (complement) [W m-2] |
Bias [W m-2] |
RMSE [W m-2] |
Phase Shift [months] |
Bias Score [1] |
RMSE Score [1] |
Seasonal Cycle Score [1] |
Spatial Distribution Score [1] |
Overall Score [1] |
|||
|---|---|---|---|---|---|---|---|---|---|---|---|---|---|---|---|---|
| Benchmark | [-] | 199. | ||||||||||||||
| I62_CRUJRA | [-] | 198. | 198. | 199. | 197. | -2.87 | 12.0 | 0.704 | 0.598 | 0.641 | 0.942 | 0.976 | 0.760 | |||
| I63_CRUJRA | [-] | 198. | 198. | 199. | 197. | -2.87 | 12.0 | 0.704 | 0.598 | 0.641 | 0.942 | 0.976 | 0.760 | |||
| I65_CRUJRA | [-] | 198. | 198. | 199. | 197. | -2.57 | 11.9 | 0.723 | 0.609 | 0.636 | 0.940 | 0.978 | 0.760 | |||
| I67_GSWP3 | [-] | 189. | 189. | 199. | 212. | -12.3 | 14.5 | 0.374 | 0.382 | 0.743 | 0.970 | 0.997 | 0.767 |
Download Data |
Period Mean (original grids) [W m-2] |
Model Period Mean (intersection) [W m-2] |
Benchmark Period Mean (intersection) [W m-2] |
Model Period Mean (complement) [W m-2] |
Benchmark Period Mean (complement) [W m-2] |
Bias [W m-2] |
RMSE [W m-2] |
Phase Shift [months] |
Bias Score [1] |
RMSE Score [1] |
Seasonal Cycle Score [1] |
Spatial Distribution Score [1] |
Overall Score [1] |
|||
|---|---|---|---|---|---|---|---|---|---|---|---|---|---|---|---|---|
| Benchmark | [-] | 123. | ||||||||||||||
| I62_CRUJRA | [-] | 122. | 122. | 120. | 148. | 3.13 | 15.5 | 0.232 | 0.463 | 0.502 | 0.984 | 0.990 | 0.688 | |||
| I63_CRUJRA | [-] | 122. | 122. | 120. | 148. | 3.02 | 15.5 | 0.233 | 0.467 | 0.501 | 0.984 | 0.991 | 0.689 | |||
| I65_CRUJRA | [-] | 122. | 123. | 120. | 148. | 3.32 | 15.9 | 0.236 | 0.455 | 0.486 | 0.984 | 0.990 | 0.680 | |||
| I67_GSWP3 | [-] | 110. | 110. | 121. | 152. | -7.79 | 11.3 | 0.228 | 0.547 | 0.717 | 0.985 | 0.981 | 0.789 |
Download Data |
Period Mean (original grids) [W m-2] |
Model Period Mean (intersection) [W m-2] |
Benchmark Period Mean (intersection) [W m-2] |
Model Period Mean (complement) [W m-2] |
Benchmark Period Mean (complement) [W m-2] |
Bias [W m-2] |
RMSE [W m-2] |
Phase Shift [months] |
Bias Score [1] |
RMSE Score [1] |
Seasonal Cycle Score [1] |
Spatial Distribution Score [1] |
Overall Score [1] |
|||
|---|---|---|---|---|---|---|---|---|---|---|---|---|---|---|---|---|
| Benchmark | [-] | 144. | ||||||||||||||
| I62_CRUJRA | [-] | 141. | 141. | 142. | 174. | -0.561 | 20.2 | 0.780 | 0.492 | 0.539 | 0.908 | 0.942 | 0.684 | |||
| I63_CRUJRA | [-] | 141. | 141. | 142. | 174. | -0.822 | 20.2 | 0.778 | 0.488 | 0.540 | 0.908 | 0.944 | 0.684 | |||
| I65_CRUJRA | [-] | 141. | 141. | 142. | 174. | -0.374 | 20.2 | 0.789 | 0.493 | 0.533 | 0.906 | 0.943 | 0.682 | |||
| I67_GSWP3 | [-] | 136. | 135. | 143. | 189. | -6.78 | 12.7 | 0.386 | 0.559 | 0.701 | 0.960 | 0.995 | 0.783 |
Download Data |
Period Mean (original grids) [W m-2] |
Model Period Mean (intersection) [W m-2] |
Benchmark Period Mean (intersection) [W m-2] |
Model Period Mean (complement) [W m-2] |
Benchmark Period Mean (complement) [W m-2] |
Bias [W m-2] |
RMSE [W m-2] |
Phase Shift [months] |
Bias Score [1] |
RMSE Score [1] |
Seasonal Cycle Score [1] |
Spatial Distribution Score [1] |
Overall Score [1] |
|||
|---|---|---|---|---|---|---|---|---|---|---|---|---|---|---|---|---|
| Benchmark | [-] | 178. | ||||||||||||||
| I62_CRUJRA | [-] | 166. | 166. | 176. | 222. | -9.01 | 17.7 | 0.713 | 0.385 | 0.583 | 0.926 | 0.983 | 0.692 | |||
| I63_CRUJRA | [-] | 166. | 166. | 176. | 222. | -9.02 | 17.7 | 0.713 | 0.385 | 0.583 | 0.926 | 0.983 | 0.692 | |||
| I65_CRUJRA | [-] | 166. | 166. | 176. | 222. | -8.98 | 17.7 | 0.716 | 0.385 | 0.583 | 0.925 | 0.983 | 0.692 | |||
| I67_GSWP3 | [-] | 163. | 163. | 177. | 228. | -12.8 | 17.5 | 0.243 | 0.359 | 0.690 | 0.981 | 0.861 | 0.716 |
Download Data |
Period Mean (original grids) [W m-2] |
Model Period Mean (intersection) [W m-2] |
Benchmark Period Mean (intersection) [W m-2] |
Model Period Mean (complement) [W m-2] |
Benchmark Period Mean (complement) [W m-2] |
Bias [W m-2] |
RMSE [W m-2] |
Phase Shift [months] |
Bias Score [1] |
RMSE Score [1] |
Seasonal Cycle Score [1] |
Spatial Distribution Score [1] |
Overall Score [1] |
|||
|---|---|---|---|---|---|---|---|---|---|---|---|---|---|---|---|---|
| Benchmark | [-] | 70.2 | ||||||||||||||
| I62_CRUJRA | [-] | 70.8 | 70.6 | 70.1 | 71.1 | -0.592 | 11.4 | 0.116 | 0.714 | 0.628 | 0.992 | 0.997 | 0.792 | |||
| I63_CRUJRA | [-] | 69.0 | 68.9 | 70.1 | 71.1 | -2.32 | 11.7 | 0.0943 | 0.690 | 0.621 | 0.994 | 0.993 | 0.784 | |||
| I65_CRUJRA | [-] | 70.5 | 70.3 | 70.1 | 71.1 | -0.853 | 11.7 | 0.108 | 0.713 | 0.614 | 0.993 | 0.997 | 0.786 | |||
| I67_GSWP3 | [-] | 71.9 | 71.8 | 69.5 | 62.0 | 0.701 | 11.2 | 0.0949 | 0.719 | 0.658 | 0.994 | 0.991 | 0.804 |
Download Data |
Period Mean (original grids) [W m-2] |
Model Period Mean (intersection) [W m-2] |
Benchmark Period Mean (intersection) [W m-2] |
Model Period Mean (complement) [W m-2] |
Benchmark Period Mean (complement) [W m-2] |
Bias [W m-2] |
RMSE [W m-2] |
Phase Shift [months] |
Bias Score [1] |
RMSE Score [1] |
Seasonal Cycle Score [1] |
Spatial Distribution Score [1] |
Overall Score [1] |
|||
|---|---|---|---|---|---|---|---|---|---|---|---|---|---|---|---|---|
| Benchmark | [-] | 204. | ||||||||||||||
| I62_CRUJRA | [-] | 190. | 190. | 201. | 219. | -9.90 | 25.6 | 1.23 | 0.264 | 0.479 | 0.838 | 0.904 | 0.593 | |||
| I63_CRUJRA | [-] | 190. | 190. | 201. | 219. | -9.90 | 25.6 | 1.23 | 0.264 | 0.479 | 0.838 | 0.904 | 0.593 | |||
| I65_CRUJRA | [-] | 190. | 190. | 201. | 219. | -9.69 | 25.6 | 1.24 | 0.268 | 0.476 | 0.836 | 0.898 | 0.591 | |||
| I67_GSWP3 | [-] | 187. | 188. | 203. | 218. | -13.8 | 16.7 | 0.434 | 0.447 | 0.769 | 0.951 | 0.937 | 0.775 |
Download Data |
Period Mean (original grids) [W m-2] |
Model Period Mean (intersection) [W m-2] |
Benchmark Period Mean (intersection) [W m-2] |
Model Period Mean (complement) [W m-2] |
Benchmark Period Mean (complement) [W m-2] |
Bias [W m-2] |
RMSE [W m-2] |
Phase Shift [months] |
Bias Score [1] |
RMSE Score [1] |
Seasonal Cycle Score [1] |
Spatial Distribution Score [1] |
Overall Score [1] |
|||
|---|---|---|---|---|---|---|---|---|---|---|---|---|---|---|---|---|
| Benchmark | [-] | 152. | ||||||||||||||
| I62_CRUJRA | [-] | 144. | 144. | 150. | 192. | -4.97 | 12.5 | 0.517 | 0.681 | 0.573 | 0.965 | 0.945 | 0.747 | |||
| I63_CRUJRA | [-] | 144. | 144. | 150. | 192. | -5.12 | 12.6 | 0.517 | 0.676 | 0.571 | 0.965 | 0.949 | 0.746 | |||
| I65_CRUJRA | [-] | 145. | 145. | 150. | 192. | -4.60 | 12.4 | 0.515 | 0.695 | 0.571 | 0.965 | 0.951 | 0.751 | |||
| I67_GSWP3 | [-] | 141. | 141. | 151. | 198. | -8.12 | 9.95 | 0.263 | 0.552 | 0.768 | 0.982 | 0.967 | 0.808 |
Download Data |
Period Mean (original grids) [W m-2] |
Model Period Mean (intersection) [W m-2] |
Benchmark Period Mean (intersection) [W m-2] |
Model Period Mean (complement) [W m-2] |
Benchmark Period Mean (complement) [W m-2] |
Bias [W m-2] |
RMSE [W m-2] |
Phase Shift [months] |
Bias Score [1] |
RMSE Score [1] |
Seasonal Cycle Score [1] |
Spatial Distribution Score [1] |
Overall Score [1] |
|||
|---|---|---|---|---|---|---|---|---|---|---|---|---|---|---|---|---|
| Benchmark | [-] | 111. | ||||||||||||||
| I62_CRUJRA | [-] | 111. | 111. | 111. | 117. | 0.0587 | 10.7 | 0.312 | 0.720 | 0.612 | 0.979 | 0.999 | 0.784 | |||
| I63_CRUJRA | [-] | 111. | 111. | 111. | 117. | -0.250 | 10.8 | 0.312 | 0.714 | 0.606 | 0.979 | 0.999 | 0.781 | |||
| I65_CRUJRA | [-] | 112. | 112. | 111. | 117. | 0.894 | 11.4 | 0.320 | 0.715 | 0.584 | 0.979 | 0.999 | 0.772 | |||
| I67_GSWP3 | [-] | 107. | 107. | 110. | 134. | -3.57 | 8.95 | 0.111 | 0.656 | 0.707 | 0.992 | 0.977 | 0.808 |
Download Data |
Period Mean (original grids) [W m-2] |
Model Period Mean (intersection) [W m-2] |
Benchmark Period Mean (intersection) [W m-2] |
Model Period Mean (complement) [W m-2] |
Benchmark Period Mean (complement) [W m-2] |
Bias [W m-2] |
RMSE [W m-2] |
Phase Shift [months] |
Bias Score [1] |
RMSE Score [1] |
Seasonal Cycle Score [1] |
Spatial Distribution Score [1] |
Overall Score [1] |
|||
|---|---|---|---|---|---|---|---|---|---|---|---|---|---|---|---|---|
| Benchmark | [-] | 165. | ||||||||||||||
| I62_CRUJRA | [-] | 152. | 152. | 165. | 167. | -12.7 | 16.4 | 0.282 | 0.301 | 0.568 | 0.981 | 0.963 | 0.676 | |||
| I63_CRUJRA | [-] | 151. | 151. | 165. | 167. | -13.0 | 16.7 | 0.282 | 0.286 | 0.562 | 0.981 | 0.966 | 0.671 | |||
| I65_CRUJRA | [-] | 152. | 152. | 165. | 167. | -12.2 | 16.2 | 0.287 | 0.317 | 0.562 | 0.981 | 0.964 | 0.677 | |||
| I67_GSWP3 | [-] | 157. | 157. | 164. | 173. | -6.65 | 10.9 | 0.142 | 0.523 | 0.679 | 0.991 | 0.965 | 0.767 |
Download Data |
Period Mean (original grids) [W m-2] |
Model Period Mean (intersection) [W m-2] |
Benchmark Period Mean (intersection) [W m-2] |
Model Period Mean (complement) [W m-2] |
Benchmark Period Mean (complement) [W m-2] |
Bias [W m-2] |
RMSE [W m-2] |
Phase Shift [months] |
Bias Score [1] |
RMSE Score [1] |
Seasonal Cycle Score [1] |
Spatial Distribution Score [1] |
Overall Score [1] |
|||
|---|---|---|---|---|---|---|---|---|---|---|---|---|---|---|---|---|
| Benchmark | [-] | 176. | ||||||||||||||
| I62_CRUJRA | [-] | 163. | 163. | 175. | 218. | -11.4 | 22.8 | 1.48 | 0.275 | 0.643 | 0.787 | 0.979 | 0.665 | |||
| I63_CRUJRA | [-] | 163. | 163. | 175. | 218. | -11.4 | 22.8 | 1.48 | 0.275 | 0.643 | 0.787 | 0.979 | 0.665 | |||
| I65_CRUJRA | [-] | 163. | 163. | 175. | 218. | -11.1 | 22.7 | 1.48 | 0.279 | 0.642 | 0.787 | 0.979 | 0.666 | |||
| I67_GSWP3 | [-] | 166. | 166. | 175. | 226. | -8.21 | 12.0 | 0.723 | 0.577 | 0.820 | 0.908 | 0.888 | 0.803 |
Download Data |
Period Mean (original grids) [W m-2] |
Model Period Mean (intersection) [W m-2] |
Benchmark Period Mean (intersection) [W m-2] |
Model Period Mean (complement) [W m-2] |
Benchmark Period Mean (complement) [W m-2] |
Bias [W m-2] |
RMSE [W m-2] |
Phase Shift [months] |
Bias Score [1] |
RMSE Score [1] |
Seasonal Cycle Score [1] |
Spatial Distribution Score [1] |
Overall Score [1] |
|||
|---|---|---|---|---|---|---|---|---|---|---|---|---|---|---|---|---|
| Benchmark | [-] | 185. | ||||||||||||||
| I62_CRUJRA | [-] | 174. | 174. | 184. | 203. | -10.4 | 17.8 | 1.01 | 0.403 | 0.672 | 0.878 | 0.937 | 0.712 | |||
| I63_CRUJRA | [-] | 174. | 174. | 184. | 203. | -10.4 | 17.8 | 1.01 | 0.403 | 0.672 | 0.878 | 0.937 | 0.712 | |||
| I65_CRUJRA | [-] | 174. | 174. | 184. | 203. | -10.1 | 17.7 | 1.03 | 0.403 | 0.669 | 0.875 | 0.934 | 0.710 | |||
| I67_GSWP3 | [-] | 176. | 177. | 184. | 212. | -8.11 | 12.1 | 0.506 | 0.623 | 0.750 | 0.943 | 0.978 | 0.809 |
Download Data |
Period Mean (original grids) [W m-2] |
Model Period Mean (intersection) [W m-2] |
Benchmark Period Mean (intersection) [W m-2] |
Model Period Mean (complement) [W m-2] |
Benchmark Period Mean (complement) [W m-2] |
Bias [W m-2] |
RMSE [W m-2] |
Phase Shift [months] |
Bias Score [1] |
RMSE Score [1] |
Seasonal Cycle Score [1] |
Spatial Distribution Score [1] |
Overall Score [1] |
|||
|---|---|---|---|---|---|---|---|---|---|---|---|---|---|---|---|---|
| Benchmark | [-] | 178. | ||||||||||||||
| I62_CRUJRA | [-] | 178. | 177. | 179. | 170. | -4.60 | 27.0 | 0.700 | 0.311 | 0.396 | 0.938 | 0.805 | 0.569 | |||
| I63_CRUJRA | [-] | 178. | 177. | 179. | 170. | -4.66 | 27.1 | 0.700 | 0.310 | 0.395 | 0.938 | 0.804 | 0.568 | |||
| I65_CRUJRA | [-] | 178. | 177. | 179. | 170. | -4.59 | 27.0 | 0.698 | 0.312 | 0.396 | 0.938 | 0.805 | 0.569 | |||
| I67_GSWP3 | [-] | 171. | 170. | 178. | 187. | -10.4 | 18.6 | 0.364 | 0.307 | 0.564 | 0.963 | 0.997 | 0.679 |
Temporally integrated period mean