Mean State
Download Data |
Period Mean (original grids) [Watt m-2] |
Bias [Watt m-2] |
RMSE [Watt m-2] |
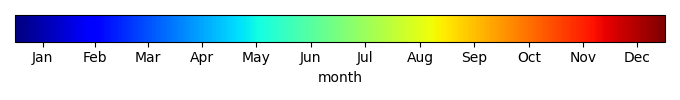
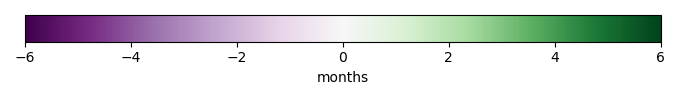
Phase Shift [months] |
Bias Score [1] |
RMSE Score [1] |
Seasonal Cycle Score [1] |
Overall Score [1] |
|||
|---|---|---|---|---|---|---|---|---|---|---|---|
| Benchmark | [-] | 202. | |||||||||
| I62_CRUJRA | [-] | 194. | 5.20 | 59.0 | 0.00 | 0.753 | 0.00 | 1.00 | 0.438 | ||
| I63_CRUJRA | [-] | 194. | 5.20 | 59.0 | 0.00 | 0.753 | 0.00 | 1.00 | 0.438 | ||
| I65_CRUJRA | [-] | 193. | 4.90 | 59.4 | 0.00 | 0.767 | 0.00 | 1.00 | 0.442 | ||
| I67_GSWP3 | [-] | 185. | 5.30 | 58.5 | 0.00 | 0.748 | 0.00 | 1.00 | 0.437 |
Download Data |
Period Mean (original grids) [Watt m-2] |
Bias [Watt m-2] |
RMSE [Watt m-2] |
Phase Shift [months] |
Bias Score [1] |
RMSE Score [1] |
Seasonal Cycle Score [1] |
Overall Score [1] |
|||
|---|---|---|---|---|---|---|---|---|---|---|---|
| Benchmark | [-] | 69.4 | |||||||||
| I62_CRUJRA | [-] | 125. | 43.1 | 71.9 | 0.00 | 0.00 | 0.0961 | 1.00 | 0.298 | ||
| I63_CRUJRA | [-] | 125. | 42.8 | 71.9 | 0.00 | 0.00 | 0.0944 | 1.00 | 0.297 | ||
| I65_CRUJRA | [-] | 125. | 43.3 | 72.1 | 0.00 | 0.00 | 0.0932 | 1.00 | 0.297 | ||
| I67_GSWP3 | [-] | 113. | 35.9 | 63.9 | 0.00 | 0.0912 | 0.277 | 1.00 | 0.412 |
Download Data |
Period Mean (original grids) [Watt m-2] |
Bias [Watt m-2] |
RMSE [Watt m-2] |
Phase Shift [months] |
Bias Score [1] |
RMSE Score [1] |
Seasonal Cycle Score [1] |
Overall Score [1] |
|||
|---|---|---|---|---|---|---|---|---|---|---|---|
| Benchmark | [-] | 120. | |||||||||
| I62_CRUJRA | [-] | 138. | 14.6 | 40.5 | 0.407 | 0.388 | 0.237 | 0.973 | 0.459 | ||
| I63_CRUJRA | [-] | 138. | 14.3 | 39.9 | 0.407 | 0.383 | 0.236 | 0.973 | 0.457 | ||
| I65_CRUJRA | [-] | 138. | 14.6 | 40.3 | 0.407 | 0.379 | 0.237 | 0.973 | 0.456 | ||
| I67_GSWP3 | [-] | 131. | 11.6 | 36.7 | 0.137 | 0.502 | 0.298 | 0.991 | 0.522 |
Download Data |
Period Mean (original grids) [Watt m-2] |
Bias [Watt m-2] |
RMSE [Watt m-2] |
Phase Shift [months] |
Bias Score [1] |
RMSE Score [1] |
Seasonal Cycle Score [1] |
Overall Score [1] |
|||
|---|---|---|---|---|---|---|---|---|---|---|---|
| Benchmark | [-] | 176. | |||||||||
| I62_CRUJRA | [-] | 176. | -6.85 | 14.1 | 1.02 | 0.595 | 0.467 | 0.933 | 0.616 | ||
| I63_CRUJRA | [-] | 176. | -6.85 | 14.1 | 1.02 | 0.595 | 0.467 | 0.933 | 0.616 | ||
| I65_CRUJRA | [-] | 176. | -6.85 | 14.1 | 1.02 | 0.596 | 0.467 | 0.933 | 0.616 | ||
| I67_GSWP3 | [-] | 167. | -14.5 | 18.5 | 0.00 | 0.146 | 0.490 | 1.00 | 0.532 |
Download Data |
Period Mean (original grids) [Watt m-2] |
Bias [Watt m-2] |
RMSE [Watt m-2] |
Phase Shift [months] |
Bias Score [1] |
RMSE Score [1] |
Seasonal Cycle Score [1] |
Overall Score [1] |
|||
|---|---|---|---|---|---|---|---|---|---|---|---|
| Benchmark | [-] | 62.8 | |||||||||
| I62_CRUJRA | [-] | 48.7 | -7.58 | 37.1 | 0.00 | 0.590 | 0.00 | 1.00 | 0.397 | ||
| I63_CRUJRA | [-] | 46.4 | -9.72 | 32.5 | 0.00 | 0.474 | 0.00 | 1.00 | 0.369 | ||
| I65_CRUJRA | [-] | 47.5 | -9.93 | 34.5 | 0.00 | 0.462 | 0.00 | 1.00 | 0.366 | ||
| I67_GSWP3 | [-] | 56.4 | 4.92 | 66.4 | 0.00 | 0.734 | 0.00 | 1.00 | 0.433 |
Download Data |
Period Mean (original grids) [Watt m-2] |
Bias [Watt m-2] |
RMSE [Watt m-2] |
Phase Shift [months] |
Bias Score [1] |
RMSE Score [1] |
Seasonal Cycle Score [1] |
Overall Score [1] |
|||
|---|---|---|---|---|---|---|---|---|---|---|---|
| Benchmark | [-] | 135. | |||||||||
| I62_CRUJRA | [-] | 144. | 5.66 | 21.5 | 0.813 | 0.248 | 0.279 | 0.946 | 0.438 | ||
| I63_CRUJRA | [-] | 144. | 5.37 | 21.3 | 0.813 | 0.243 | 0.281 | 0.946 | 0.438 | ||
| I65_CRUJRA | [-] | 145. | 5.93 | 21.4 | 0.813 | 0.249 | 0.280 | 0.946 | 0.439 | ||
| I67_GSWP3 | [-] | 141. | 1.97 | 18.5 | 0.203 | 0.459 | 0.326 | 0.987 | 0.524 |
Download Data |
Period Mean (original grids) [Watt m-2] |
Bias [Watt m-2] |
RMSE [Watt m-2] |
Phase Shift [months] |
Bias Score [1] |
RMSE Score [1] |
Seasonal Cycle Score [1] |
Overall Score [1] |
|||
|---|---|---|---|---|---|---|---|---|---|---|---|
| Benchmark | [-] | 151. | |||||||||
| I62_CRUJRA | [-] | 152. | 1.02 | 17.1 | 0.254 | 0.564 | 0.316 | 0.983 | 0.545 | ||
| I63_CRUJRA | [-] | 152. | 0.773 | 17.2 | 0.254 | 0.580 | 0.310 | 0.983 | 0.546 | ||
| I65_CRUJRA | [-] | 152. | 1.16 | 17.2 | 0.254 | 0.557 | 0.314 | 0.983 | 0.542 | ||
| I67_GSWP3 | [-] | 153. | 1.89 | 14.7 | 0.00 | 0.732 | 0.375 | 1.00 | 0.621 |
Temporally integrated period mean