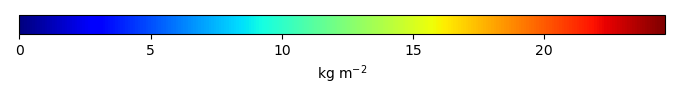
Mean State
Download Data |
Period Mean (original grids) [Pg] |
Model Period Mean (intersection) [Pg] |
Benchmark Period Mean (intersection) [Pg] |
Model Period Mean (complement) [Pg] |
Benchmark Period Mean (complement) [Pg] |
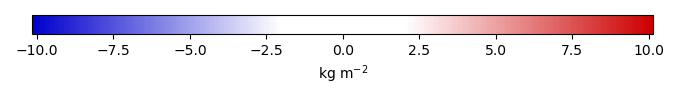
Bias [kg m-2] |
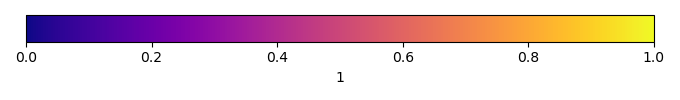
Bias Score [1] |
Spatial Distribution Score [1] |
Overall Score [1] |
|||
|---|---|---|---|---|---|---|---|---|---|---|---|---|
| Benchmark | [-] | 26.2 | ||||||||||
| 101 | [-] | 726. | 31.3 | 26.2 | 686. | 0.0243 | 1.13 | 0.385 | 0.903 | 0.644 | ||
| 105 | [-] | 504. | 24.0 | 26.2 | 474. | 0.0243 | 0.149 | 0.425 | 0.882 | 0.654 | ||
| 111 | [-] | 539. | 26.7 | 26.2 | 505. | 0.0243 | 0.466 | 0.424 | 0.908 | 0.666 | ||
| 112 | [-] | 520. | 25.3 | 26.2 | 488. | 0.0243 | 0.296 | 0.429 | 0.898 | 0.664 | ||
| 113 | [-] | 438. | 26.7 | 26.2 | 406. | 0.0243 | 0.493 | 0.422 | 0.906 | 0.664 | ||
| 114 | [-] | 523. | 25.9 | 26.2 | 490. | 0.0243 | 0.383 | 0.423 | 0.900 | 0.661 |
Download Data |
Period Mean (original grids) [Pg] |
Model Period Mean (intersection) [Pg] |
Benchmark Period Mean (intersection) [Pg] |
Model Period Mean (complement) [Pg] |
Benchmark Period Mean (complement) [Pg] |
Bias [kg m-2] |
Bias Score [1] |
Spatial Distribution Score [1] |
Overall Score [1] |
|||
|---|---|---|---|---|---|---|---|---|---|---|---|---|
| Benchmark | [-] | 0.00338 | ||||||||||
| 101 | [-] | 16.5 | 0.0706 | 0.00338 | 15.5 | 1.02 | 0.0142 | 0.0546 | 0.0344 | |||
| 105 | [-] | 11.7 | 0.0391 | 0.00338 | 11.0 | 0.588 | 0.0444 | 0.0914 | 0.0679 | |||
| 111 | [-] | 12.7 | 0.0478 | 0.00338 | 12.0 | 0.692 | 0.0181 | 0.0948 | 0.0564 | |||
| 112 | [-] | 12.2 | 0.0463 | 0.00338 | 11.4 | 0.674 | 0.0179 | 0.107 | 0.0624 | |||
| 113 | [-] | 8.34 | 0.0480 | 0.00338 | 7.87 | 0.701 | 0.0171 | 0.0960 | 0.0565 | |||
| 114 | [-] | 12.4 | 0.0488 | 0.00338 | 11.6 | 0.714 | 0.0172 | 0.0927 | 0.0550 |
Download Data |
Period Mean (original grids) [Pg] |
Model Period Mean (intersection) [Pg] |
Benchmark Period Mean (intersection) [Pg] |
Model Period Mean (complement) [Pg] |
Benchmark Period Mean (complement) [Pg] |
Bias [kg m-2] |
Bias Score [1] |
Spatial Distribution Score [1] |
Overall Score [1] |
|||
|---|---|---|---|---|---|---|---|---|---|---|---|---|
| Benchmark | [-] | 17.5 | ||||||||||
| 101 | [-] | 21.9 | 21.1 | 17.5 | 0.619 | 0.0228 | 1.50 | 0.491 | 0.918 | 0.705 | ||
| 105 | [-] | 16.3 | 15.8 | 17.5 | 0.464 | 0.0228 | 0.100 | 0.540 | 0.888 | 0.714 | ||
| 111 | [-] | 20.0 | 19.3 | 17.5 | 0.511 | 0.0228 | 0.954 | 0.547 | 0.937 | 0.742 | ||
| 112 | [-] | 19.0 | 18.4 | 17.5 | 0.487 | 0.0228 | 0.713 | 0.558 | 0.931 | 0.745 | ||
| 113 | [-] | 19.4 | 18.6 | 17.5 | 0.519 | 0.0228 | 0.805 | 0.547 | 0.926 | 0.737 | ||
| 114 | [-] | 18.4 | 17.8 | 17.5 | 0.495 | 0.0228 | 0.581 | 0.549 | 0.915 | 0.732 |
Download Data |
Period Mean (original grids) [Pg] |
Model Period Mean (intersection) [Pg] |
Benchmark Period Mean (intersection) [Pg] |
Model Period Mean (complement) [Pg] |
Benchmark Period Mean (complement) [Pg] |
Bias [kg m-2] |
Bias Score [1] |
Spatial Distribution Score [1] |
Overall Score [1] |
|||
|---|---|---|---|---|---|---|---|---|---|---|---|---|
| Benchmark | [-] | 0.222 | ||||||||||
| 101 | [-] | 51.5 | 0.825 | 0.222 | 50.5 | 8.00 | 0.152 | 0.557 | 0.355 | |||
| 105 | [-] | 39.7 | 0.640 | 0.222 | 38.8 | 5.72 | 0.204 | 0.638 | 0.421 | |||
| 111 | [-] | 38.2 | 0.737 | 0.222 | 37.3 | 6.81 | 0.170 | 0.678 | 0.424 | |||
| 112 | [-] | 35.0 | 0.697 | 0.222 | 34.1 | 6.31 | 0.188 | 0.702 | 0.445 | |||
| 113 | [-] | 40.1 | 0.693 | 0.222 | 39.3 | 6.28 | 0.186 | 0.705 | 0.445 | |||
| 114 | [-] | 39.9 | 0.674 | 0.222 | 39.1 | 6.06 | 0.197 | 0.697 | 0.447 |
Download Data |
Period Mean (original grids) [Pg] |
Model Period Mean (intersection) [Pg] |
Benchmark Period Mean (intersection) [Pg] |
Model Period Mean (complement) [Pg] |
Benchmark Period Mean (complement) [Pg] |
Bias [kg m-2] |
Bias Score [1] |
Spatial Distribution Score [1] |
Overall Score [1] |
|||
|---|---|---|---|---|---|---|---|---|---|---|---|---|
| Benchmark | [-] | 8.47 | ||||||||||
| 101 | [-] | 9.29 | 9.26 | 8.47 | 0.226 | 0.00149 | 0.570 | 0.285 | 0.902 | 0.593 | ||
| 105 | [-] | 7.52 | 7.53 | 8.47 | 0.162 | 0.00149 | 0.0577 | 0.314 | 0.875 | 0.595 | ||
| 111 | [-] | 6.53 | 6.55 | 8.47 | 0.162 | 0.00149 | -0.216 | 0.306 | 0.839 | 0.573 | ||
| 112 | [-] | 6.14 | 6.20 | 8.47 | 0.161 | 0.00149 | -0.306 | 0.305 | 0.816 | 0.560 | ||
| 113 | [-] | 7.36 | 7.35 | 8.47 | 0.177 | 0.00149 | 0.0135 | 0.302 | 0.867 | 0.584 | ||
| 114 | [-] | 7.41 | 7.40 | 8.47 | 0.177 | 0.00149 | 0.0258 | 0.302 | 0.869 | 0.585 |
Temporally integrated period mean