Mean State
Download Data |
Period Mean (original grids) [1] |
Model Period Mean (intersection) [1] |
Benchmark Period Mean (intersection) [1] |
Model Period Mean (complement) [1] |
Benchmark Period Mean (complement) [1] |
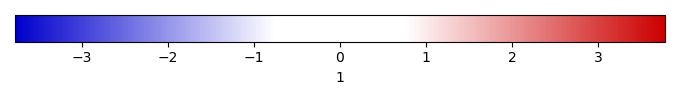
Bias [1] |
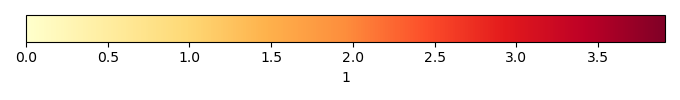
RMSE [1] |
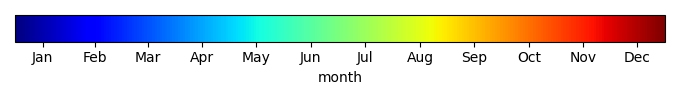
Phase Shift [months] |
Bias Score [1] |
RMSE Score [1] |
Seasonal Cycle Score [1] |
Spatial Distribution Score [1] |
Overall Score [1] |
|||
|---|---|---|---|---|---|---|---|---|---|---|---|---|---|---|---|---|
| Benchmark | [-] | 2.78 | ||||||||||||||
| 101 | [-] | 4.24 | 4.23 | 2.78 | 3.11 | 0.157 | 1.39 | 1.68 | 3.17 | 0.195 | 0.456 | 0.463 | 0.833 | 0.480 | ||
| 105 | [-] | 3.13 | 3.11 | 2.78 | 2.47 | 0.157 | 0.286 | 0.827 | 3.19 | 0.314 | 0.475 | 0.459 | 0.977 | 0.540 | ||
| 111 | [-] | 3.58 | 3.58 | 2.78 | 2.57 | 0.157 | 0.731 | 1.08 | 3.14 | 0.232 | 0.470 | 0.469 | 0.934 | 0.515 | ||
| 112 | [-] | 3.37 | 3.36 | 2.78 | 2.64 | 0.157 | 0.531 | 1.10 | 3.22 | 0.230 | 0.467 | 0.452 | 0.943 | 0.512 | ||
| 113 | [-] | 2.41 | 2.37 | 2.78 | 1.91 | 0.157 | -0.437 | 1.04 | 3.30 | 0.258 | 0.470 | 0.433 | 0.905 | 0.507 | ||
| 114 | [-] | 3.26 | 3.25 | 2.78 | 2.30 | 0.157 | 0.404 | 0.895 | 3.14 | 0.290 | 0.469 | 0.468 | 0.966 | 0.532 |
Download Data |
Period Mean (original grids) [1] |
Model Period Mean (intersection) [1] |
Benchmark Period Mean (intersection) [1] |
Model Period Mean (complement) [1] |
Benchmark Period Mean (complement) [1] |
Bias [1] |
RMSE [1] |
Phase Shift [months] |
Bias Score [1] |
RMSE Score [1] |
Seasonal Cycle Score [1] |
Spatial Distribution Score [1] |
Overall Score [1] |
|||
|---|---|---|---|---|---|---|---|---|---|---|---|---|---|---|---|---|
| Benchmark | [-] | 0.897 | ||||||||||||||
| 101 | [-] | 0.683 | 0.773 | 0.897 | 1.61 | 0.824 | -0.118 | 0.727 | 1.78 | 0.405 | 0.356 | 0.728 | 0.818 | 0.533 | ||
| 105 | [-] | 0.686 | 0.764 | 0.897 | 1.42 | 0.824 | -0.127 | 0.687 | 1.64 | 0.424 | 0.364 | 0.763 | 0.881 | 0.559 | ||
| 111 | [-] | 0.685 | 0.770 | 0.897 | 1.33 | 0.824 | -0.122 | 0.691 | 1.69 | 0.432 | 0.356 | 0.744 | 0.856 | 0.549 | ||
| 112 | [-] | 0.667 | 0.745 | 0.897 | 1.37 | 0.824 | -0.146 | 0.684 | 1.69 | 0.432 | 0.358 | 0.745 | 0.885 | 0.556 | ||
| 113 | [-] | 0.655 | 0.716 | 0.897 | 1.11 | 0.824 | -0.177 | 0.666 | 1.74 | 0.436 | 0.356 | 0.739 | 0.923 | 0.562 | ||
| 114 | [-] | 0.719 | 0.803 | 0.897 | 1.32 | 0.824 | -0.0894 | 0.683 | 1.69 | 0.445 | 0.356 | 0.751 | 0.848 | 0.551 |
Download Data |
Period Mean (original grids) [1] |
Model Period Mean (intersection) [1] |
Benchmark Period Mean (intersection) [1] |
Model Period Mean (complement) [1] |
Benchmark Period Mean (complement) [1] |
Bias [1] |
RMSE [1] |
Phase Shift [months] |
Bias Score [1] |
RMSE Score [1] |
Seasonal Cycle Score [1] |
Spatial Distribution Score [1] |
Overall Score [1] |
|||
|---|---|---|---|---|---|---|---|---|---|---|---|---|---|---|---|---|
| Benchmark | [-] | 1.26 | ||||||||||||||
| 101 | [-] | 1.28 | 1.29 | 1.26 | 1.88 | 1.16 | 0.0828 | 0.943 | 2.75 | 0.379 | 0.405 | 0.556 | 0.660 | 0.481 | ||
| 105 | [-] | 1.11 | 1.11 | 1.26 | 1.48 | 1.16 | -0.118 | 0.771 | 2.65 | 0.430 | 0.424 | 0.571 | 0.831 | 0.536 | ||
| 111 | [-] | 1.20 | 1.21 | 1.26 | 1.56 | 1.16 | -0.0205 | 0.829 | 2.74 | 0.421 | 0.415 | 0.561 | 0.743 | 0.511 | ||
| 112 | [-] | 1.15 | 1.16 | 1.26 | 1.55 | 1.16 | -0.0671 | 0.821 | 2.75 | 0.416 | 0.417 | 0.560 | 0.763 | 0.515 | ||
| 113 | [-] | 1.04 | 1.05 | 1.26 | 1.18 | 1.16 | -0.196 | 0.763 | 2.94 | 0.424 | 0.415 | 0.518 | 0.872 | 0.529 | ||
| 114 | [-] | 1.25 | 1.26 | 1.26 | 1.45 | 1.16 | 0.0107 | 0.828 | 2.81 | 0.423 | 0.415 | 0.545 | 0.733 | 0.506 |
Download Data |
Period Mean (original grids) [1] |
Model Period Mean (intersection) [1] |
Benchmark Period Mean (intersection) [1] |
Model Period Mean (complement) [1] |
Benchmark Period Mean (complement) [1] |
Bias [1] |
RMSE [1] |
Phase Shift [months] |
Bias Score [1] |
RMSE Score [1] |
Seasonal Cycle Score [1] |
Spatial Distribution Score [1] |
Overall Score [1] |
|||
|---|---|---|---|---|---|---|---|---|---|---|---|---|---|---|---|---|
| Benchmark | [-] | 0.657 | ||||||||||||||
| 101 | [-] | 0.650 | 0.660 | 0.658 | 0.749 | 0.521 | 0.00907 | 0.821 | 0.518 | 0.612 | 0.324 | 0.955 | 0.700 | 0.583 | ||
| 105 | [-] | 0.120 | 0.120 | 0.658 | 0.193 | 0.521 | -0.529 | 0.601 | 0.979 | 0.383 | 0.458 | 0.910 | 0.752 | 0.592 | ||
| 111 | [-] | 0.275 | 0.276 | 0.658 | 0.415 | 0.521 | -0.366 | 0.499 | 0.790 | 0.500 | 0.508 | 0.931 | 0.852 | 0.660 | ||
| 112 | [-] | 0.265 | 0.265 | 0.658 | 0.401 | 0.521 | -0.377 | 0.502 | 0.718 | 0.496 | 0.507 | 0.941 | 0.862 | 0.662 | ||
| 113 | [-] | 0.222 | 0.223 | 0.658 | 0.337 | 0.521 | -0.420 | 0.480 | 0.881 | 0.455 | 0.537 | 0.915 | 0.875 | 0.664 | ||
| 114 | [-] | 0.216 | 0.216 | 0.658 | 0.327 | 0.521 | -0.427 | 0.485 | 0.968 | 0.452 | 0.534 | 0.900 | 0.874 | 0.659 |
Download Data |
Period Mean (original grids) [1] |
Model Period Mean (intersection) [1] |
Benchmark Period Mean (intersection) [1] |
Model Period Mean (complement) [1] |
Benchmark Period Mean (complement) [1] |
Bias [1] |
RMSE [1] |
Phase Shift [months] |
Bias Score [1] |
RMSE Score [1] |
Seasonal Cycle Score [1] |
Spatial Distribution Score [1] |
Overall Score [1] |
|||
|---|---|---|---|---|---|---|---|---|---|---|---|---|---|---|---|---|
| Benchmark | [-] | 3.97 | ||||||||||||||
| 101 | [-] | 7.04 | 7.16 | 3.98 | 6.61 | 3.71 | 2.93 | 2.98 | 3.04 | 0.0518 | 0.683 | 0.501 | 0.981 | 0.580 | ||
| 105 | [-] | 4.70 | 4.74 | 3.98 | 4.55 | 3.71 | 0.671 | 0.987 | 3.01 | 0.429 | 0.692 | 0.506 | 0.670 | 0.598 | ||
| 111 | [-] | 5.61 | 5.69 | 3.98 | 5.27 | 3.71 | 1.54 | 1.65 | 3.06 | 0.189 | 0.691 | 0.497 | 0.978 | 0.609 | ||
| 112 | [-] | 5.50 | 5.59 | 3.98 | 5.18 | 3.71 | 1.42 | 1.56 | 3.06 | 0.210 | 0.684 | 0.495 | 0.947 | 0.604 | ||
| 113 | [-] | 3.31 | 3.36 | 3.98 | 3.13 | 3.71 | -0.735 | 1.20 | 2.83 | 0.286 | 0.704 | 0.540 | 0.569 | 0.561 | ||
| 114 | [-] | 5.23 | 5.30 | 3.98 | 4.95 | 3.71 | 1.18 | 1.36 | 3.21 | 0.271 | 0.687 | 0.469 | 0.956 | 0.614 |
Download Data |
Period Mean (original grids) [1] |
Model Period Mean (intersection) [1] |
Benchmark Period Mean (intersection) [1] |
Model Period Mean (complement) [1] |
Benchmark Period Mean (complement) [1] |
Bias [1] |
RMSE [1] |
Phase Shift [months] |
Bias Score [1] |
RMSE Score [1] |
Seasonal Cycle Score [1] |
Spatial Distribution Score [1] |
Overall Score [1] |
|||
|---|---|---|---|---|---|---|---|---|---|---|---|---|---|---|---|---|
| Benchmark | [-] | 1.18 | ||||||||||||||
| 101 | [-] | 2.52 | 2.54 | 1.18 | 2.54 | 1.20 | 1.37 | 1.88 | 0.999 | 0.293 | 0.403 | 0.896 | 0.351 | 0.469 | ||
| 105 | [-] | 1.83 | 1.84 | 1.18 | 2.04 | 1.20 | 0.677 | 1.25 | 1.49 | 0.445 | 0.511 | 0.794 | 0.250 | 0.502 | ||
| 111 | [-] | 2.08 | 2.09 | 1.18 | 2.59 | 1.20 | 0.937 | 1.39 | 0.959 | 0.421 | 0.506 | 0.914 | 0.259 | 0.521 | ||
| 112 | [-] | 1.90 | 1.92 | 1.18 | 2.46 | 1.20 | 0.759 | 1.28 | 1.00 | 0.459 | 0.513 | 0.900 | 0.238 | 0.525 | ||
| 113 | [-] | 2.13 | 2.14 | 1.18 | 2.76 | 1.20 | 0.982 | 1.42 | 1.16 | 0.412 | 0.511 | 0.863 | 0.249 | 0.510 | ||
| 114 | [-] | 2.03 | 2.04 | 1.18 | 2.66 | 1.20 | 0.879 | 1.36 | 1.35 | 0.424 | 0.515 | 0.823 | 0.247 | 0.505 |
Download Data |
Period Mean (original grids) [1] |
Model Period Mean (intersection) [1] |
Benchmark Period Mean (intersection) [1] |
Model Period Mean (complement) [1] |
Benchmark Period Mean (complement) [1] |
Bias [1] |
RMSE [1] |
Phase Shift [months] |
Bias Score [1] |
RMSE Score [1] |
Seasonal Cycle Score [1] |
Spatial Distribution Score [1] |
Overall Score [1] |
|||
|---|---|---|---|---|---|---|---|---|---|---|---|---|---|---|---|---|
| Benchmark | [-] | 0.653 | ||||||||||||||
| 101 | [-] | 1.54 | 1.53 | 0.652 | 2.30 | 1.29 | 0.973 | 1.26 | 1.61 | 0.248 | 0.290 | 0.780 | 0.311 | 0.384 | ||
| 105 | [-] | 1.06 | 1.06 | 0.652 | 1.67 | 1.29 | 0.475 | 0.778 | 1.75 | 0.361 | 0.375 | 0.756 | 0.479 | 0.469 | ||
| 111 | [-] | 1.18 | 1.17 | 0.652 | 2.01 | 1.29 | 0.606 | 0.894 | 1.48 | 0.356 | 0.370 | 0.804 | 0.379 | 0.456 | ||
| 112 | [-] | 1.19 | 1.17 | 0.652 | 2.06 | 1.29 | 0.609 | 0.904 | 1.59 | 0.355 | 0.369 | 0.786 | 0.366 | 0.449 | ||
| 113 | [-] | 1.08 | 1.08 | 0.652 | 1.78 | 1.29 | 0.496 | 0.783 | 1.64 | 0.368 | 0.386 | 0.775 | 0.443 | 0.472 | ||
| 114 | [-] | 1.06 | 1.05 | 0.652 | 1.77 | 1.29 | 0.476 | 0.766 | 1.59 | 0.375 | 0.389 | 0.785 | 0.453 | 0.478 |
Download Data |
Period Mean (original grids) [1] |
Model Period Mean (intersection) [1] |
Benchmark Period Mean (intersection) [1] |
Model Period Mean (complement) [1] |
Benchmark Period Mean (complement) [1] |
Bias [1] |
RMSE [1] |
Phase Shift [months] |
Bias Score [1] |
RMSE Score [1] |
Seasonal Cycle Score [1] |
Spatial Distribution Score [1] |
Overall Score [1] |
|||
|---|---|---|---|---|---|---|---|---|---|---|---|---|---|---|---|---|
| Benchmark | [-] | 1.36 | ||||||||||||||
| 101 | [-] | 2.99 | 2.87 | 1.36 | 3.87 | 2.44 | 1.71 | 1.89 | 1.81 | 0.150 | 0.361 | 0.740 | 0.651 | 0.453 | ||
| 105 | [-] | 2.36 | 2.28 | 1.36 | 3.07 | 2.44 | 1.06 | 1.32 | 1.87 | 0.207 | 0.384 | 0.732 | 0.878 | 0.517 | ||
| 111 | [-] | 2.38 | 2.29 | 1.36 | 3.06 | 2.44 | 1.08 | 1.34 | 1.79 | 0.219 | 0.392 | 0.742 | 0.820 | 0.513 | ||
| 112 | [-] | 2.40 | 2.31 | 1.36 | 3.12 | 2.44 | 1.11 | 1.39 | 1.81 | 0.215 | 0.380 | 0.742 | 0.810 | 0.505 | ||
| 113 | [-] | 2.00 | 1.94 | 1.36 | 2.31 | 2.44 | 0.645 | 1.03 | 1.90 | 0.278 | 0.393 | 0.723 | 0.926 | 0.543 | ||
| 114 | [-] | 2.23 | 2.15 | 1.36 | 2.83 | 2.44 | 0.927 | 1.22 | 1.80 | 0.238 | 0.391 | 0.741 | 0.871 | 0.526 |
Download Data |
Period Mean (original grids) [1] |
Model Period Mean (intersection) [1] |
Benchmark Period Mean (intersection) [1] |
Model Period Mean (complement) [1] |
Benchmark Period Mean (complement) [1] |
Bias [1] |
RMSE [1] |
Phase Shift [months] |
Bias Score [1] |
RMSE Score [1] |
Seasonal Cycle Score [1] |
Spatial Distribution Score [1] |
Overall Score [1] |
|||
|---|---|---|---|---|---|---|---|---|---|---|---|---|---|---|---|---|
| Benchmark | [-] | 0.627 | ||||||||||||||
| 101 | [-] | 0.767 | 0.820 | 0.627 | 0.519 | 0.466 | 0.161 | 0.929 | 0.756 | 0.593 | 0.272 | 0.926 | 0.517 | 0.516 | ||
| 105 | [-] | 0.264 | 0.312 | 0.627 | 0.134 | 0.466 | -0.335 | 0.550 | 1.60 | 0.417 | 0.489 | 0.791 | 0.507 | 0.539 | ||
| 111 | [-] | 0.466 | 0.511 | 0.627 | 0.289 | 0.466 | -0.141 | 0.526 | 1.10 | 0.551 | 0.480 | 0.875 | 0.502 | 0.578 | ||
| 112 | [-] | 0.442 | 0.470 | 0.627 | 0.285 | 0.466 | -0.179 | 0.504 | 1.07 | 0.563 | 0.479 | 0.878 | 0.621 | 0.604 | ||
| 113 | [-] | 0.408 | 0.468 | 0.627 | 0.243 | 0.466 | -0.185 | 0.504 | 1.34 | 0.473 | 0.535 | 0.837 | 0.414 | 0.559 | ||
| 114 | [-] | 0.410 | 0.467 | 0.627 | 0.248 | 0.466 | -0.186 | 0.500 | 1.35 | 0.475 | 0.535 | 0.833 | 0.420 | 0.560 |
Download Data |
Period Mean (original grids) [1] |
Model Period Mean (intersection) [1] |
Benchmark Period Mean (intersection) [1] |
Model Period Mean (complement) [1] |
Benchmark Period Mean (complement) [1] |
Bias [1] |
RMSE [1] |
Phase Shift [months] |
Bias Score [1] |
RMSE Score [1] |
Seasonal Cycle Score [1] |
Spatial Distribution Score [1] |
Overall Score [1] |
|||
|---|---|---|---|---|---|---|---|---|---|---|---|---|---|---|---|---|
| Benchmark | [-] | 0.783 | ||||||||||||||
| 101 | [-] | 1.05 | 0.937 | 0.776 | 2.94 | 1.59 | 0.410 | 0.684 | 2.45 | 0.399 | 0.404 | 0.607 | 0.568 | 0.476 | ||
| 105 | [-] | 0.539 | 0.493 | 0.776 | 1.37 | 1.59 | -0.177 | 0.408 | 2.35 | 0.399 | 0.514 | 0.630 | 0.897 | 0.591 | ||
| 111 | [-] | 0.625 | 0.570 | 0.776 | 1.58 | 1.59 | -0.0835 | 0.405 | 2.44 | 0.431 | 0.459 | 0.614 | 0.926 | 0.578 | ||
| 112 | [-] | 0.612 | 0.560 | 0.776 | 1.51 | 1.59 | -0.103 | 0.411 | 2.43 | 0.430 | 0.459 | 0.616 | 0.917 | 0.576 | ||
| 113 | [-] | 0.573 | 0.527 | 0.776 | 1.36 | 1.59 | -0.141 | 0.402 | 2.42 | 0.430 | 0.465 | 0.618 | 0.909 | 0.577 | ||
| 114 | [-] | 0.620 | 0.568 | 0.776 | 1.53 | 1.59 | -0.0903 | 0.401 | 2.35 | 0.437 | 0.460 | 0.630 | 0.925 | 0.582 |
Download Data |
Period Mean (original grids) [1] |
Model Period Mean (intersection) [1] |
Benchmark Period Mean (intersection) [1] |
Model Period Mean (complement) [1] |
Benchmark Period Mean (complement) [1] |
Bias [1] |
RMSE [1] |
Phase Shift [months] |
Bias Score [1] |
RMSE Score [1] |
Seasonal Cycle Score [1] |
Spatial Distribution Score [1] |
Overall Score [1] |
|||
|---|---|---|---|---|---|---|---|---|---|---|---|---|---|---|---|---|
| Benchmark | [-] | 1.09 | ||||||||||||||
| 101 | [-] | 2.73 | 2.77 | 1.09 | 2.61 | 0.776 | 1.65 | 1.94 | 2.22 | 0.162 | 0.330 | 0.665 | 0.376 | 0.373 | ||
| 105 | [-] | 1.75 | 1.77 | 1.09 | 1.62 | 0.776 | 0.651 | 1.03 | 2.52 | 0.394 | 0.412 | 0.599 | 0.520 | 0.467 | ||
| 111 | [-] | 2.07 | 2.10 | 1.09 | 1.95 | 0.776 | 0.985 | 1.30 | 1.93 | 0.295 | 0.392 | 0.719 | 0.432 | 0.446 | ||
| 112 | [-] | 2.10 | 2.12 | 1.09 | 2.02 | 0.776 | 1.02 | 1.33 | 2.03 | 0.301 | 0.387 | 0.698 | 0.403 | 0.435 | ||
| 113 | [-] | 1.90 | 1.91 | 1.09 | 1.79 | 0.776 | 0.802 | 1.13 | 2.22 | 0.350 | 0.441 | 0.662 | 0.458 | 0.471 | ||
| 114 | [-] | 1.86 | 1.87 | 1.09 | 1.75 | 0.776 | 0.765 | 1.11 | 2.17 | 0.360 | 0.438 | 0.671 | 0.463 | 0.474 |
Download Data |
Period Mean (original grids) [1] |
Model Period Mean (intersection) [1] |
Benchmark Period Mean (intersection) [1] |
Model Period Mean (complement) [1] |
Benchmark Period Mean (complement) [1] |
Bias [1] |
RMSE [1] |
Phase Shift [months] |
Bias Score [1] |
RMSE Score [1] |
Seasonal Cycle Score [1] |
Spatial Distribution Score [1] |
Overall Score [1] |
|||
|---|---|---|---|---|---|---|---|---|---|---|---|---|---|---|---|---|
| Benchmark | [-] | 1.23 | ||||||||||||||
| 101 | [-] | 1.88 | 2.05 | 1.23 | 0.540 | 1.98 | 0.916 | 1.30 | 2.09 | 0.272 | 0.401 | 0.683 | 0.716 | 0.495 | ||
| 105 | [-] | 1.32 | 1.44 | 1.23 | 0.372 | 1.98 | 0.275 | 0.793 | 2.25 | 0.357 | 0.464 | 0.656 | 0.892 | 0.566 | ||
| 111 | [-] | 1.48 | 1.62 | 1.23 | 0.416 | 1.98 | 0.460 | 0.885 | 2.09 | 0.344 | 0.452 | 0.686 | 0.840 | 0.555 | ||
| 112 | [-] | 1.45 | 1.58 | 1.23 | 0.415 | 1.98 | 0.424 | 0.874 | 2.09 | 0.348 | 0.452 | 0.684 | 0.844 | 0.556 | ||
| 113 | [-] | 1.23 | 1.35 | 1.23 | 0.328 | 1.98 | 0.170 | 0.845 | 2.18 | 0.345 | 0.464 | 0.669 | 0.895 | 0.567 | ||
| 114 | [-] | 1.38 | 1.51 | 1.23 | 0.387 | 1.98 | 0.351 | 0.825 | 2.17 | 0.356 | 0.462 | 0.670 | 0.869 | 0.564 |
Download Data |
Period Mean (original grids) [1] |
Model Period Mean (intersection) [1] |
Benchmark Period Mean (intersection) [1] |
Model Period Mean (complement) [1] |
Benchmark Period Mean (complement) [1] |
Bias [1] |
RMSE [1] |
Phase Shift [months] |
Bias Score [1] |
RMSE Score [1] |
Seasonal Cycle Score [1] |
Spatial Distribution Score [1] |
Overall Score [1] |
|||
|---|---|---|---|---|---|---|---|---|---|---|---|---|---|---|---|---|
| Benchmark | [-] | 0.173 | ||||||||||||||
| 101 | [-] | 0.341 | 0.321 | 0.173 | 0.905 | 0.261 | 0.184 | 0.404 | 2.63 | 0.200 | 0.461 | 0.581 | 0.204 | 0.381 | ||
| 105 | [-] | 0.211 | 0.198 | 0.173 | 0.523 | 0.261 | 0.0488 | 0.263 | 2.55 | 0.204 | 0.505 | 0.595 | 0.434 | 0.449 | ||
| 111 | [-] | 0.232 | 0.218 | 0.173 | 0.596 | 0.261 | 0.0687 | 0.287 | 2.62 | 0.211 | 0.471 | 0.580 | 0.395 | 0.426 | ||
| 112 | [-] | 0.235 | 0.221 | 0.173 | 0.611 | 0.261 | 0.0722 | 0.289 | 2.57 | 0.211 | 0.477 | 0.590 | 0.378 | 0.426 | ||
| 113 | [-] | 0.217 | 0.204 | 0.173 | 0.540 | 0.261 | 0.0535 | 0.265 | 2.56 | 0.210 | 0.489 | 0.592 | 0.438 | 0.443 | ||
| 114 | [-] | 0.213 | 0.199 | 0.173 | 0.529 | 0.261 | 0.0494 | 0.261 | 2.54 | 0.212 | 0.487 | 0.596 | 0.451 | 0.447 |
Download Data |
Period Mean (original grids) [1] |
Model Period Mean (intersection) [1] |
Benchmark Period Mean (intersection) [1] |
Model Period Mean (complement) [1] |
Benchmark Period Mean (complement) [1] |
Bias [1] |
RMSE [1] |
Phase Shift [months] |
Bias Score [1] |
RMSE Score [1] |
Seasonal Cycle Score [1] |
Spatial Distribution Score [1] |
Overall Score [1] |
|||
|---|---|---|---|---|---|---|---|---|---|---|---|---|---|---|---|---|
| Benchmark | [-] | 0.528 | ||||||||||||||
| 101 | [-] | 0.851 | 0.848 | 0.528 | 0.579 | 0.481 | 0.291 | 0.797 | 1.23 | 0.448 | 0.331 | 0.846 | 0.445 | 0.480 | ||
| 105 | [-] | 0.608 | 0.617 | 0.528 | 0.360 | 0.481 | 0.0584 | 0.575 | 1.99 | 0.384 | 0.473 | 0.717 | 0.466 | 0.503 | ||
| 111 | [-] | 0.683 | 0.680 | 0.528 | 0.447 | 0.481 | 0.128 | 0.603 | 1.44 | 0.404 | 0.470 | 0.818 | 0.445 | 0.521 | ||
| 112 | [-] | 0.617 | 0.614 | 0.528 | 0.422 | 0.481 | 0.0675 | 0.558 | 1.39 | 0.431 | 0.471 | 0.825 | 0.498 | 0.539 | ||
| 113 | [-] | 0.748 | 0.754 | 0.528 | 0.467 | 0.481 | 0.196 | 0.644 | 1.61 | 0.366 | 0.494 | 0.792 | 0.378 | 0.505 | ||
| 114 | [-] | 0.757 | 0.764 | 0.528 | 0.468 | 0.481 | 0.204 | 0.651 | 1.63 | 0.364 | 0.490 | 0.786 | 0.377 | 0.501 |
Download Data |
Period Mean (original grids) [1] |
Model Period Mean (intersection) [1] |
Benchmark Period Mean (intersection) [1] |
Model Period Mean (complement) [1] |
Benchmark Period Mean (complement) [1] |
Bias [1] |
RMSE [1] |
Phase Shift [months] |
Bias Score [1] |
RMSE Score [1] |
Seasonal Cycle Score [1] |
Spatial Distribution Score [1] |
Overall Score [1] |
|||
|---|---|---|---|---|---|---|---|---|---|---|---|---|---|---|---|---|
| Benchmark | [-] | 1.75 | ||||||||||||||
| 101 | [-] | 2.70 | 2.60 | 1.73 | 3.39 | 3.15 | 1.13 | 1.41 | 1.96 | 0.237 | 0.450 | 0.710 | 0.750 | 0.519 | ||
| 105 | [-] | 2.04 | 1.93 | 1.73 | 2.77 | 3.15 | 0.488 | 0.939 | 1.97 | 0.330 | 0.486 | 0.709 | 0.920 | 0.586 | ||
| 111 | [-] | 2.20 | 2.11 | 1.73 | 2.85 | 3.15 | 0.632 | 0.995 | 1.85 | 0.314 | 0.477 | 0.725 | 0.884 | 0.575 | ||
| 112 | [-] | 2.17 | 2.08 | 1.73 | 2.79 | 3.15 | 0.595 | 0.990 | 1.90 | 0.320 | 0.466 | 0.719 | 0.890 | 0.572 | ||
| 113 | [-] | 1.64 | 1.58 | 1.73 | 2.11 | 3.15 | 0.0232 | 0.797 | 1.88 | 0.367 | 0.485 | 0.720 | 0.938 | 0.599 | ||
| 114 | [-] | 2.12 | 2.04 | 1.73 | 2.73 | 3.15 | 0.542 | 0.942 | 1.79 | 0.333 | 0.478 | 0.738 | 0.908 | 0.587 |
Download Data |
Period Mean (original grids) [1] |
Model Period Mean (intersection) [1] |
Benchmark Period Mean (intersection) [1] |
Model Period Mean (complement) [1] |
Benchmark Period Mean (complement) [1] |
Bias [1] |
RMSE [1] |
Phase Shift [months] |
Bias Score [1] |
RMSE Score [1] |
Seasonal Cycle Score [1] |
Spatial Distribution Score [1] |
Overall Score [1] |
|||
|---|---|---|---|---|---|---|---|---|---|---|---|---|---|---|---|---|
| Benchmark | [-] | 1.54 | ||||||||||||||
| 101 | [-] | 3.04 | 3.02 | 1.54 | 2.65 | 1.18 | 1.52 | 1.85 | 2.01 | 0.284 | 0.459 | 0.714 | 0.607 | 0.505 | ||
| 105 | [-] | 2.06 | 2.04 | 1.54 | 1.88 | 1.18 | 0.539 | 1.13 | 2.04 | 0.494 | 0.496 | 0.708 | 0.723 | 0.583 | ||
| 111 | [-] | 2.56 | 2.54 | 1.54 | 2.24 | 1.18 | 1.03 | 1.38 | 1.91 | 0.407 | 0.500 | 0.734 | 0.654 | 0.559 | ||
| 112 | [-] | 2.59 | 2.57 | 1.54 | 2.23 | 1.18 | 1.05 | 1.42 | 1.95 | 0.404 | 0.492 | 0.727 | 0.624 | 0.548 | ||
| 113 | [-] | 2.18 | 2.16 | 1.54 | 2.03 | 1.18 | 0.662 | 1.15 | 1.99 | 0.484 | 0.515 | 0.721 | 0.676 | 0.582 | ||
| 114 | [-] | 2.11 | 2.09 | 1.54 | 1.96 | 1.18 | 0.591 | 1.14 | 2.06 | 0.490 | 0.511 | 0.707 | 0.666 | 0.577 |
Download Data |
Period Mean (original grids) [1] |
Model Period Mean (intersection) [1] |
Benchmark Period Mean (intersection) [1] |
Model Period Mean (complement) [1] |
Benchmark Period Mean (complement) [1] |
Bias [1] |
RMSE [1] |
Phase Shift [months] |
Bias Score [1] |
RMSE Score [1] |
Seasonal Cycle Score [1] |
Spatial Distribution Score [1] |
Overall Score [1] |
|||
|---|---|---|---|---|---|---|---|---|---|---|---|---|---|---|---|---|
| Benchmark | [-] | 1.18 | ||||||||||||||
| 101 | [-] | 3.15 | 3.13 | 1.18 | 2.77 | 1.21 | 1.99 | 2.27 | 1.40 | 0.154 | 0.432 | 0.838 | 0.371 | 0.446 | ||
| 105 | [-] | 2.72 | 2.69 | 1.18 | 2.30 | 1.21 | 1.54 | 1.89 | 2.51 | 0.262 | 0.412 | 0.603 | 0.376 | 0.413 | ||
| 111 | [-] | 2.80 | 2.77 | 1.18 | 2.54 | 1.21 | 1.63 | 1.92 | 1.77 | 0.229 | 0.446 | 0.760 | 0.377 | 0.452 | ||
| 112 | [-] | 2.59 | 2.56 | 1.18 | 2.48 | 1.21 | 1.42 | 1.75 | 1.68 | 0.283 | 0.449 | 0.779 | 0.348 | 0.462 | ||
| 113 | [-] | 2.97 | 2.94 | 1.18 | 2.53 | 1.21 | 1.80 | 2.10 | 2.12 | 0.219 | 0.430 | 0.686 | 0.336 | 0.420 | ||
| 114 | [-] | 2.91 | 2.88 | 1.18 | 2.48 | 1.21 | 1.73 | 2.05 | 2.16 | 0.231 | 0.427 | 0.674 | 0.348 | 0.421 |
Download Data |
Period Mean (original grids) [1] |
Model Period Mean (intersection) [1] |
Benchmark Period Mean (intersection) [1] |
Model Period Mean (complement) [1] |
Benchmark Period Mean (complement) [1] |
Bias [1] |
RMSE [1] |
Phase Shift [months] |
Bias Score [1] |
RMSE Score [1] |
Seasonal Cycle Score [1] |
Spatial Distribution Score [1] |
Overall Score [1] |
|||
|---|---|---|---|---|---|---|---|---|---|---|---|---|---|---|---|---|
| Benchmark | [-] | 0.596 | ||||||||||||||
| 101 | [-] | 1.28 | 1.28 | 0.596 | 4.85 | 0.709 | 0.775 | 0.994 | 2.15 | 0.229 | 0.291 | 0.663 | 0.273 | 0.349 | ||
| 105 | [-] | 0.876 | 0.885 | 0.596 | 3.54 | 0.709 | 0.361 | 0.625 | 2.30 | 0.412 | 0.407 | 0.649 | 0.382 | 0.452 | ||
| 111 | [-] | 0.964 | 0.975 | 0.596 | 4.02 | 0.709 | 0.462 | 0.708 | 1.83 | 0.383 | 0.371 | 0.728 | 0.302 | 0.431 | ||
| 112 | [-] | 0.957 | 0.974 | 0.596 | 4.18 | 0.709 | 0.465 | 0.720 | 1.95 | 0.378 | 0.364 | 0.706 | 0.292 | 0.421 | ||
| 113 | [-] | 0.938 | 0.948 | 0.596 | 3.78 | 0.709 | 0.429 | 0.676 | 2.13 | 0.391 | 0.374 | 0.678 | 0.335 | 0.430 | ||
| 114 | [-] | 0.920 | 0.930 | 0.596 | 3.74 | 0.709 | 0.410 | 0.663 | 2.12 | 0.396 | 0.378 | 0.678 | 0.340 | 0.434 |
Download Data |
Period Mean (original grids) [1] |
Model Period Mean (intersection) [1] |
Benchmark Period Mean (intersection) [1] |
Model Period Mean (complement) [1] |
Benchmark Period Mean (complement) [1] |
Bias [1] |
RMSE [1] |
Phase Shift [months] |
Bias Score [1] |
RMSE Score [1] |
Seasonal Cycle Score [1] |
Spatial Distribution Score [1] |
Overall Score [1] |
|||
|---|---|---|---|---|---|---|---|---|---|---|---|---|---|---|---|---|
| Benchmark | [-] | 4.42 | ||||||||||||||
| 101 | [-] | 6.59 | 6.59 | 4.43 | 5.26 | 3.26 | 2.10 | 2.24 | 3.18 | 0.0699 | 0.636 | 0.474 | 0.954 | 0.554 | ||
| 105 | [-] | 4.44 | 4.44 | 4.43 | 3.88 | 3.26 | -0.0209 | 0.843 | 3.22 | 0.330 | 0.646 | 0.466 | 0.856 | 0.589 | ||
| 111 | [-] | 5.12 | 5.13 | 4.43 | 4.11 | 3.26 | 0.649 | 1.02 | 3.22 | 0.256 | 0.648 | 0.465 | 0.984 | 0.600 | ||
| 112 | [-] | 5.11 | 5.11 | 4.43 | 4.11 | 3.26 | 0.634 | 1.03 | 3.19 | 0.246 | 0.648 | 0.470 | 0.982 | 0.599 | ||
| 113 | [-] | 3.41 | 3.42 | 4.43 | 2.77 | 3.26 | -1.04 | 1.36 | 3.11 | 0.157 | 0.655 | 0.485 | 0.794 | 0.549 | ||
| 114 | [-] | 4.48 | 4.48 | 4.43 | 3.71 | 3.26 | 0.0161 | 0.860 | 3.19 | 0.324 | 0.649 | 0.470 | 0.945 | 0.607 |
Download Data |
Period Mean (original grids) [1] |
Model Period Mean (intersection) [1] |
Benchmark Period Mean (intersection) [1] |
Model Period Mean (complement) [1] |
Benchmark Period Mean (complement) [1] |
Bias [1] |
RMSE [1] |
Phase Shift [months] |
Bias Score [1] |
RMSE Score [1] |
Seasonal Cycle Score [1] |
Spatial Distribution Score [1] |
Overall Score [1] |
|||
|---|---|---|---|---|---|---|---|---|---|---|---|---|---|---|---|---|
| Benchmark | [-] | 1.82 | ||||||||||||||
| 101 | [-] | 2.85 | 2.82 | 1.82 | 3.07 | 2.35 | 1.03 | 1.50 | 2.82 | 0.244 | 0.444 | 0.549 | 0.723 | 0.481 | ||
| 105 | [-] | 1.79 | 1.78 | 1.82 | 1.65 | 2.35 | -0.0429 | 0.864 | 2.67 | 0.400 | 0.490 | 0.584 | 0.935 | 0.580 | ||
| 111 | [-] | 1.95 | 1.94 | 1.82 | 1.67 | 2.35 | 0.116 | 0.888 | 2.89 | 0.424 | 0.463 | 0.530 | 0.908 | 0.558 | ||
| 112 | [-] | 1.94 | 1.93 | 1.82 | 1.67 | 2.35 | 0.111 | 0.899 | 2.84 | 0.416 | 0.470 | 0.543 | 0.908 | 0.561 | ||
| 113 | [-] | 1.67 | 1.66 | 1.82 | 1.33 | 2.35 | -0.174 | 0.888 | 2.82 | 0.408 | 0.476 | 0.548 | 0.912 | 0.564 | ||
| 114 | [-] | 1.89 | 1.88 | 1.82 | 1.50 | 2.35 | 0.0496 | 0.948 | 2.74 | 0.403 | 0.474 | 0.566 | 0.834 | 0.550 |
Download Data |
Period Mean (original grids) [1] |
Model Period Mean (intersection) [1] |
Benchmark Period Mean (intersection) [1] |
Model Period Mean (complement) [1] |
Benchmark Period Mean (complement) [1] |
Bias [1] |
RMSE [1] |
Phase Shift [months] |
Bias Score [1] |
RMSE Score [1] |
Seasonal Cycle Score [1] |
Spatial Distribution Score [1] |
Overall Score [1] |
|||
|---|---|---|---|---|---|---|---|---|---|---|---|---|---|---|---|---|
| Benchmark | [-] | 0.624 | ||||||||||||||
| 101 | [-] | 1.56 | 1.57 | 0.615 | 1.60 | 1.60 | 1.09 | 1.40 | 2.13 | 0.126 | 0.245 | 0.673 | 0.391 | 0.336 | ||
| 105 | [-] | 0.928 | 0.935 | 0.615 | 0.893 | 1.60 | 0.424 | 0.763 | 2.31 | 0.253 | 0.360 | 0.642 | 0.688 | 0.461 | ||
| 111 | [-] | 1.03 | 1.05 | 0.615 | 0.968 | 1.60 | 0.547 | 0.885 | 2.12 | 0.221 | 0.297 | 0.675 | 0.592 | 0.416 | ||
| 112 | [-] | 1.01 | 1.02 | 0.615 | 0.957 | 1.60 | 0.516 | 0.876 | 2.05 | 0.225 | 0.299 | 0.690 | 0.605 | 0.423 | ||
| 113 | [-] | 0.929 | 0.943 | 0.615 | 0.917 | 1.60 | 0.452 | 0.847 | 2.16 | 0.221 | 0.304 | 0.673 | 0.633 | 0.427 | ||
| 114 | [-] | 0.989 | 1.00 | 0.615 | 0.936 | 1.60 | 0.503 | 0.849 | 2.25 | 0.216 | 0.311 | 0.661 | 0.627 | 0.425 |
Temporally integrated period mean