Mean State
Download Data |
Period Mean (original grids) [Pg] |
Model Period Mean (intersection) [Pg] |
Benchmark Period Mean (intersection) [Pg] |
Model Period Mean (complement) [Pg] |
Benchmark Period Mean (complement) [Pg] |
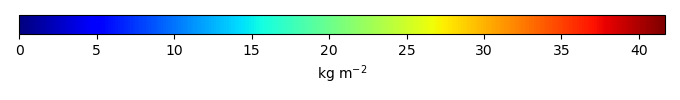
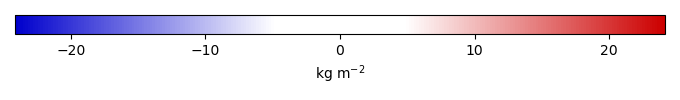
Bias [kg m-2] |
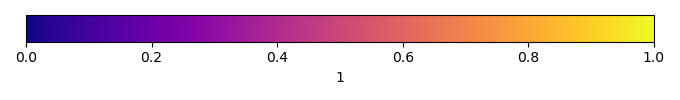
Bias Score [1] |
Spatial Distribution Score [1] |
Overall Score [1] |
|||
|---|---|---|---|---|---|---|---|---|---|---|---|---|
| Benchmark | [-] | 34.1 | ||||||||||
| 101 | [-] | 32.7 | 29.8 | 34.1 | 0.436 | 0.0278 | -0.573 | 0.693 | 0.933 | 0.813 | ||
| 105 | [-] | 26.2 | 23.5 | 34.1 | 0.436 | 0.0278 | -1.96 | 0.721 | 0.853 | 0.787 | ||
| 111 | [-] | 41.0 | 37.2 | 34.1 | 0.638 | 0.0278 | 1.21 | 0.613 | 0.912 | 0.762 | ||
| 112 | [-] | 42.6 | 38.7 | 34.1 | 0.704 | 0.0278 | 1.61 | 0.576 | 0.857 | 0.717 | ||
| 113 | [-] | 31.1 | 27.9 | 34.1 | 0.524 | 0.0278 | -0.923 | 0.692 | 0.894 | 0.793 | ||
| 114 | [-] | 42.6 | 38.7 | 34.1 | 0.628 | 0.0278 | 1.52 | 0.599 | 0.871 | 0.735 |
Download Data |
Period Mean (original grids) [Pg] |
Model Period Mean (intersection) [Pg] |
Benchmark Period Mean (intersection) [Pg] |
Model Period Mean (complement) [Pg] |
Benchmark Period Mean (complement) [Pg] |
Bias [kg m-2] |
Bias Score [1] |
Spatial Distribution Score [1] |
Overall Score [1] |
|||
|---|---|---|---|---|---|---|---|---|---|---|---|---|
| Benchmark | [-] | 44.8 | ||||||||||
| 101 | [-] | 8.78 | 10.6 | 44.8 | 0.0655 | 0.0683 | -4.95 | 0.472 | 0.686 | 0.579 | ||
| 105 | [-] | 11.0 | 13.0 | 44.8 | 0.0674 | 0.0683 | -4.58 | 0.493 | 0.761 | 0.627 | ||
| 111 | [-] | 16.1 | 19.0 | 44.8 | 0.0987 | 0.0683 | -3.68 | 0.533 | 0.847 | 0.690 | ||
| 112 | [-] | 16.1 | 18.9 | 44.8 | 0.105 | 0.0683 | -3.69 | 0.532 | 0.844 | 0.688 | ||
| 113 | [-] | 15.8 | 18.4 | 44.8 | 0.0860 | 0.0683 | -3.76 | 0.535 | 0.849 | 0.692 | ||
| 114 | [-] | 17.0 | 20.1 | 44.8 | 0.102 | 0.0683 | -3.50 | 0.542 | 0.846 | 0.694 |
Download Data |
Period Mean (original grids) [Pg] |
Model Period Mean (intersection) [Pg] |
Benchmark Period Mean (intersection) [Pg] |
Model Period Mean (complement) [Pg] |
Benchmark Period Mean (complement) [Pg] |
Bias [kg m-2] |
Bias Score [1] |
Spatial Distribution Score [1] |
Overall Score [1] |
|||
|---|---|---|---|---|---|---|---|---|---|---|---|---|
| Benchmark | [-] | 60.1 | ||||||||||
| 101 | [-] | 25.9 | 24.9 | 59.8 | 1.13 | 0.261 | -3.27 | 0.551 | 0.839 | 0.695 | ||
| 105 | [-] | 23.6 | 22.3 | 59.8 | 1.05 | 0.261 | -3.56 | 0.541 | 0.832 | 0.686 | ||
| 111 | [-] | 37.4 | 35.5 | 59.8 | 1.53 | 0.261 | -1.99 | 0.559 | 0.780 | 0.670 | ||
| 112 | [-] | 36.9 | 35.0 | 59.8 | 1.56 | 0.261 | -2.02 | 0.558 | 0.782 | 0.670 | ||
| 113 | [-] | 34.7 | 32.8 | 59.8 | 1.31 | 0.261 | -2.35 | 0.559 | 0.816 | 0.687 | ||
| 114 | [-] | 38.8 | 36.8 | 59.8 | 1.48 | 0.261 | -1.87 | 0.556 | 0.755 | 0.656 |
Download Data |
Period Mean (original grids) [Pg] |
Model Period Mean (intersection) [Pg] |
Benchmark Period Mean (intersection) [Pg] |
Model Period Mean (complement) [Pg] |
Benchmark Period Mean (complement) [Pg] |
Bias [kg m-2] |
Bias Score [1] |
Spatial Distribution Score [1] |
Overall Score [1] |
|||
|---|---|---|---|---|---|---|---|---|---|---|---|---|
| Benchmark | [-] | 11.1 | ||||||||||
| 101 | [-] | 64.1 | 4.07 | 10.7 | 59.9 | 0.441 | -5.17 | 0.475 | 0.709 | 0.592 | ||
| 105 | [-] | 10.7 | 0.974 | 10.7 | 9.82 | 0.441 | -15.0 | 0.426 | 0.551 | 0.488 | ||
| 111 | [-] | 57.9 | 4.16 | 10.7 | 53.9 | 0.441 | -4.80 | 0.444 | 0.584 | 0.514 | ||
| 112 | [-] | 57.1 | 4.10 | 10.7 | 53.1 | 0.441 | -4.95 | 0.446 | 0.585 | 0.515 | ||
| 113 | [-] | 40.9 | 3.36 | 10.7 | 37.6 | 0.441 | -7.24 | 0.471 | 0.640 | 0.555 | ||
| 114 | [-] | 40.2 | 3.30 | 10.7 | 36.9 | 0.441 | -7.47 | 0.469 | 0.641 | 0.555 |
Download Data |
Period Mean (original grids) [Pg] |
Model Period Mean (intersection) [Pg] |
Benchmark Period Mean (intersection) [Pg] |
Model Period Mean (complement) [Pg] |
Benchmark Period Mean (complement) [Pg] |
Bias [kg m-2] |
Bias Score [1] |
Spatial Distribution Score [1] |
Overall Score [1] |
|||
|---|---|---|---|---|---|---|---|---|---|---|---|---|
| Benchmark | [-] | 55.7 | ||||||||||
| 101 | [-] | 19.7 | 17.0 | 54.0 | 1.91 | 1.77 | -6.56 | 0.699 | 0.247 | 0.473 | ||
| 105 | [-] | 14.1 | 12.0 | 54.0 | 1.44 | 1.77 | -8.73 | 0.597 | 0.173 | 0.385 | ||
| 111 | [-] | 24.0 | 20.7 | 54.0 | 2.30 | 1.77 | -4.85 | 0.748 | 0.433 | 0.590 | ||
| 112 | [-] | 25.4 | 21.8 | 54.0 | 2.51 | 1.77 | -4.19 | 0.752 | 0.348 | 0.550 | ||
| 113 | [-] | 13.1 | 11.1 | 54.0 | 1.38 | 1.77 | -9.09 | 0.578 | 0.164 | 0.371 | ||
| 114 | [-] | 24.6 | 21.1 | 54.0 | 2.41 | 1.77 | -4.52 | 0.744 | 0.389 | 0.566 |
Download Data |
Period Mean (original grids) [Pg] |
Model Period Mean (intersection) [Pg] |
Benchmark Period Mean (intersection) [Pg] |
Model Period Mean (complement) [Pg] |
Benchmark Period Mean (complement) [Pg] |
Bias [kg m-2] |
Bias Score [1] |
Spatial Distribution Score [1] |
Overall Score [1] |
|||
|---|---|---|---|---|---|---|---|---|---|---|---|---|
| Benchmark | [-] | 65.6 | ||||||||||
| 101 | [-] | 154. | 47.2 | 65.5 | 97.8 | 0.127 | -3.83 | 0.686 | 0.623 | 0.655 | ||
| 105 | [-] | 81.9 | 28.4 | 65.5 | 48.8 | 0.127 | -8.43 | 0.613 | 0.502 | 0.557 | ||
| 111 | [-] | 202. | 68.5 | 65.5 | 123. | 0.127 | 1.49 | 0.605 | 0.916 | 0.761 | ||
| 112 | [-] | 183. | 61.1 | 65.5 | 112. | 0.127 | -0.285 | 0.623 | 0.906 | 0.764 | ||
| 113 | [-] | 179. | 53.3 | 65.5 | 115. | 0.127 | -2.15 | 0.645 | 0.879 | 0.762 | ||
| 114 | [-] | 165. | 50.9 | 65.5 | 104. | 0.127 | -2.75 | 0.652 | 0.871 | 0.761 |
Download Data |
Period Mean (original grids) [Pg] |
Model Period Mean (intersection) [Pg] |
Benchmark Period Mean (intersection) [Pg] |
Model Period Mean (complement) [Pg] |
Benchmark Period Mean (complement) [Pg] |
Bias [kg m-2] |
Bias Score [1] |
Spatial Distribution Score [1] |
Overall Score [1] |
|||
|---|---|---|---|---|---|---|---|---|---|---|---|---|
| Benchmark | [-] | 143. | ||||||||||
| 101 | [-] | 121. | 106. | 143. | 20.4 | 0.544 | -1.71 | 0.583 | 0.693 | 0.638 | ||
| 105 | [-] | 64.8 | 58.6 | 143. | 9.02 | 0.544 | -4.51 | 0.542 | 0.853 | 0.698 | ||
| 111 | [-] | 138. | 126. | 143. | 18.0 | 0.544 | -0.436 | 0.572 | 0.641 | 0.607 | ||
| 112 | [-] | 127. | 115. | 143. | 17.2 | 0.544 | -1.08 | 0.574 | 0.680 | 0.627 | ||
| 113 | [-] | 116. | 106. | 143. | 16.5 | 0.544 | -1.65 | 0.579 | 0.730 | 0.654 | ||
| 114 | [-] | 116. | 106. | 143. | 16.3 | 0.544 | -1.65 | 0.578 | 0.750 | 0.664 |
Download Data |
Period Mean (original grids) [Pg] |
Model Period Mean (intersection) [Pg] |
Benchmark Period Mean (intersection) [Pg] |
Model Period Mean (complement) [Pg] |
Benchmark Period Mean (complement) [Pg] |
Bias [kg m-2] |
Bias Score [1] |
Spatial Distribution Score [1] |
Overall Score [1] |
|||
|---|---|---|---|---|---|---|---|---|---|---|---|---|
| Benchmark | [-] | 58.4 | ||||||||||
| 101 | [-] | 36.4 | 33.6 | 58.0 | 1.25 | 0.365 | -2.31 | 0.701 | 0.907 | 0.804 | ||
| 105 | [-] | 32.8 | 30.6 | 58.0 | 1.21 | 0.365 | -2.79 | 0.686 | 0.948 | 0.817 | ||
| 111 | [-] | 50.4 | 47.0 | 58.0 | 1.66 | 0.365 | -0.215 | 0.695 | 0.790 | 0.743 | ||
| 112 | [-] | 51.7 | 48.3 | 58.0 | 1.83 | 0.365 | 0.0947 | 0.681 | 0.802 | 0.742 | ||
| 113 | [-] | 44.8 | 41.9 | 58.0 | 1.38 | 0.365 | -1.17 | 0.709 | 0.847 | 0.778 | ||
| 114 | [-] | 49.2 | 45.7 | 58.0 | 1.68 | 0.365 | -0.359 | 0.705 | 0.804 | 0.754 |
Download Data |
Period Mean (original grids) [Pg] |
Model Period Mean (intersection) [Pg] |
Benchmark Period Mean (intersection) [Pg] |
Model Period Mean (complement) [Pg] |
Benchmark Period Mean (complement) [Pg] |
Bias [kg m-2] |
Bias Score [1] |
Spatial Distribution Score [1] |
Overall Score [1] |
|||
|---|---|---|---|---|---|---|---|---|---|---|---|---|
| Benchmark | [-] | 7.78 | ||||||||||
| 101 | [-] | 96.3 | 8.14 | 7.68 | 91.2 | 0.0955 | 7.07 | 0.425 | 0.558 | 0.491 | ||
| 105 | [-] | 26.9 | 2.02 | 7.68 | 26.5 | 0.0955 | -10.2 | 0.449 | 0.766 | 0.607 | ||
| 111 | [-] | 116. | 8.73 | 7.68 | 110. | 0.0955 | 8.17 | 0.427 | 0.362 | 0.394 | ||
| 112 | [-] | 114. | 8.62 | 7.68 | 109. | 0.0955 | 7.94 | 0.424 | 0.360 | 0.392 | ||
| 113 | [-] | 87.6 | 6.38 | 7.68 | 84.9 | 0.0955 | 2.23 | 0.466 | 0.501 | 0.483 | ||
| 114 | [-] | 86.8 | 6.40 | 7.68 | 83.9 | 0.0955 | 2.29 | 0.464 | 0.496 | 0.480 |
Download Data |
Period Mean (original grids) [Pg] |
Model Period Mean (intersection) [Pg] |
Benchmark Period Mean (intersection) [Pg] |
Model Period Mean (complement) [Pg] |
Benchmark Period Mean (complement) [Pg] |
Bias [kg m-2] |
Bias Score [1] |
Spatial Distribution Score [1] |
Overall Score [1] |
|||
|---|---|---|---|---|---|---|---|---|---|---|---|---|
| Benchmark | [-] | 58.9 | ||||||||||
| 101 | [-] | 32.8 | 30.0 | 57.9 | 1.90 | 0.945 | -2.24 | 0.550 | 0.439 | 0.494 | ||
| 105 | [-] | 18.4 | 17.3 | 57.9 | 0.791 | 0.945 | -4.31 | 0.529 | 0.882 | 0.705 | ||
| 111 | [-] | 36.9 | 34.6 | 57.9 | 1.60 | 0.945 | -1.90 | 0.614 | 0.630 | 0.622 | ||
| 112 | [-] | 36.4 | 34.2 | 57.9 | 1.57 | 0.945 | -1.97 | 0.614 | 0.620 | 0.617 | ||
| 113 | [-] | 35.8 | 33.9 | 57.9 | 1.34 | 0.945 | -2.07 | 0.628 | 0.707 | 0.668 | ||
| 114 | [-] | 37.3 | 35.2 | 57.9 | 1.51 | 0.945 | -1.88 | 0.626 | 0.658 | 0.642 |
Download Data |
Period Mean (original grids) [Pg] |
Model Period Mean (intersection) [Pg] |
Benchmark Period Mean (intersection) [Pg] |
Model Period Mean (complement) [Pg] |
Benchmark Period Mean (complement) [Pg] |
Bias [kg m-2] |
Bias Score [1] |
Spatial Distribution Score [1] |
Overall Score [1] |
|||
|---|---|---|---|---|---|---|---|---|---|---|---|---|
| Benchmark | [-] | 61.8 | ||||||||||
| 101 | [-] | 42.7 | 38.5 | 61.4 | 3.95 | 0.340 | -2.41 | 0.670 | 0.717 | 0.694 | ||
| 105 | [-] | 21.4 | 19.7 | 61.4 | 1.46 | 0.340 | -6.66 | 0.573 | 0.388 | 0.481 | ||
| 111 | [-] | 53.8 | 49.0 | 61.4 | 4.63 | 0.340 | -0.273 | 0.627 | 0.893 | 0.760 | ||
| 112 | [-] | 50.1 | 45.5 | 61.4 | 4.46 | 0.340 | -0.995 | 0.634 | 0.877 | 0.755 | ||
| 113 | [-] | 41.8 | 37.3 | 61.4 | 4.05 | 0.340 | -2.82 | 0.653 | 0.847 | 0.750 | ||
| 114 | [-] | 41.5 | 37.0 | 61.4 | 4.07 | 0.340 | -2.87 | 0.653 | 0.847 | 0.750 |
Download Data |
Period Mean (original grids) [Pg] |
Model Period Mean (intersection) [Pg] |
Benchmark Period Mean (intersection) [Pg] |
Model Period Mean (complement) [Pg] |
Benchmark Period Mean (complement) [Pg] |
Bias [kg m-2] |
Bias Score [1] |
Spatial Distribution Score [1] |
Overall Score [1] |
|||
|---|---|---|---|---|---|---|---|---|---|---|---|---|
| Benchmark | [-] | 1.05e+03 | ||||||||||
| 101 | [-] | 1.02e+03 | 602. | 1.04e+03 | 411. | 8.90 | -2.82 | 0.595 | 0.855 | 0.725 | ||
| 105 | [-] | 576. | 402. | 1.04e+03 | 169. | 8.90 | -4.75 | 0.560 | 0.645 | 0.602 | ||
| 111 | [-] | 1.26e+03 | 764. | 1.04e+03 | 486. | 8.90 | -1.32 | 0.591 | 0.825 | 0.708 | ||
| 112 | [-] | 1.22e+03 | 745. | 1.04e+03 | 461. | 8.90 | -1.46 | 0.588 | 0.829 | 0.709 | ||
| 113 | [-] | 1.07e+03 | 632. | 1.04e+03 | 428. | 8.90 | -2.58 | 0.590 | 0.838 | 0.714 | ||
| 114 | [-] | 1.12e+03 | 692. | 1.04e+03 | 418. | 8.90 | -1.97 | 0.596 | 0.843 | 0.720 |
Download Data |
Period Mean (original grids) [Pg] |
Model Period Mean (intersection) [Pg] |
Benchmark Period Mean (intersection) [Pg] |
Model Period Mean (complement) [Pg] |
Benchmark Period Mean (complement) [Pg] |
Bias [kg m-2] |
Bias Score [1] |
Spatial Distribution Score [1] |
Overall Score [1] |
|||
|---|---|---|---|---|---|---|---|---|---|---|---|---|
| Benchmark | [-] | 64.3 | ||||||||||
| 101 | [-] | 27.5 | 25.1 | 64.2 | 1.25 | 0.107 | -2.09 | 0.442 | 0.467 | 0.454 | ||
| 105 | [-] | 15.0 | 13.6 | 64.2 | 0.628 | 0.107 | -2.92 | 0.442 | 0.774 | 0.608 | ||
| 111 | [-] | 34.7 | 31.5 | 64.2 | 1.51 | 0.107 | -1.64 | 0.442 | 0.359 | 0.401 | ||
| 112 | [-] | 32.5 | 29.5 | 64.2 | 1.41 | 0.107 | -1.78 | 0.443 | 0.386 | 0.415 | ||
| 113 | [-] | 29.5 | 26.8 | 64.2 | 1.24 | 0.107 | -1.98 | 0.445 | 0.439 | 0.442 | ||
| 114 | [-] | 30.1 | 27.3 | 64.2 | 1.27 | 0.107 | -1.94 | 0.446 | 0.431 | 0.438 |
Download Data |
Period Mean (original grids) [Pg] |
Model Period Mean (intersection) [Pg] |
Benchmark Period Mean (intersection) [Pg] |
Model Period Mean (complement) [Pg] |
Benchmark Period Mean (complement) [Pg] |
Bias [kg m-2] |
Bias Score [1] |
Spatial Distribution Score [1] |
Overall Score [1] |
|||
|---|---|---|---|---|---|---|---|---|---|---|---|---|
| Benchmark | [-] | 13.3 | ||||||||||
| 101 | [-] | 104. | 6.26 | 12.9 | 96.0 | 0.453 | -1.22 | 0.471 | 0.763 | 0.617 | ||
| 105 | [-] | 41.8 | 1.60 | 12.9 | 41.3 | 0.453 | -7.88 | 0.432 | 0.558 | 0.495 | ||
| 111 | [-] | 123. | 5.38 | 12.9 | 117. | 0.453 | -1.99 | 0.409 | 0.667 | 0.538 | ||
| 112 | [-] | 116. | 5.32 | 12.9 | 110. | 0.453 | -2.11 | 0.411 | 0.679 | 0.545 | ||
| 113 | [-] | 113. | 4.56 | 12.9 | 109. | 0.453 | -3.06 | 0.425 | 0.730 | 0.578 | ||
| 114 | [-] | 116. | 4.60 | 12.9 | 110. | 0.453 | -3.02 | 0.428 | 0.728 | 0.578 |
Download Data |
Period Mean (original grids) [Pg] |
Model Period Mean (intersection) [Pg] |
Benchmark Period Mean (intersection) [Pg] |
Model Period Mean (complement) [Pg] |
Benchmark Period Mean (complement) [Pg] |
Bias [kg m-2] |
Bias Score [1] |
Spatial Distribution Score [1] |
Overall Score [1] |
|||
|---|---|---|---|---|---|---|---|---|---|---|---|---|
| Benchmark | [-] | 42.5 | ||||||||||
| 101 | [-] | 16.2 | 13.7 | 41.9 | 1.69 | 0.623 | -5.93 | 0.619 | 0.633 | 0.626 | ||
| 105 | [-] | 13.7 | 11.2 | 41.9 | 1.64 | 0.623 | -6.61 | 0.583 | 0.638 | 0.611 | ||
| 111 | [-] | 21.1 | 17.6 | 41.9 | 2.33 | 0.623 | -3.77 | 0.582 | 0.808 | 0.695 | ||
| 112 | [-] | 22.4 | 18.6 | 41.9 | 2.49 | 0.623 | -3.21 | 0.572 | 0.830 | 0.701 | ||
| 113 | [-] | 17.8 | 14.7 | 41.9 | 1.99 | 0.623 | -5.07 | 0.580 | 0.749 | 0.664 | ||
| 114 | [-] | 21.8 | 18.0 | 41.9 | 2.41 | 0.623 | -3.47 | 0.580 | 0.821 | 0.701 |
Download Data |
Period Mean (original grids) [Pg] |
Model Period Mean (intersection) [Pg] |
Benchmark Period Mean (intersection) [Pg] |
Model Period Mean (complement) [Pg] |
Benchmark Period Mean (complement) [Pg] |
Bias [kg m-2] |
Bias Score [1] |
Spatial Distribution Score [1] |
Overall Score [1] |
|||
|---|---|---|---|---|---|---|---|---|---|---|---|---|
| Benchmark | [-] | 45.3 | ||||||||||
| 101 | [-] | 27.3 | 26.9 | 45.1 | 0.607 | 0.204 | -3.97 | 0.736 | 0.384 | 0.560 | ||
| 105 | [-] | 18.0 | 17.7 | 45.1 | 0.479 | 0.204 | -6.24 | 0.603 | 0.296 | 0.450 | ||
| 111 | [-] | 43.5 | 42.8 | 45.1 | 1.01 | 0.204 | 0.0756 | 0.700 | 0.849 | 0.774 | ||
| 112 | [-] | 40.1 | 39.4 | 45.1 | 0.932 | 0.204 | -0.768 | 0.713 | 0.830 | 0.772 | ||
| 113 | [-] | 34.8 | 34.3 | 45.1 | 0.881 | 0.204 | -2.01 | 0.748 | 0.760 | 0.754 | ||
| 114 | [-] | 33.7 | 33.2 | 45.1 | 0.855 | 0.204 | -2.29 | 0.744 | 0.759 | 0.752 |
Download Data |
Period Mean (original grids) [Pg] |
Model Period Mean (intersection) [Pg] |
Benchmark Period Mean (intersection) [Pg] |
Model Period Mean (complement) [Pg] |
Benchmark Period Mean (complement) [Pg] |
Bias [kg m-2] |
Bias Score [1] |
Spatial Distribution Score [1] |
Overall Score [1] |
|||
|---|---|---|---|---|---|---|---|---|---|---|---|---|
| Benchmark | [-] | 51.3 | ||||||||||
| 101 | [-] | 59.6 | 33.0 | 50.7 | 27.8 | 0.642 | -4.63 | 0.671 | 0.787 | 0.729 | ||
| 105 | [-] | 45.9 | 22.1 | 50.7 | 22.3 | 0.642 | -8.08 | 0.594 | 0.706 | 0.650 | ||
| 111 | [-] | 89.4 | 45.4 | 50.7 | 44.1 | 0.642 | -0.650 | 0.656 | 0.905 | 0.781 | ||
| 112 | [-] | 81.3 | 41.9 | 50.7 | 39.2 | 0.642 | -1.75 | 0.664 | 0.881 | 0.772 | ||
| 113 | [-] | 90.2 | 41.4 | 50.7 | 47.9 | 0.642 | -1.86 | 0.660 | 0.737 | 0.698 | ||
| 114 | [-] | 88.1 | 40.4 | 50.7 | 47.4 | 0.642 | -2.19 | 0.661 | 0.719 | 0.690 |
Download Data |
Period Mean (original grids) [Pg] |
Model Period Mean (intersection) [Pg] |
Benchmark Period Mean (intersection) [Pg] |
Model Period Mean (complement) [Pg] |
Benchmark Period Mean (complement) [Pg] |
Bias [kg m-2] |
Bias Score [1] |
Spatial Distribution Score [1] |
Overall Score [1] |
|||
|---|---|---|---|---|---|---|---|---|---|---|---|---|
| Benchmark | [-] | 34.3 | ||||||||||
| 101 | [-] | 17.9 | 16.8 | 34.2 | 0.611 | 0.0949 | -3.95 | 0.559 | 0.753 | 0.656 | ||
| 105 | [-] | 10.4 | 9.88 | 34.2 | 0.412 | 0.0949 | -5.85 | 0.492 | 0.869 | 0.681 | ||
| 111 | [-] | 21.9 | 20.6 | 34.2 | 0.937 | 0.0949 | -2.83 | 0.567 | 0.553 | 0.560 | ||
| 112 | [-] | 20.2 | 19.3 | 34.2 | 0.744 | 0.0949 | -3.19 | 0.562 | 0.586 | 0.574 | ||
| 113 | [-] | 19.5 | 18.6 | 34.2 | 0.718 | 0.0949 | -3.39 | 0.572 | 0.664 | 0.618 | ||
| 114 | [-] | 19.4 | 18.4 | 34.2 | 0.706 | 0.0949 | -3.43 | 0.574 | 0.675 | 0.624 |
Download Data |
Period Mean (original grids) [Pg] |
Model Period Mean (intersection) [Pg] |
Benchmark Period Mean (intersection) [Pg] |
Model Period Mean (complement) [Pg] |
Benchmark Period Mean (complement) [Pg] |
Bias [kg m-2] |
Bias Score [1] |
Spatial Distribution Score [1] |
Overall Score [1] |
|||
|---|---|---|---|---|---|---|---|---|---|---|---|---|
| Benchmark | [-] | 101. | ||||||||||
| 101 | [-] | 67.1 | 66.2 | 100. | 0.628 | 0.729 | -3.51 | 0.751 | 0.300 | 0.526 | ||
| 105 | [-] | 50.6 | 49.8 | 100. | 0.559 | 0.729 | -5.49 | 0.666 | 0.238 | 0.452 | ||
| 111 | [-] | 79.1 | 78.3 | 100. | 0.752 | 0.729 | -2.02 | 0.759 | 0.438 | 0.598 | ||
| 112 | [-] | 86.0 | 85.1 | 100. | 0.857 | 0.729 | -1.16 | 0.743 | 0.498 | 0.621 | ||
| 113 | [-] | 51.8 | 51.4 | 100. | 0.570 | 0.729 | -5.28 | 0.672 | 0.294 | 0.483 | ||
| 114 | [-] | 75.1 | 74.3 | 100. | 0.782 | 0.729 | -2.48 | 0.748 | 0.416 | 0.582 |
Download Data |
Period Mean (original grids) [Pg] |
Model Period Mean (intersection) [Pg] |
Benchmark Period Mean (intersection) [Pg] |
Model Period Mean (complement) [Pg] |
Benchmark Period Mean (complement) [Pg] |
Bias [kg m-2] |
Bias Score [1] |
Spatial Distribution Score [1] |
Overall Score [1] |
|||
|---|---|---|---|---|---|---|---|---|---|---|---|---|
| Benchmark | [-] | 60.7 | ||||||||||
| 101 | [-] | 46.7 | 45.7 | 60.5 | 0.948 | 0.223 | -1.72 | 0.660 | 0.873 | 0.766 | ||
| 105 | [-] | 38.7 | 38.0 | 60.5 | 0.527 | 0.223 | -3.03 | 0.616 | 0.753 | 0.684 | ||
| 111 | [-] | 52.9 | 51.8 | 60.5 | 0.742 | 0.223 | -0.849 | 0.633 | 0.833 | 0.733 | ||
| 112 | [-] | 56.2 | 55.1 | 60.5 | 0.766 | 0.223 | -0.349 | 0.622 | 0.830 | 0.726 | ||
| 113 | [-] | 50.7 | 49.5 | 60.5 | 0.672 | 0.223 | -1.25 | 0.619 | 0.812 | 0.715 | ||
| 114 | [-] | 56.9 | 55.6 | 60.5 | 0.732 | 0.223 | -0.303 | 0.603 | 0.785 | 0.694 |
Download Data |
Period Mean (original grids) [Pg] |
Model Period Mean (intersection) [Pg] |
Benchmark Period Mean (intersection) [Pg] |
Model Period Mean (complement) [Pg] |
Benchmark Period Mean (complement) [Pg] |
Bias [kg m-2] |
Bias Score [1] |
Spatial Distribution Score [1] |
Overall Score [1] |
|||
|---|---|---|---|---|---|---|---|---|---|---|---|---|
| Benchmark | [-] | 29.6 | ||||||||||
| 101 | [-] | 19.3 | 18.3 | 28.8 | 0.671 | 0.768 | -1.71 | 0.515 | 0.658 | 0.587 | ||
| 105 | [-] | 9.95 | 9.45 | 28.8 | 0.355 | 0.768 | -5.00 | 0.557 | 0.304 | 0.430 | ||
| 111 | [-] | 21.0 | 20.0 | 28.8 | 0.741 | 0.768 | -0.974 | 0.507 | 0.733 | 0.620 | ||
| 112 | [-] | 20.5 | 19.5 | 28.8 | 0.711 | 0.768 | -1.17 | 0.506 | 0.724 | 0.615 | ||
| 113 | [-] | 19.3 | 18.4 | 28.8 | 0.706 | 0.768 | -1.50 | 0.503 | 0.714 | 0.608 | ||
| 114 | [-] | 19.3 | 18.6 | 28.8 | 0.708 | 0.768 | -1.47 | 0.510 | 0.704 | 0.607 |
Temporally integrated period mean