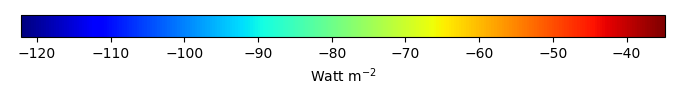
Mean State
Download Data |
Period Mean (original grids) [Watt m-2] |
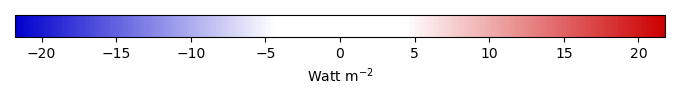
Bias [Watt m-2] |
RMSE [Watt m-2] |
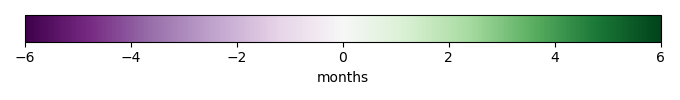
Phase Shift [months] |
Bias Score [1] |
RMSE Score [1] |
Seasonal Cycle Score [1] |
Overall Score [1] |
|||
|---|---|---|---|---|---|---|---|---|---|---|---|
| Benchmark | [-] | -49.2 | |||||||||
| 101 | [-] | -58.3 | -3.96 | 19.2 | 1.03 | 0.278 | 0.298 | 0.930 | 0.451 | ||
| 105 | [-] | -61.1 | -5.71 | 20.4 | 1.03 | 0.343 | 0.275 | 0.930 | 0.456 | ||
| 111 | [-] | -59.0 | -3.26 | 19.3 | 1.03 | 0.225 | 0.296 | 0.930 | 0.437 | ||
| 112 | [-] | -59.2 | -3.86 | 19.4 | 1.03 | 0.259 | 0.297 | 0.930 | 0.446 | ||
| 113 | [-] | -60.4 | -4.50 | 19.6 | 1.03 | 0.273 | 0.304 | 0.930 | 0.453 | ||
| 114 | [-] | -60.4 | -4.51 | 19.6 | 1.03 | 0.274 | 0.303 | 0.930 | 0.453 |
Download Data |
Period Mean (original grids) [Watt m-2] |
Bias [Watt m-2] |
RMSE [Watt m-2] |
Phase Shift [months] |
Bias Score [1] |
RMSE Score [1] |
Seasonal Cycle Score [1] |
Overall Score [1] |
|||
|---|---|---|---|---|---|---|---|---|---|---|---|
| Benchmark | [-] | -64.0 | |||||||||
| 101 | [-] | -66.8 | -6.80 | 14.1 | 0.657 | 0.432 | 0.495 | 0.948 | 0.593 | ||
| 105 | [-] | -68.3 | -8.22 | 14.4 | 0.657 | 0.398 | 0.500 | 0.948 | 0.586 | ||
| 111 | [-] | -67.5 | -7.00 | 14.2 | 0.657 | 0.398 | 0.497 | 0.948 | 0.585 | ||
| 112 | [-] | -67.6 | -7.32 | 14.4 | 0.657 | 0.389 | 0.497 | 0.948 | 0.583 | ||
| 113 | [-] | -68.0 | -7.54 | 14.4 | 0.657 | 0.375 | 0.500 | 0.948 | 0.581 | ||
| 114 | [-] | -68.0 | -7.58 | 14.5 | 0.657 | 0.374 | 0.499 | 0.948 | 0.580 |
Download Data |
Period Mean (original grids) [Watt m-2] |
Bias [Watt m-2] |
RMSE [Watt m-2] |
Phase Shift [months] |
Bias Score [1] |
RMSE Score [1] |
Seasonal Cycle Score [1] |
Overall Score [1] |
|||
|---|---|---|---|---|---|---|---|---|---|---|---|
| Benchmark | [-] | -109. | |||||||||
| 101 | [-] | -107. | -0.471 | 9.43 | 0.00 | 0.972 | 0.569 | 1.00 | 0.778 | ||
| 105 | [-] | -107. | -0.502 | 9.45 | 0.00 | 0.970 | 0.569 | 1.00 | 0.777 | ||
| 111 | [-] | -107. | -0.486 | 9.37 | 0.00 | 0.971 | 0.572 | 1.00 | 0.779 | ||
| 112 | [-] | -107. | -0.500 | 9.39 | 0.00 | 0.970 | 0.571 | 1.00 | 0.778 | ||
| 113 | [-] | -107. | -0.494 | 9.40 | 0.00 | 0.971 | 0.571 | 1.00 | 0.778 | ||
| 114 | [-] | -107. | -0.488 | 9.39 | 0.00 | 0.971 | 0.571 | 1.00 | 0.778 |
Download Data |
Period Mean (original grids) [Watt m-2] |
Bias [Watt m-2] |
RMSE [Watt m-2] |
Phase Shift [months] |
Bias Score [1] |
RMSE Score [1] |
Seasonal Cycle Score [1] |
Overall Score [1] |
|||
|---|---|---|---|---|---|---|---|---|---|---|---|
| Benchmark | [-] | -31.3 | |||||||||
| 101 | [-] | -41.6 | -12.7 | 15.8 | 0.00 | 0.00 | 0.457 | 1.00 | 0.478 | ||
| 105 | [-] | -40.6 | -12.4 | 15.2 | 0.00 | 0.00 | 0.484 | 1.00 | 0.492 | ||
| 111 | [-] | -40.6 | -12.3 | 15.2 | 0.00 | 0.00 | 0.484 | 1.00 | 0.492 | ||
| 112 | [-] | -40.6 | -12.3 | 15.2 | 0.00 | 0.00 | 0.484 | 1.00 | 0.492 | ||
| 113 | [-] | -40.6 | -12.4 | 15.2 | 0.00 | 0.00 | 0.484 | 1.00 | 0.492 | ||
| 114 | [-] | -40.6 | -12.4 | 15.2 | 0.00 | 0.00 | 0.484 | 1.00 | 0.492 |
Download Data |
Period Mean (original grids) [Watt m-2] |
Bias [Watt m-2] |
RMSE [Watt m-2] |
Phase Shift [months] |
Bias Score [1] |
RMSE Score [1] |
Seasonal Cycle Score [1] |
Overall Score [1] |
|||
|---|---|---|---|---|---|---|---|---|---|---|---|
| Benchmark | [-] | -54.8 | |||||||||
| 101 | [-] | -62.8 | -6.77 | 11.4 | 0.827 | 0.479 | 0.511 | 0.944 | 0.612 | ||
| 105 | [-] | -65.3 | -8.94 | 12.7 | 0.827 | 0.323 | 0.509 | 0.944 | 0.571 | ||
| 111 | [-] | -63.7 | -7.31 | 11.7 | 0.827 | 0.442 | 0.505 | 0.944 | 0.599 | ||
| 112 | [-] | -63.8 | -7.41 | 11.7 | 0.827 | 0.435 | 0.508 | 0.944 | 0.599 | ||
| 113 | [-] | -65.0 | -8.69 | 12.6 | 0.827 | 0.339 | 0.507 | 0.944 | 0.575 | ||
| 114 | [-] | -64.9 | -8.61 | 12.5 | 0.827 | 0.347 | 0.507 | 0.944 | 0.576 |
Download Data |
Period Mean (original grids) [Watt m-2] |
Bias [Watt m-2] |
RMSE [Watt m-2] |
Phase Shift [months] |
Bias Score [1] |
RMSE Score [1] |
Seasonal Cycle Score [1] |
Overall Score [1] |
|||
|---|---|---|---|---|---|---|---|---|---|---|---|
| Benchmark | [-] | -88.8 | |||||||||
| 101 | [-] | -93.3 | -4.55 | 12.7 | 0.258 | 0.423 | 0.564 | 0.983 | 0.634 | ||
| 105 | [-] | -94.9 | -6.09 | 11.8 | 0.258 | 0.474 | 0.588 | 0.983 | 0.658 | ||
| 111 | [-] | -93.9 | -5.10 | 12.8 | 0.258 | 0.387 | 0.573 | 0.983 | 0.629 | ||
| 112 | [-] | -94.6 | -5.78 | 13.3 | 0.258 | 0.347 | 0.567 | 0.983 | 0.616 | ||
| 113 | [-] | -93.4 | -4.63 | 12.4 | 0.258 | 0.415 | 0.575 | 0.983 | 0.637 | ||
| 114 | [-] | -93.6 | -4.84 | 12.6 | 0.258 | 0.404 | 0.573 | 0.983 | 0.633 |
Temporally integrated period mean