Mean State
Download Data |
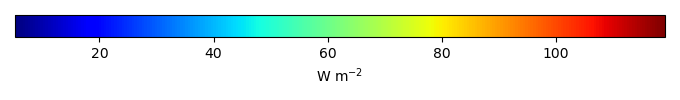
Period Mean (original grids) [W m-2] |
Model Period Mean (intersection) [W m-2] |
Benchmark Period Mean (intersection) [W m-2] |
Model Period Mean (complement) [W m-2] |
Benchmark Period Mean (complement) [W m-2] |
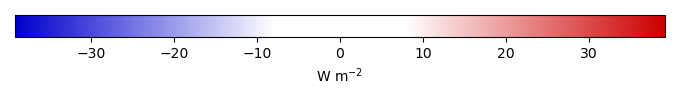
Bias [W m-2] |
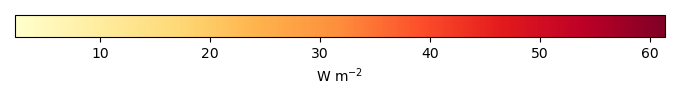
RMSE [W m-2] |
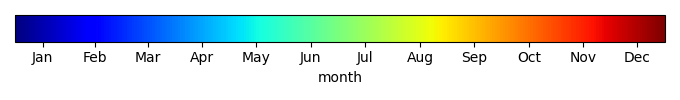
Phase Shift [months] |
Bias Score [1] |
RMSE Score [1] |
Seasonal Cycle Score [1] |
Spatial Distribution Score [1] |
Overall Score [1] |
|||
|---|---|---|---|---|---|---|---|---|---|---|---|---|---|---|---|---|
| Benchmark | [-] | 29.7 | ||||||||||||||
| 101 | [-] | 40.8 | 41.4 | 30.1 | 10.4 | 11.9 | 12.7 | 1.54 | 0.185 | 0.727 | 0.780 | 0.965 | 0.677 | |||
| 105 | [-] | 39.7 | 40.2 | 30.1 | 10.4 | 10.8 | 11.9 | 1.50 | 0.222 | 0.732 | 0.789 | 0.964 | 0.688 | |||
| 111 | [-] | 40.8 | 41.3 | 30.1 | 10.4 | 11.9 | 12.9 | 1.54 | 0.190 | 0.717 | 0.780 | 0.966 | 0.674 | |||
| 112 | [-] | 40.8 | 41.3 | 30.1 | 10.4 | 11.9 | 12.9 | 1.58 | 0.187 | 0.716 | 0.772 | 0.966 | 0.672 | |||
| 113 | [-] | 39.7 | 40.2 | 30.1 | 10.4 | 10.8 | 11.9 | 1.58 | 0.219 | 0.730 | 0.771 | 0.962 | 0.682 | |||
| 114 | [-] | 40.7 | 41.2 | 30.1 | 10.4 | 11.7 | 12.8 | 1.54 | 0.194 | 0.719 | 0.780 | 0.965 | 0.675 |
Download Data |
Period Mean (original grids) [W m-2] |
Model Period Mean (intersection) [W m-2] |
Benchmark Period Mean (intersection) [W m-2] |
Model Period Mean (complement) [W m-2] |
Benchmark Period Mean (complement) [W m-2] |
Bias [W m-2] |
RMSE [W m-2] |
Phase Shift [months] |
Bias Score [1] |
RMSE Score [1] |
Seasonal Cycle Score [1] |
Spatial Distribution Score [1] |
Overall Score [1] |
|||
|---|---|---|---|---|---|---|---|---|---|---|---|---|---|---|---|---|
| Benchmark | [-] | 43.8 | ||||||||||||||
| 101 | [-] | 48.4 | 48.8 | 43.9 | 13.2 | 4.37 | 9.88 | 1.27 | 0.419 | 0.693 | 0.843 | 0.952 | 0.720 | |||
| 105 | [-] | 47.0 | 47.4 | 43.9 | 13.2 | 3.01 | 9.24 | 1.30 | 0.458 | 0.694 | 0.838 | 0.953 | 0.727 | |||
| 111 | [-] | 47.9 | 48.4 | 43.9 | 13.2 | 3.98 | 9.69 | 1.25 | 0.431 | 0.684 | 0.845 | 0.954 | 0.720 | |||
| 112 | [-] | 48.1 | 48.6 | 43.9 | 13.2 | 4.15 | 9.80 | 1.26 | 0.426 | 0.684 | 0.844 | 0.953 | 0.718 | |||
| 113 | [-] | 47.9 | 48.3 | 43.9 | 13.2 | 3.87 | 9.69 | 1.26 | 0.434 | 0.680 | 0.841 | 0.954 | 0.718 | |||
| 114 | [-] | 47.8 | 48.3 | 43.9 | 13.2 | 3.80 | 9.67 | 1.26 | 0.435 | 0.682 | 0.843 | 0.957 | 0.720 |
Download Data |
Period Mean (original grids) [W m-2] |
Model Period Mean (intersection) [W m-2] |
Benchmark Period Mean (intersection) [W m-2] |
Model Period Mean (complement) [W m-2] |
Benchmark Period Mean (complement) [W m-2] |
Bias [W m-2] |
RMSE [W m-2] |
Phase Shift [months] |
Bias Score [1] |
RMSE Score [1] |
Seasonal Cycle Score [1] |
Spatial Distribution Score [1] |
Overall Score [1] |
|||
|---|---|---|---|---|---|---|---|---|---|---|---|---|---|---|---|---|
| Benchmark | [-] | 33.1 | ||||||||||||||
| 101 | [-] | 40.9 | 40.7 | 33.6 | 15.0 | 7.31 | 9.14 | 1.38 | 0.436 | 0.764 | 0.807 | 0.921 | 0.738 | |||
| 105 | [-] | 39.6 | 39.4 | 33.6 | 15.0 | 6.01 | 8.47 | 1.35 | 0.478 | 0.771 | 0.809 | 0.886 | 0.743 | |||
| 111 | [-] | 40.4 | 40.3 | 33.6 | 15.0 | 6.86 | 9.08 | 1.32 | 0.431 | 0.767 | 0.815 | 0.882 | 0.733 | |||
| 112 | [-] | 40.6 | 40.4 | 33.6 | 15.0 | 6.99 | 9.18 | 1.36 | 0.421 | 0.767 | 0.810 | 0.877 | 0.728 | |||
| 113 | [-] | 40.4 | 40.3 | 33.6 | 15.0 | 6.81 | 9.01 | 1.35 | 0.429 | 0.768 | 0.809 | 0.882 | 0.731 | |||
| 114 | [-] | 40.4 | 40.3 | 33.6 | 15.0 | 6.84 | 9.04 | 1.32 | 0.433 | 0.768 | 0.816 | 0.883 | 0.734 |
Download Data |
Period Mean (original grids) [W m-2] |
Model Period Mean (intersection) [W m-2] |
Benchmark Period Mean (intersection) [W m-2] |
Model Period Mean (complement) [W m-2] |
Benchmark Period Mean (complement) [W m-2] |
Bias [W m-2] |
RMSE [W m-2] |
Phase Shift [months] |
Bias Score [1] |
RMSE Score [1] |
Seasonal Cycle Score [1] |
Spatial Distribution Score [1] |
Overall Score [1] |
|||
|---|---|---|---|---|---|---|---|---|---|---|---|---|---|---|---|---|
| Benchmark | [-] | 39.5 | ||||||||||||||
| 101 | [-] | 33.6 | 33.4 | 39.7 | 34.5 | -6.10 | 18.4 | 0.168 | 0.460 | 0.446 | 0.989 | 0.617 | 0.592 | |||
| 105 | [-] | 35.9 | 35.7 | 39.7 | 34.5 | -3.90 | 13.5 | 0.143 | 0.571 | 0.625 | 0.990 | 0.682 | 0.699 | |||
| 111 | [-] | 34.7 | 34.5 | 39.7 | 34.5 | -5.08 | 15.3 | 0.126 | 0.516 | 0.563 | 0.992 | 0.752 | 0.677 | |||
| 112 | [-] | 34.7 | 34.5 | 39.7 | 34.5 | -5.07 | 15.3 | 0.126 | 0.516 | 0.564 | 0.992 | 0.752 | 0.678 | |||
| 113 | [-] | 36.5 | 36.3 | 39.7 | 34.5 | -3.39 | 12.9 | 0.115 | 0.598 | 0.639 | 0.992 | 0.643 | 0.702 | |||
| 114 | [-] | 36.3 | 36.2 | 39.7 | 34.5 | -3.50 | 13.0 | 0.114 | 0.593 | 0.634 | 0.992 | 0.664 | 0.704 |
Download Data |
Period Mean (original grids) [W m-2] |
Model Period Mean (intersection) [W m-2] |
Benchmark Period Mean (intersection) [W m-2] |
Model Period Mean (complement) [W m-2] |
Benchmark Period Mean (complement) [W m-2] |
Bias [W m-2] |
RMSE [W m-2] |
Phase Shift [months] |
Bias Score [1] |
RMSE Score [1] |
Seasonal Cycle Score [1] |
Spatial Distribution Score [1] |
Overall Score [1] |
|||
|---|---|---|---|---|---|---|---|---|---|---|---|---|---|---|---|---|
| Benchmark | [-] | 18.1 | ||||||||||||||
| 101 | [-] | 41.9 | 41.8 | 18.7 | 12.9 | 23.2 | 23.6 | 2.46 | 0.000572 | 0.734 | 0.601 | 0.644 | 0.543 | |||
| 105 | [-] | 40.8 | 40.7 | 18.7 | 12.9 | 22.3 | 22.6 | 2.47 | 0.00134 | 0.740 | 0.598 | 0.625 | 0.541 | |||
| 111 | [-] | 42.3 | 42.2 | 18.7 | 12.9 | 23.8 | 24.1 | 2.44 | 0.000375 | 0.732 | 0.603 | 0.654 | 0.544 | |||
| 112 | [-] | 42.4 | 42.3 | 18.7 | 12.9 | 23.8 | 24.2 | 2.42 | 0.000283 | 0.730 | 0.606 | 0.649 | 0.543 | |||
| 113 | [-] | 39.9 | 39.8 | 18.7 | 12.9 | 21.4 | 21.8 | 2.44 | 0.00298 | 0.742 | 0.603 | 0.615 | 0.541 | |||
| 114 | [-] | 42.2 | 42.1 | 18.7 | 12.9 | 23.6 | 24.0 | 2.43 | 0.000550 | 0.732 | 0.606 | 0.666 | 0.547 |
Download Data |
Period Mean (original grids) [W m-2] |
Model Period Mean (intersection) [W m-2] |
Benchmark Period Mean (intersection) [W m-2] |
Model Period Mean (complement) [W m-2] |
Benchmark Period Mean (complement) [W m-2] |
Bias [W m-2] |
RMSE [W m-2] |
Phase Shift [months] |
Bias Score [1] |
RMSE Score [1] |
Seasonal Cycle Score [1] |
Spatial Distribution Score [1] |
Overall Score [1] |
|||
|---|---|---|---|---|---|---|---|---|---|---|---|---|---|---|---|---|
| Benchmark | [-] | 26.1 | ||||||||||||||
| 101 | [-] | 26.6 | 26.4 | 26.1 | 25.3 | 0.355 | 9.80 | 0.548 | 0.641 | 0.533 | 0.937 | 0.766 | 0.682 | |||
| 105 | [-] | 26.6 | 26.4 | 26.1 | 25.3 | 0.400 | 9.04 | 0.462 | 0.641 | 0.568 | 0.953 | 0.806 | 0.707 | |||
| 111 | [-] | 26.5 | 26.3 | 26.1 | 25.3 | 0.238 | 9.38 | 0.475 | 0.639 | 0.550 | 0.947 | 0.788 | 0.695 | |||
| 112 | [-] | 26.5 | 26.3 | 26.1 | 25.3 | 0.240 | 9.31 | 0.458 | 0.633 | 0.554 | 0.951 | 0.786 | 0.696 | |||
| 113 | [-] | 26.8 | 26.6 | 26.1 | 25.3 | 0.552 | 9.35 | 0.514 | 0.637 | 0.553 | 0.944 | 0.793 | 0.696 | |||
| 114 | [-] | 26.8 | 26.5 | 26.1 | 25.3 | 0.538 | 9.33 | 0.488 | 0.633 | 0.555 | 0.949 | 0.795 | 0.698 |
Download Data |
Period Mean (original grids) [W m-2] |
Model Period Mean (intersection) [W m-2] |
Benchmark Period Mean (intersection) [W m-2] |
Model Period Mean (complement) [W m-2] |
Benchmark Period Mean (complement) [W m-2] |
Bias [W m-2] |
RMSE [W m-2] |
Phase Shift [months] |
Bias Score [1] |
RMSE Score [1] |
Seasonal Cycle Score [1] |
Spatial Distribution Score [1] |
Overall Score [1] |
|||
|---|---|---|---|---|---|---|---|---|---|---|---|---|---|---|---|---|
| Benchmark | [-] | 34.3 | ||||||||||||||
| 101 | [-] | 37.3 | 37.3 | 34.5 | 8.95 | 2.21 | 11.1 | 0.977 | 0.407 | 0.517 | 0.871 | 0.821 | 0.627 | |||
| 105 | [-] | 37.3 | 37.2 | 34.5 | 8.95 | 2.14 | 10.8 | 0.928 | 0.416 | 0.531 | 0.879 | 0.833 | 0.638 | |||
| 111 | [-] | 37.6 | 37.5 | 34.5 | 8.95 | 2.45 | 10.8 | 0.927 | 0.420 | 0.524 | 0.878 | 0.845 | 0.638 | |||
| 112 | [-] | 37.6 | 37.5 | 34.5 | 8.95 | 2.42 | 10.8 | 0.930 | 0.421 | 0.526 | 0.877 | 0.845 | 0.639 | |||
| 113 | [-] | 37.6 | 37.5 | 34.5 | 8.95 | 2.40 | 10.8 | 0.940 | 0.418 | 0.529 | 0.877 | 0.843 | 0.639 | |||
| 114 | [-] | 37.6 | 37.5 | 34.5 | 8.95 | 2.44 | 10.8 | 0.940 | 0.419 | 0.530 | 0.876 | 0.844 | 0.640 |
Download Data |
Period Mean (original grids) [W m-2] |
Model Period Mean (intersection) [W m-2] |
Benchmark Period Mean (intersection) [W m-2] |
Model Period Mean (complement) [W m-2] |
Benchmark Period Mean (complement) [W m-2] |
Bias [W m-2] |
RMSE [W m-2] |
Phase Shift [months] |
Bias Score [1] |
RMSE Score [1] |
Seasonal Cycle Score [1] |
Spatial Distribution Score [1] |
Overall Score [1] |
|||
|---|---|---|---|---|---|---|---|---|---|---|---|---|---|---|---|---|
| Benchmark | [-] | 27.3 | ||||||||||||||
| 101 | [-] | 41.6 | 41.8 | 27.6 | 13.0 | 13.6 | 15.9 | 0.931 | 0.112 | 0.616 | 0.894 | 0.786 | 0.605 | |||
| 105 | [-] | 40.7 | 40.9 | 27.6 | 13.0 | 12.6 | 14.9 | 0.922 | 0.135 | 0.627 | 0.895 | 0.800 | 0.617 | |||
| 111 | [-] | 41.4 | 41.6 | 27.6 | 13.0 | 13.3 | 15.6 | 0.930 | 0.120 | 0.613 | 0.894 | 0.801 | 0.608 | |||
| 112 | [-] | 41.4 | 41.6 | 27.6 | 13.0 | 13.4 | 15.7 | 0.942 | 0.121 | 0.610 | 0.893 | 0.799 | 0.606 | |||
| 113 | [-] | 40.8 | 41.0 | 27.6 | 13.0 | 12.6 | 14.9 | 0.937 | 0.133 | 0.617 | 0.894 | 0.818 | 0.616 | |||
| 114 | [-] | 41.2 | 41.4 | 27.6 | 13.0 | 13.1 | 15.4 | 0.934 | 0.124 | 0.612 | 0.894 | 0.804 | 0.609 |
Download Data |
Period Mean (original grids) [W m-2] |
Model Period Mean (intersection) [W m-2] |
Benchmark Period Mean (intersection) [W m-2] |
Model Period Mean (complement) [W m-2] |
Benchmark Period Mean (complement) [W m-2] |
Bias [W m-2] |
RMSE [W m-2] |
Phase Shift [months] |
Bias Score [1] |
RMSE Score [1] |
Seasonal Cycle Score [1] |
Spatial Distribution Score [1] |
Overall Score [1] |
|||
|---|---|---|---|---|---|---|---|---|---|---|---|---|---|---|---|---|
| Benchmark | [-] | 35.0 | ||||||||||||||
| 101 | [-] | 32.0 | 31.6 | 35.0 | 40.4 | -2.98 | 14.4 | 0.165 | 0.633 | 0.503 | 0.989 | 0.813 | 0.688 | |||
| 105 | [-] | 34.2 | 33.7 | 35.0 | 40.4 | -1.02 | 12.0 | 0.187 | 0.713 | 0.587 | 0.987 | 0.893 | 0.754 | |||
| 111 | [-] | 33.1 | 32.7 | 35.0 | 40.4 | -2.01 | 12.5 | 0.160 | 0.677 | 0.570 | 0.989 | 0.875 | 0.736 | |||
| 112 | [-] | 33.1 | 32.7 | 35.0 | 40.4 | -1.95 | 12.5 | 0.158 | 0.680 | 0.575 | 0.989 | 0.871 | 0.738 | |||
| 113 | [-] | 34.5 | 34.0 | 35.0 | 40.4 | -0.732 | 11.8 | 0.171 | 0.717 | 0.594 | 0.989 | 0.882 | 0.755 | |||
| 114 | [-] | 34.2 | 33.8 | 35.0 | 40.4 | -0.946 | 12.0 | 0.171 | 0.710 | 0.589 | 0.989 | 0.885 | 0.752 |
Download Data |
Period Mean (original grids) [W m-2] |
Model Period Mean (intersection) [W m-2] |
Benchmark Period Mean (intersection) [W m-2] |
Model Period Mean (complement) [W m-2] |
Benchmark Period Mean (complement) [W m-2] |
Bias [W m-2] |
RMSE [W m-2] |
Phase Shift [months] |
Bias Score [1] |
RMSE Score [1] |
Seasonal Cycle Score [1] |
Spatial Distribution Score [1] |
Overall Score [1] |
|||
|---|---|---|---|---|---|---|---|---|---|---|---|---|---|---|---|---|
| Benchmark | [-] | 36.2 | ||||||||||||||
| 101 | [-] | 44.8 | 44.9 | 37.1 | 13.3 | 6.60 | 9.23 | 0.597 | 0.548 | 0.828 | 0.952 | 0.682 | 0.768 | |||
| 105 | [-] | 42.1 | 42.2 | 37.1 | 13.3 | 4.07 | 8.08 | 0.564 | 0.615 | 0.835 | 0.957 | 0.691 | 0.787 | |||
| 111 | [-] | 42.9 | 43.0 | 37.1 | 13.3 | 4.87 | 8.37 | 0.532 | 0.598 | 0.832 | 0.960 | 0.696 | 0.784 | |||
| 112 | [-] | 42.9 | 43.0 | 37.1 | 13.3 | 4.76 | 8.26 | 0.523 | 0.601 | 0.833 | 0.961 | 0.724 | 0.790 | |||
| 113 | [-] | 43.1 | 43.2 | 37.1 | 13.3 | 5.02 | 8.40 | 0.534 | 0.596 | 0.834 | 0.960 | 0.675 | 0.780 | |||
| 114 | [-] | 43.2 | 43.2 | 37.1 | 13.3 | 5.13 | 8.47 | 0.540 | 0.593 | 0.834 | 0.960 | 0.668 | 0.778 |
Download Data |
Period Mean (original grids) [W m-2] |
Model Period Mean (intersection) [W m-2] |
Benchmark Period Mean (intersection) [W m-2] |
Model Period Mean (complement) [W m-2] |
Benchmark Period Mean (complement) [W m-2] |
Bias [W m-2] |
RMSE [W m-2] |
Phase Shift [months] |
Bias Score [1] |
RMSE Score [1] |
Seasonal Cycle Score [1] |
Spatial Distribution Score [1] |
Overall Score [1] |
|||
|---|---|---|---|---|---|---|---|---|---|---|---|---|---|---|---|---|
| Benchmark | [-] | 19.2 | ||||||||||||||
| 101 | [-] | 27.9 | 27.9 | 19.4 | 8.38 | 8.37 | 11.0 | 0.531 | 0.282 | 0.575 | 0.947 | 0.849 | 0.646 | |||
| 105 | [-] | 27.9 | 28.0 | 19.4 | 8.38 | 8.36 | 10.9 | 0.475 | 0.280 | 0.591 | 0.953 | 0.840 | 0.651 | |||
| 111 | [-] | 28.0 | 28.1 | 19.4 | 8.38 | 8.52 | 11.1 | 0.527 | 0.270 | 0.570 | 0.947 | 0.853 | 0.642 | |||
| 112 | [-] | 28.0 | 28.1 | 19.4 | 8.38 | 8.45 | 11.0 | 0.519 | 0.274 | 0.577 | 0.948 | 0.854 | 0.646 | |||
| 113 | [-] | 28.3 | 28.4 | 19.4 | 8.38 | 8.77 | 11.3 | 0.469 | 0.250 | 0.571 | 0.954 | 0.846 | 0.638 | |||
| 114 | [-] | 28.4 | 28.5 | 19.4 | 8.38 | 8.85 | 11.4 | 0.473 | 0.245 | 0.570 | 0.953 | 0.852 | 0.638 |
Download Data |
Period Mean (original grids) [W m-2] |
Model Period Mean (intersection) [W m-2] |
Benchmark Period Mean (intersection) [W m-2] |
Model Period Mean (complement) [W m-2] |
Benchmark Period Mean (complement) [W m-2] |
Bias [W m-2] |
RMSE [W m-2] |
Phase Shift [months] |
Bias Score [1] |
RMSE Score [1] |
Seasonal Cycle Score [1] |
Spatial Distribution Score [1] |
Overall Score [1] |
|||
|---|---|---|---|---|---|---|---|---|---|---|---|---|---|---|---|---|
| Benchmark | [-] | 43.1 | ||||||||||||||
| 101 | [-] | 48.5 | 48.5 | 43.6 | 18.4 | 3.77 | 13.5 | 0.821 | 0.402 | 0.622 | 0.896 | 0.978 | 0.704 | |||
| 105 | [-] | 48.2 | 48.2 | 43.6 | 18.4 | 3.45 | 12.8 | 0.803 | 0.425 | 0.638 | 0.899 | 0.981 | 0.716 | |||
| 111 | [-] | 48.5 | 48.6 | 43.6 | 18.4 | 3.84 | 13.2 | 0.799 | 0.412 | 0.629 | 0.899 | 0.980 | 0.710 | |||
| 112 | [-] | 48.5 | 48.6 | 43.6 | 18.4 | 3.84 | 13.2 | 0.802 | 0.411 | 0.630 | 0.898 | 0.980 | 0.710 | |||
| 113 | [-] | 48.5 | 48.5 | 43.6 | 18.4 | 3.74 | 12.8 | 0.801 | 0.420 | 0.636 | 0.898 | 0.980 | 0.714 | |||
| 114 | [-] | 48.7 | 48.7 | 43.6 | 18.4 | 3.96 | 13.1 | 0.795 | 0.413 | 0.634 | 0.899 | 0.980 | 0.712 |
Download Data |
Period Mean (original grids) [W m-2] |
Model Period Mean (intersection) [W m-2] |
Benchmark Period Mean (intersection) [W m-2] |
Model Period Mean (complement) [W m-2] |
Benchmark Period Mean (complement) [W m-2] |
Bias [W m-2] |
RMSE [W m-2] |
Phase Shift [months] |
Bias Score [1] |
RMSE Score [1] |
Seasonal Cycle Score [1] |
Spatial Distribution Score [1] |
Overall Score [1] |
|||
|---|---|---|---|---|---|---|---|---|---|---|---|---|---|---|---|---|
| Benchmark | [-] | 72.2 | ||||||||||||||
| 101 | [-] | 80.9 | 81.4 | 72.6 | 12.7 | 5.98 | 14.8 | 0.664 | 0.442 | 0.683 | 0.933 | 0.977 | 0.744 | |||
| 105 | [-] | 80.8 | 81.3 | 72.6 | 12.7 | 5.84 | 14.8 | 0.650 | 0.441 | 0.683 | 0.934 | 0.978 | 0.744 | |||
| 111 | [-] | 81.0 | 81.5 | 72.6 | 12.7 | 6.04 | 14.8 | 0.656 | 0.442 | 0.682 | 0.934 | 0.978 | 0.744 | |||
| 112 | [-] | 81.0 | 81.5 | 72.6 | 12.7 | 6.01 | 14.8 | 0.648 | 0.443 | 0.683 | 0.934 | 0.978 | 0.744 | |||
| 113 | [-] | 81.0 | 81.5 | 72.6 | 12.7 | 6.01 | 14.8 | 0.640 | 0.442 | 0.683 | 0.935 | 0.978 | 0.744 | |||
| 114 | [-] | 81.0 | 81.5 | 72.6 | 12.7 | 6.05 | 14.9 | 0.640 | 0.442 | 0.682 | 0.935 | 0.977 | 0.744 |
Download Data |
Period Mean (original grids) [W m-2] |
Model Period Mean (intersection) [W m-2] |
Benchmark Period Mean (intersection) [W m-2] |
Model Period Mean (complement) [W m-2] |
Benchmark Period Mean (complement) [W m-2] |
Bias [W m-2] |
RMSE [W m-2] |
Phase Shift [months] |
Bias Score [1] |
RMSE Score [1] |
Seasonal Cycle Score [1] |
Spatial Distribution Score [1] |
Overall Score [1] |
|||
|---|---|---|---|---|---|---|---|---|---|---|---|---|---|---|---|---|
| Benchmark | [-] | 43.8 | ||||||||||||||
| 101 | [-] | 38.5 | 38.4 | 43.9 | 37.3 | -4.59 | 17.5 | 0.166 | 0.528 | 0.412 | 0.987 | 0.914 | 0.651 | |||
| 105 | [-] | 40.0 | 39.9 | 43.9 | 37.3 | -3.07 | 15.8 | 0.169 | 0.566 | 0.476 | 0.987 | 0.949 | 0.691 | |||
| 111 | [-] | 39.5 | 39.4 | 43.9 | 37.3 | -3.57 | 16.5 | 0.166 | 0.557 | 0.448 | 0.987 | 0.952 | 0.678 | |||
| 112 | [-] | 39.5 | 39.4 | 43.9 | 37.3 | -3.62 | 16.6 | 0.166 | 0.556 | 0.447 | 0.987 | 0.953 | 0.678 | |||
| 113 | [-] | 40.2 | 40.1 | 43.9 | 37.3 | -2.90 | 15.5 | 0.172 | 0.579 | 0.486 | 0.987 | 0.942 | 0.696 | |||
| 114 | [-] | 40.1 | 40.0 | 43.9 | 37.3 | -3.01 | 15.7 | 0.171 | 0.574 | 0.481 | 0.987 | 0.943 | 0.693 |
Download Data |
Period Mean (original grids) [W m-2] |
Model Period Mean (intersection) [W m-2] |
Benchmark Period Mean (intersection) [W m-2] |
Model Period Mean (complement) [W m-2] |
Benchmark Period Mean (complement) [W m-2] |
Bias [W m-2] |
RMSE [W m-2] |
Phase Shift [months] |
Bias Score [1] |
RMSE Score [1] |
Seasonal Cycle Score [1] |
Spatial Distribution Score [1] |
Overall Score [1] |
|||
|---|---|---|---|---|---|---|---|---|---|---|---|---|---|---|---|---|
| Benchmark | [-] | 25.7 | ||||||||||||||
| 101 | [-] | 39.5 | 39.6 | 26.4 | 13.4 | 12.4 | 15.3 | 1.18 | 0.256 | 0.715 | 0.845 | 0.444 | 0.595 | |||
| 105 | [-] | 37.7 | 37.7 | 26.4 | 13.4 | 10.9 | 14.7 | 1.15 | 0.269 | 0.723 | 0.848 | 0.416 | 0.596 | |||
| 111 | [-] | 38.9 | 38.9 | 26.4 | 13.4 | 11.9 | 15.4 | 1.16 | 0.260 | 0.710 | 0.847 | 0.455 | 0.597 | |||
| 112 | [-] | 38.8 | 38.9 | 26.4 | 13.4 | 11.9 | 15.4 | 1.17 | 0.262 | 0.711 | 0.844 | 0.458 | 0.597 | |||
| 113 | [-] | 38.3 | 38.3 | 26.4 | 13.4 | 11.2 | 14.6 | 1.17 | 0.273 | 0.721 | 0.845 | 0.416 | 0.595 | |||
| 114 | [-] | 38.8 | 38.8 | 26.4 | 13.4 | 11.8 | 15.3 | 1.18 | 0.264 | 0.713 | 0.844 | 0.465 | 0.600 |
Download Data |
Period Mean (original grids) [W m-2] |
Model Period Mean (intersection) [W m-2] |
Benchmark Period Mean (intersection) [W m-2] |
Model Period Mean (complement) [W m-2] |
Benchmark Period Mean (complement) [W m-2] |
Bias [W m-2] |
RMSE [W m-2] |
Phase Shift [months] |
Bias Score [1] |
RMSE Score [1] |
Seasonal Cycle Score [1] |
Spatial Distribution Score [1] |
Overall Score [1] |
|||
|---|---|---|---|---|---|---|---|---|---|---|---|---|---|---|---|---|
| Benchmark | [-] | 25.8 | ||||||||||||||
| 101 | [-] | 32.8 | 32.9 | 26.0 | 12.5 | 6.47 | 9.04 | 0.765 | 0.306 | 0.603 | 0.891 | 0.382 | 0.557 | |||
| 105 | [-] | 32.7 | 32.7 | 26.0 | 12.5 | 6.20 | 8.92 | 0.759 | 0.339 | 0.594 | 0.892 | 0.436 | 0.571 | |||
| 111 | [-] | 32.7 | 32.8 | 26.0 | 12.5 | 6.28 | 8.80 | 0.771 | 0.324 | 0.608 | 0.891 | 0.417 | 0.570 | |||
| 112 | [-] | 32.6 | 32.7 | 26.0 | 12.5 | 6.17 | 8.71 | 0.769 | 0.330 | 0.612 | 0.891 | 0.412 | 0.571 | |||
| 113 | [-] | 32.6 | 32.7 | 26.0 | 12.5 | 6.23 | 8.70 | 0.760 | 0.334 | 0.616 | 0.891 | 0.400 | 0.572 | |||
| 114 | [-] | 32.7 | 32.8 | 26.0 | 12.5 | 6.28 | 8.80 | 0.757 | 0.332 | 0.610 | 0.891 | 0.428 | 0.574 |
Download Data |
Period Mean (original grids) [W m-2] |
Model Period Mean (intersection) [W m-2] |
Benchmark Period Mean (intersection) [W m-2] |
Model Period Mean (complement) [W m-2] |
Benchmark Period Mean (complement) [W m-2] |
Bias [W m-2] |
RMSE [W m-2] |
Phase Shift [months] |
Bias Score [1] |
RMSE Score [1] |
Seasonal Cycle Score [1] |
Spatial Distribution Score [1] |
Overall Score [1] |
|||
|---|---|---|---|---|---|---|---|---|---|---|---|---|---|---|---|---|
| Benchmark | [-] | 24.9 | ||||||||||||||
| 101 | [-] | 29.9 | 30.0 | 25.1 | 10.1 | 4.69 | 11.4 | 0.508 | 0.413 | 0.437 | 0.941 | 0.768 | 0.599 | |||
| 105 | [-] | 30.0 | 30.1 | 25.1 | 10.1 | 4.83 | 11.5 | 0.484 | 0.410 | 0.425 | 0.944 | 0.818 | 0.605 | |||
| 111 | [-] | 29.7 | 29.8 | 25.1 | 10.1 | 4.49 | 11.2 | 0.504 | 0.426 | 0.441 | 0.941 | 0.811 | 0.612 | |||
| 112 | [-] | 29.5 | 29.6 | 25.1 | 10.1 | 4.31 | 11.2 | 0.520 | 0.432 | 0.440 | 0.940 | 0.810 | 0.612 | |||
| 113 | [-] | 30.1 | 30.3 | 25.1 | 10.1 | 4.93 | 11.4 | 0.491 | 0.409 | 0.437 | 0.943 | 0.807 | 0.607 | |||
| 114 | [-] | 30.1 | 30.3 | 25.1 | 10.1 | 4.96 | 11.4 | 0.497 | 0.409 | 0.438 | 0.943 | 0.810 | 0.607 |
Download Data |
Period Mean (original grids) [W m-2] |
Model Period Mean (intersection) [W m-2] |
Benchmark Period Mean (intersection) [W m-2] |
Model Period Mean (complement) [W m-2] |
Benchmark Period Mean (complement) [W m-2] |
Bias [W m-2] |
RMSE [W m-2] |
Phase Shift [months] |
Bias Score [1] |
RMSE Score [1] |
Seasonal Cycle Score [1] |
Spatial Distribution Score [1] |
Overall Score [1] |
|||
|---|---|---|---|---|---|---|---|---|---|---|---|---|---|---|---|---|
| Benchmark | [-] | 38.8 | ||||||||||||||
| 101 | [-] | 37.6 | 37.6 | 38.8 | 16.6 | -1.80 | 7.84 | 1.19 | 0.562 | 0.634 | 0.822 | 0.901 | 0.711 | |||
| 105 | [-] | 36.7 | 36.7 | 38.8 | 16.6 | -2.70 | 8.34 | 1.14 | 0.515 | 0.639 | 0.829 | 0.906 | 0.706 | |||
| 111 | [-] | 37.4 | 37.3 | 38.8 | 16.6 | -2.04 | 8.02 | 1.20 | 0.554 | 0.633 | 0.819 | 0.903 | 0.708 | |||
| 112 | [-] | 37.3 | 37.3 | 38.8 | 16.6 | -2.07 | 8.09 | 1.20 | 0.551 | 0.629 | 0.819 | 0.906 | 0.707 | |||
| 113 | [-] | 37.4 | 37.4 | 38.8 | 16.6 | -2.00 | 8.00 | 1.14 | 0.549 | 0.640 | 0.830 | 0.919 | 0.716 | |||
| 114 | [-] | 37.5 | 37.5 | 38.8 | 16.6 | -1.92 | 7.97 | 1.15 | 0.555 | 0.639 | 0.831 | 0.920 | 0.717 |
Download Data |
Period Mean (original grids) [W m-2] |
Model Period Mean (intersection) [W m-2] |
Benchmark Period Mean (intersection) [W m-2] |
Model Period Mean (complement) [W m-2] |
Benchmark Period Mean (complement) [W m-2] |
Bias [W m-2] |
RMSE [W m-2] |
Phase Shift [months] |
Bias Score [1] |
RMSE Score [1] |
Seasonal Cycle Score [1] |
Spatial Distribution Score [1] |
Overall Score [1] |
|||
|---|---|---|---|---|---|---|---|---|---|---|---|---|---|---|---|---|
| Benchmark | [-] | 26.2 | ||||||||||||||
| 101 | [-] | 34.7 | 34.7 | 26.4 | 11.6 | 8.39 | 9.47 | 1.56 | 0.261 | 0.732 | 0.781 | 0.935 | 0.688 | |||
| 105 | [-] | 33.9 | 34.0 | 26.4 | 11.6 | 7.64 | 8.85 | 1.56 | 0.296 | 0.739 | 0.781 | 0.923 | 0.695 | |||
| 111 | [-] | 35.5 | 35.5 | 26.4 | 11.6 | 9.19 | 10.2 | 1.55 | 0.227 | 0.724 | 0.783 | 0.950 | 0.682 | |||
| 112 | [-] | 35.5 | 35.5 | 26.4 | 11.6 | 9.17 | 10.1 | 1.54 | 0.227 | 0.723 | 0.783 | 0.947 | 0.681 | |||
| 113 | [-] | 33.8 | 33.8 | 26.4 | 11.6 | 7.51 | 8.65 | 1.56 | 0.307 | 0.738 | 0.780 | 0.887 | 0.690 | |||
| 114 | [-] | 35.3 | 35.3 | 26.4 | 11.6 | 8.98 | 9.99 | 1.54 | 0.238 | 0.725 | 0.784 | 0.954 | 0.685 |
Download Data |
Period Mean (original grids) [W m-2] |
Model Period Mean (intersection) [W m-2] |
Benchmark Period Mean (intersection) [W m-2] |
Model Period Mean (complement) [W m-2] |
Benchmark Period Mean (complement) [W m-2] |
Bias [W m-2] |
RMSE [W m-2] |
Phase Shift [months] |
Bias Score [1] |
RMSE Score [1] |
Seasonal Cycle Score [1] |
Spatial Distribution Score [1] |
Overall Score [1] |
|||
|---|---|---|---|---|---|---|---|---|---|---|---|---|---|---|---|---|
| Benchmark | [-] | 30.6 | ||||||||||||||
| 101 | [-] | 35.1 | 35.0 | 30.8 | 11.9 | 3.98 | 6.73 | 1.04 | 0.533 | 0.762 | 0.879 | 0.561 | 0.699 | |||
| 105 | [-] | 33.9 | 33.8 | 30.8 | 11.9 | 2.79 | 6.23 | 1.05 | 0.565 | 0.761 | 0.877 | 0.476 | 0.688 | |||
| 111 | [-] | 35.0 | 35.0 | 30.8 | 11.9 | 3.94 | 6.55 | 0.992 | 0.556 | 0.759 | 0.884 | 0.512 | 0.694 | |||
| 112 | [-] | 35.1 | 35.0 | 30.8 | 11.9 | 3.98 | 6.61 | 0.990 | 0.552 | 0.756 | 0.884 | 0.512 | 0.692 | |||
| 113 | [-] | 34.9 | 34.8 | 30.8 | 11.9 | 3.77 | 6.58 | 0.976 | 0.549 | 0.760 | 0.885 | 0.522 | 0.695 | |||
| 114 | [-] | 35.0 | 35.0 | 30.8 | 11.9 | 3.94 | 6.64 | 0.971 | 0.547 | 0.760 | 0.886 | 0.495 | 0.689 |
Download Data |
Period Mean (original grids) [W m-2] |
Model Period Mean (intersection) [W m-2] |
Benchmark Period Mean (intersection) [W m-2] |
Model Period Mean (complement) [W m-2] |
Benchmark Period Mean (complement) [W m-2] |
Bias [W m-2] |
RMSE [W m-2] |
Phase Shift [months] |
Bias Score [1] |
RMSE Score [1] |
Seasonal Cycle Score [1] |
Spatial Distribution Score [1] |
Overall Score [1] |
|||
|---|---|---|---|---|---|---|---|---|---|---|---|---|---|---|---|---|
| Benchmark | [-] | 29.5 | ||||||||||||||
| 101 | [-] | 37.5 | 37.6 | 30.3 | 12.4 | 6.67 | 12.3 | 0.900 | 0.351 | 0.639 | 0.889 | 0.809 | 0.665 | |||
| 105 | [-] | 36.1 | 36.2 | 30.3 | 12.4 | 5.33 | 11.7 | 0.944 | 0.403 | 0.645 | 0.886 | 0.839 | 0.684 | |||
| 111 | [-] | 36.6 | 36.7 | 30.3 | 12.4 | 5.82 | 11.8 | 0.916 | 0.389 | 0.647 | 0.890 | 0.837 | 0.682 | |||
| 112 | [-] | 36.5 | 36.6 | 30.3 | 12.4 | 5.71 | 11.7 | 0.934 | 0.389 | 0.651 | 0.887 | 0.840 | 0.684 | |||
| 113 | [-] | 36.8 | 36.8 | 30.3 | 12.4 | 5.96 | 11.9 | 0.888 | 0.376 | 0.647 | 0.891 | 0.831 | 0.679 | |||
| 114 | [-] | 36.9 | 37.0 | 30.3 | 12.4 | 6.12 | 12.0 | 0.874 | 0.372 | 0.648 | 0.893 | 0.835 | 0.679 |
Temporally integrated period mean