Mean State
Download Data |
Period Mean (original grids) [Pg] |
Model Period Mean (intersection) [Pg] |
Model Period Mean (complement) [Pg] |
Benchmark Period Mean (intersection) [Pg] |
Benchmark Period Mean (complement) [Pg] |
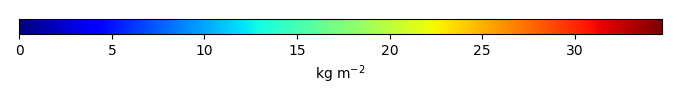
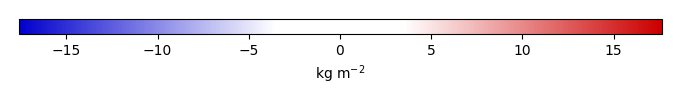
Bias [kg m-2] |
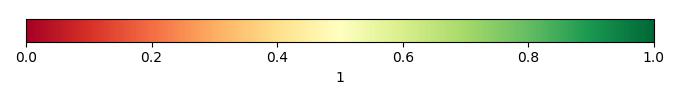
Bias Score [1] |
Spatial Distribution Score [1] |
Overall Score [1] |
|||
|---|---|---|---|---|---|---|---|---|---|---|---|---|
| Benchmark | [-] | 64.0 | ||||||||||
| CESM2_1 | [-] | 47.9 | 48.3 | 0.447 | 63.9 | 0.0663 | -4.19 | 0.709 | 0.728 | 0.718 | ||
| CRUJRA | [-] | 48.9 | 49.4 | 0.490 | 63.9 | 0.0663 | -3.86 | 0.712 | 0.717 | 0.714 | ||
| GSWP3 | [-] | 38.5 | 38.5 | 0.424 | 63.9 | 0.0663 | -7.12 | 0.635 | 0.580 | 0.608 | ||
| PRINCETON | [-] | 52.3 | 53.0 | 0.492 | 63.9 | 0.0663 | -2.78 | 0.734 | 0.747 | 0.740 |
Download Data |
Period Mean (original grids) [Pg] |
Model Period Mean (intersection) [Pg] |
Model Period Mean (complement) [Pg] |
Benchmark Period Mean (intersection) [Pg] |
Benchmark Period Mean (complement) [Pg] |
Bias [kg m-2] |
Bias Score [1] |
Spatial Distribution Score [1] |
Overall Score [1] |
|||
|---|---|---|---|---|---|---|---|---|---|---|---|---|
| Benchmark | [-] | 3.34 | ||||||||||
| CESM2_1 | [-] | 4.48 | 3.29 | 0.639 | 3.34 | 0.00700 | 0.0360 | 0.530 | 0.792 | 0.661 | ||
| CRUJRA | [-] | 6.33 | 4.79 | 0.888 | 3.34 | 0.00700 | 0.531 | 0.491 | 0.789 | 0.640 | ||
| GSWP3 | [-] | 3.28 | 2.19 | 0.742 | 3.34 | 0.00700 | -0.339 | 0.497 | 0.571 | 0.534 | ||
| PRINCETON | [-] | 6.98 | 5.16 | 0.879 | 3.34 | 0.00700 | 0.662 | 0.515 | 0.804 | 0.659 |
Download Data |
Period Mean (original grids) [Pg] |
Model Period Mean (intersection) [Pg] |
Model Period Mean (complement) [Pg] |
Benchmark Period Mean (intersection) [Pg] |
Benchmark Period Mean (complement) [Pg] |
Bias [kg m-2] |
Bias Score [1] |
Spatial Distribution Score [1] |
Overall Score [1] |
|||
|---|---|---|---|---|---|---|---|---|---|---|---|---|
| Benchmark | [-] | 14.1 | ||||||||||
| CESM2_1 | [-] | 21.0 | 18.9 | 1.73 | 14.1 | 0.0194 | 0.851 | 0.519 | 0.818 | 0.669 | ||
| CRUJRA | [-] | 25.6 | 23.7 | 1.41 | 14.1 | 0.0194 | 1.59 | 0.516 | 0.807 | 0.662 | ||
| GSWP3 | [-] | 12.1 | 10.9 | 1.00 | 14.1 | 0.0194 | -0.249 | 0.545 | 0.789 | 0.667 | ||
| PRINCETON | [-] | 22.0 | 20.4 | 1.18 | 14.1 | 0.0194 | 1.12 | 0.529 | 0.818 | 0.674 |
Download Data |
Period Mean (original grids) [Pg] |
Model Period Mean (intersection) [Pg] |
Model Period Mean (complement) [Pg] |
Benchmark Period Mean (intersection) [Pg] |
Benchmark Period Mean (complement) [Pg] |
Bias [kg m-2] |
Bias Score [1] |
Spatial Distribution Score [1] |
Overall Score [1] |
|||
|---|---|---|---|---|---|---|---|---|---|---|---|---|
| Benchmark | [-] | 1.22 | ||||||||||
| CESM2_1 | [-] | 4.04 | 3.65 | 0.442 | 1.22 | 0.00453 | 1.05 | 0.391 | 0.555 | 0.473 | ||
| CRUJRA | [-] | 5.32 | 4.61 | 0.735 | 1.22 | 0.00453 | 1.50 | 0.357 | 0.528 | 0.443 | ||
| GSWP3 | [-] | 4.17 | 3.39 | 0.799 | 1.22 | 0.00453 | 0.989 | 0.466 | 0.516 | 0.491 | ||
| PRINCETON | [-] | 10.4 | 9.12 | 1.40 | 1.22 | 0.00453 | 3.38 | 0.107 | 0.475 | 0.291 |
Download Data |
Period Mean (original grids) [Pg] |
Model Period Mean (intersection) [Pg] |
Model Period Mean (complement) [Pg] |
Benchmark Period Mean (intersection) [Pg] |
Benchmark Period Mean (complement) [Pg] |
Bias [kg m-2] |
Bias Score [1] |
Spatial Distribution Score [1] |
Overall Score [1] |
|||
|---|---|---|---|---|---|---|---|---|---|---|---|---|
| Benchmark | [-] | 47.3 | ||||||||||
| CESM2_1 | [-] | 46.0 | 43.8 | 2.00 | 45.9 | 1.37 | 4.39 | 0.707 | 0.639 | 0.673 | ||
| CRUJRA | [-] | 45.8 | 43.4 | 2.11 | 45.9 | 1.37 | 4.47 | 0.696 | 0.539 | 0.618 | ||
| GSWP3 | [-] | 40.1 | 38.0 | 1.80 | 45.9 | 1.37 | 2.31 | 0.683 | 0.514 | 0.599 | ||
| PRINCETON | [-] | 50.5 | 48.1 | 2.17 | 45.9 | 1.37 | 6.08 | 0.703 | 0.684 | 0.693 |
Download Data |
Period Mean (original grids) [Pg] |
Model Period Mean (intersection) [Pg] |
Model Period Mean (complement) [Pg] |
Benchmark Period Mean (intersection) [Pg] |
Benchmark Period Mean (complement) [Pg] |
Bias [kg m-2] |
Bias Score [1] |
Spatial Distribution Score [1] |
Overall Score [1] |
|||
|---|---|---|---|---|---|---|---|---|---|---|---|---|
| Benchmark | [-] | 41.6 | ||||||||||
| CESM2_1 | [-] | 55.3 | 54.0 | 0.385 | 41.6 | 0.0303 | 1.55 | 0.684 | 0.941 | 0.812 | ||
| CRUJRA | [-] | 75.8 | 74.1 | 0.502 | 41.6 | 0.0303 | 3.84 | 0.537 | 0.836 | 0.686 | ||
| GSWP3 | [-] | 53.2 | 51.9 | 0.448 | 41.6 | 0.0303 | 1.32 | 0.548 | 0.741 | 0.645 | ||
| PRINCETON | [-] | 99.0 | 96.8 | 0.609 | 41.6 | 0.0303 | 6.43 | 0.381 | 0.812 | 0.597 |
Download Data |
Period Mean (original grids) [Pg] |
Model Period Mean (intersection) [Pg] |
Model Period Mean (complement) [Pg] |
Benchmark Period Mean (intersection) [Pg] |
Benchmark Period Mean (complement) [Pg] |
Bias [kg m-2] |
Bias Score [1] |
Spatial Distribution Score [1] |
Overall Score [1] |
|||
|---|---|---|---|---|---|---|---|---|---|---|---|---|
| Benchmark | [-] | 15.6 | ||||||||||
| CESM2_1 | [-] | 34.5 | 30.7 | 4.60 | 15.6 | 0.0330 | 2.06 | 0.504 | 0.707 | 0.606 | ||
| CRUJRA | [-] | 37.4 | 35.0 | 3.31 | 15.6 | 0.0330 | 2.59 | 0.458 | 0.602 | 0.530 | ||
| GSWP3 | [-] | 32.5 | 30.3 | 2.99 | 15.6 | 0.0330 | 2.01 | 0.501 | 0.667 | 0.584 | ||
| PRINCETON | [-] | 48.9 | 45.9 | 4.42 | 15.6 | 0.0330 | 3.85 | 0.383 | 0.526 | 0.454 |
Download Data |
Period Mean (original grids) [Pg] |
Model Period Mean (intersection) [Pg] |
Model Period Mean (complement) [Pg] |
Benchmark Period Mean (intersection) [Pg] |
Benchmark Period Mean (complement) [Pg] |
Bias [kg m-2] |
Bias Score [1] |
Spatial Distribution Score [1] |
Overall Score [1] |
|||
|---|---|---|---|---|---|---|---|---|---|---|---|---|
| Benchmark | [-] | 14.8 | ||||||||||
| CESM2_1 | [-] | 24.9 | 22.8 | 1.30 | 14.6 | 0.136 | 2.44 | 0.526 | 0.727 | 0.627 | ||
| CRUJRA | [-] | 30.8 | 28.4 | 1.77 | 14.6 | 0.136 | 3.47 | 0.514 | 0.680 | 0.597 | ||
| GSWP3 | [-] | 25.1 | 22.8 | 1.45 | 14.6 | 0.136 | 2.41 | 0.529 | 0.732 | 0.630 | ||
| PRINCETON | [-] | 32.8 | 30.1 | 1.78 | 14.6 | 0.136 | 3.82 | 0.494 | 0.646 | 0.570 |
Download Data |
Period Mean (original grids) [Pg] |
Model Period Mean (intersection) [Pg] |
Model Period Mean (complement) [Pg] |
Benchmark Period Mean (intersection) [Pg] |
Benchmark Period Mean (complement) [Pg] |
Bias [kg m-2] |
Bias Score [1] |
Spatial Distribution Score [1] |
Overall Score [1] |
|||
|---|---|---|---|---|---|---|---|---|---|---|---|---|
| Benchmark | [-] | 1.78 | ||||||||||
| CESM2_1 | [-] | 2.56 | 2.53 | 0.198 | 1.78 | 0.376 | 0.449 | 0.748 | 0.598 | |||
| CRUJRA | [-] | 8.69 | 6.59 | 2.56 | 1.78 | 2.45 | 0.335 | 0.625 | 0.480 | |||
| GSWP3 | [-] | 7.14 | 5.40 | 2.13 | 1.78 | 1.83 | 0.393 | 0.566 | 0.479 | |||
| PRINCETON | [-] | 11.8 | 9.40 | 2.95 | 1.78 | 3.84 | 0.160 | 0.614 | 0.387 |
Download Data |
Period Mean (original grids) [Pg] |
Model Period Mean (intersection) [Pg] |
Model Period Mean (complement) [Pg] |
Benchmark Period Mean (intersection) [Pg] |
Benchmark Period Mean (complement) [Pg] |
Bias [kg m-2] |
Bias Score [1] |
Spatial Distribution Score [1] |
Overall Score [1] |
|||
|---|---|---|---|---|---|---|---|---|---|---|---|---|
| Benchmark | [-] | 15.3 | ||||||||||
| CESM2_1 | [-] | 12.0 | 9.98 | 1.89 | 14.8 | 0.505 | -0.125 | 0.561 | 0.807 | 0.684 | ||
| CRUJRA | [-] | 13.1 | 10.8 | 2.06 | 14.8 | 0.505 | 0.153 | 0.567 | 0.806 | 0.687 | ||
| GSWP3 | [-] | 11.3 | 9.26 | 1.85 | 14.8 | 0.505 | -0.172 | 0.552 | 0.810 | 0.681 | ||
| PRINCETON | [-] | 14.6 | 12.5 | 1.90 | 14.8 | 0.505 | 0.587 | 0.579 | 0.828 | 0.704 |
Download Data |
Period Mean (original grids) [Pg] |
Model Period Mean (intersection) [Pg] |
Model Period Mean (complement) [Pg] |
Benchmark Period Mean (intersection) [Pg] |
Benchmark Period Mean (complement) [Pg] |
Bias [kg m-2] |
Bias Score [1] |
Spatial Distribution Score [1] |
Overall Score [1] |
|||
|---|---|---|---|---|---|---|---|---|---|---|---|---|
| Benchmark | [-] | 13.1 | ||||||||||
| CESM2_1 | [-] | 14.7 | 13.7 | 0.700 | 13.1 | 0.0236 | 0.695 | 0.525 | 0.782 | 0.653 | ||
| CRUJRA | [-] | 24.8 | 23.2 | 1.16 | 13.1 | 0.0236 | 2.82 | 0.514 | 0.670 | 0.592 | ||
| GSWP3 | [-] | 18.5 | 17.2 | 0.914 | 13.1 | 0.0236 | 1.55 | 0.504 | 0.700 | 0.602 | ||
| PRINCETON | [-] | 26.2 | 24.5 | 1.17 | 13.1 | 0.0236 | 3.08 | 0.509 | 0.672 | 0.590 |
Download Data |
Period Mean (original grids) [Pg] |
Model Period Mean (intersection) [Pg] |
Model Period Mean (complement) [Pg] |
Benchmark Period Mean (intersection) [Pg] |
Benchmark Period Mean (complement) [Pg] |
Bias [kg m-2] |
Bias Score [1] |
Spatial Distribution Score [1] |
Overall Score [1] |
|||
|---|---|---|---|---|---|---|---|---|---|---|---|---|
| Benchmark | [-] | 455. | ||||||||||
| CESM2_1 | [-] | 487. | 465. | 21.7 | 449. | 5.37 | 0.754 | 0.666 | 0.884 | 0.775 | ||
| CRUJRA | [-] | 627. | 599. | 27.4 | 449. | 5.37 | 2.30 | 0.652 | 0.900 | 0.776 | ||
| GSWP3 | [-] | 491. | 467. | 23.5 | 449. | 5.37 | 0.815 | 0.636 | 0.859 | 0.748 | ||
| PRINCETON | [-] | 715. | 684. | 30.6 | 449. | 5.37 | 3.26 | 0.635 | 0.895 | 0.765 |
Download Data |
Period Mean (original grids) [Pg] |
Model Period Mean (intersection) [Pg] |
Model Period Mean (complement) [Pg] |
Benchmark Period Mean (intersection) [Pg] |
Benchmark Period Mean (complement) [Pg] |
Bias [kg m-2] |
Bias Score [1] |
Spatial Distribution Score [1] |
Overall Score [1] |
|||
|---|---|---|---|---|---|---|---|---|---|---|---|---|
| Benchmark | [-] | 0.854 | ||||||||||
| CESM2_1 | [-] | 1.07 | 0.364 | 0.726 | 0.850 | 0.00365 | -0.258 | 0.465 | 0.284 | 0.375 | ||
| CRUJRA | [-] | 1.85 | 0.709 | 1.14 | 0.850 | 0.00365 | 0.0177 | 0.478 | 0.668 | 0.573 | ||
| GSWP3 | [-] | 1.55 | 0.697 | 0.864 | 0.850 | 0.00365 | 0.0700 | 0.490 | 0.736 | 0.613 | ||
| PRINCETON | [-] | 2.23 | 1.10 | 1.12 | 0.850 | 0.00365 | 0.367 | 0.504 | 0.721 | 0.613 |
Download Data |
Period Mean (original grids) [Pg] |
Model Period Mean (intersection) [Pg] |
Model Period Mean (complement) [Pg] |
Benchmark Period Mean (intersection) [Pg] |
Benchmark Period Mean (complement) [Pg] |
Bias [kg m-2] |
Bias Score [1] |
Spatial Distribution Score [1] |
Overall Score [1] |
|||
|---|---|---|---|---|---|---|---|---|---|---|---|---|
| Benchmark | [-] | 2.82 | ||||||||||
| CESM2_1 | [-] | 9.90 | 8.98 | 1.17 | 2.82 | 0.00299 | 1.96 | 0.300 | 0.366 | 0.333 | ||
| CRUJRA | [-] | 16.3 | 13.7 | 2.51 | 2.82 | 0.00299 | 3.47 | 0.259 | 0.364 | 0.311 | ||
| GSWP3 | [-] | 14.9 | 12.6 | 2.12 | 2.82 | 0.00299 | 3.12 | 0.263 | 0.339 | 0.301 | ||
| PRINCETON | [-] | 22.2 | 18.8 | 3.38 | 2.82 | 0.00299 | 5.07 | 0.136 | 0.245 | 0.190 |
Download Data |
Period Mean (original grids) [Pg] |
Model Period Mean (intersection) [Pg] |
Model Period Mean (complement) [Pg] |
Benchmark Period Mean (intersection) [Pg] |
Benchmark Period Mean (complement) [Pg] |
Bias [kg m-2] |
Bias Score [1] |
Spatial Distribution Score [1] |
Overall Score [1] |
|||
|---|---|---|---|---|---|---|---|---|---|---|---|---|
| Benchmark | [-] | 4.95 | ||||||||||
| CESM2_1 | [-] | 9.86 | 8.91 | 0.716 | 4.88 | 0.0615 | 2.75 | 0.462 | 0.607 | 0.534 | ||
| CRUJRA | [-] | 12.4 | 11.2 | 0.911 | 4.88 | 0.0615 | 4.15 | 0.365 | 0.439 | 0.402 | ||
| GSWP3 | [-] | 10.3 | 9.21 | 0.788 | 4.88 | 0.0615 | 3.13 | 0.448 | 0.514 | 0.481 | ||
| PRINCETON | [-] | 13.8 | 12.6 | 0.919 | 4.88 | 0.0615 | 4.67 | 0.332 | 0.430 | 0.381 |
Download Data |
Period Mean (original grids) [Pg] |
Model Period Mean (intersection) [Pg] |
Model Period Mean (complement) [Pg] |
Benchmark Period Mean (intersection) [Pg] |
Benchmark Period Mean (complement) [Pg] |
Bias [kg m-2] |
Bias Score [1] |
Spatial Distribution Score [1] |
Overall Score [1] |
|||
|---|---|---|---|---|---|---|---|---|---|---|---|---|
| Benchmark | [-] | 13.0 | ||||||||||
| CESM2_1 | [-] | 9.56 | 9.21 | 0.269 | 13.0 | 0.00854 | -0.674 | 0.614 | 0.859 | 0.737 | ||
| CRUJRA | [-] | 17.9 | 17.4 | 0.399 | 13.0 | 0.00854 | 1.47 | 0.661 | 0.908 | 0.784 | ||
| GSWP3 | [-] | 11.8 | 11.4 | 0.332 | 13.0 | 0.00854 | -0.108 | 0.650 | 0.873 | 0.761 | ||
| PRINCETON | [-] | 19.0 | 18.5 | 0.416 | 13.0 | 0.00854 | 1.75 | 0.647 | 0.892 | 0.770 |
Download Data |
Period Mean (original grids) [Pg] |
Model Period Mean (intersection) [Pg] |
Model Period Mean (complement) [Pg] |
Benchmark Period Mean (intersection) [Pg] |
Benchmark Period Mean (complement) [Pg] |
Bias [kg m-2] |
Bias Score [1] |
Spatial Distribution Score [1] |
Overall Score [1] |
|||
|---|---|---|---|---|---|---|---|---|---|---|---|---|
| Benchmark | [-] | 21.4 | ||||||||||
| CESM2_1 | [-] | 35.1 | 34.5 | 0.388 | 21.3 | 0.128 | 2.91 | 0.553 | 0.814 | 0.683 | ||
| CRUJRA | [-] | 53.5 | 53.1 | 0.549 | 21.3 | 0.128 | 6.62 | 0.372 | 0.762 | 0.567 | ||
| GSWP3 | [-] | 44.7 | 44.4 | 0.471 | 21.3 | 0.128 | 4.88 | 0.462 | 0.782 | 0.622 | ||
| PRINCETON | [-] | 67.2 | 66.6 | 0.624 | 21.3 | 0.128 | 9.25 | 0.247 | 0.608 | 0.428 |
Download Data |
Period Mean (original grids) [Pg] |
Model Period Mean (intersection) [Pg] |
Model Period Mean (complement) [Pg] |
Benchmark Period Mean (intersection) [Pg] |
Benchmark Period Mean (complement) [Pg] |
Bias [kg m-2] |
Bias Score [1] |
Spatial Distribution Score [1] |
Overall Score [1] |
|||
|---|---|---|---|---|---|---|---|---|---|---|---|---|
| Benchmark | [-] | 9.57 | ||||||||||
| CESM2_1 | [-] | 1.61 | 1.45 | 0.178 | 9.53 | 0.0397 | -2.38 | 0.430 | 0.255 | 0.343 | ||
| CRUJRA | [-] | 3.47 | 3.23 | 0.283 | 9.53 | 0.0397 | -1.80 | 0.495 | 0.616 | 0.555 | ||
| GSWP3 | [-] | 3.18 | 2.98 | 0.235 | 9.53 | 0.0397 | -1.89 | 0.489 | 0.495 | 0.492 | ||
| PRINCETON | [-] | 6.97 | 6.66 | 0.334 | 9.53 | 0.0397 | -0.744 | 0.576 | 0.839 | 0.708 |
Download Data |
Period Mean (original grids) [Pg] |
Model Period Mean (intersection) [Pg] |
Model Period Mean (complement) [Pg] |
Benchmark Period Mean (intersection) [Pg] |
Benchmark Period Mean (complement) [Pg] |
Bias [kg m-2] |
Bias Score [1] |
Spatial Distribution Score [1] |
Overall Score [1] |
|||
|---|---|---|---|---|---|---|---|---|---|---|---|---|
| Benchmark | [-] | 151. | ||||||||||
| CESM2_1 | [-] | 130. | 129. | 0.481 | 151. | 0.0403 | -2.27 | 0.768 | 0.853 | 0.810 | ||
| CRUJRA | [-] | 163. | 162. | 0.631 | 151. | 0.0403 | 1.66 | 0.802 | 0.888 | 0.845 | ||
| GSWP3 | [-] | 129. | 128. | 0.571 | 151. | 0.0403 | -2.40 | 0.765 | 0.777 | 0.771 | ||
| PRINCETON | [-] | 168. | 167. | 0.673 | 151. | 0.0403 | 2.25 | 0.812 | 0.891 | 0.851 |
Download Data |
Period Mean (original grids) [Pg] |
Model Period Mean (intersection) [Pg] |
Model Period Mean (complement) [Pg] |
Benchmark Period Mean (intersection) [Pg] |
Benchmark Period Mean (complement) [Pg] |
Bias [kg m-2] |
Bias Score [1] |
Spatial Distribution Score [1] |
Overall Score [1] |
|||
|---|---|---|---|---|---|---|---|---|---|---|---|---|
| Benchmark | [-] | 10.7 | ||||||||||
| CESM2_1 | [-] | 13.4 | 13.3 | 0.410 | 10.7 | 0.0170 | 0.576 | 0.523 | 0.791 | 0.657 | ||
| CRUJRA | [-] | 28.1 | 28.0 | 0.582 | 10.7 | 0.0170 | 2.87 | 0.486 | 0.810 | 0.648 | ||
| GSWP3 | [-] | 21.6 | 21.4 | 0.513 | 10.7 | 0.0170 | 1.83 | 0.516 | 0.807 | 0.662 | ||
| PRINCETON | [-] | 29.7 | 29.7 | 0.620 | 10.7 | 0.0170 | 3.14 | 0.479 | 0.796 | 0.638 |
Download Data |
Period Mean (original grids) [Pg] |
Model Period Mean (intersection) [Pg] |
Model Period Mean (complement) [Pg] |
Benchmark Period Mean (intersection) [Pg] |
Benchmark Period Mean (complement) [Pg] |
Bias [kg m-2] |
Bias Score [1] |
Spatial Distribution Score [1] |
Overall Score [1] |
|||
|---|---|---|---|---|---|---|---|---|---|---|---|---|
| Benchmark | [-] | 4.41 | ||||||||||
| CESM2_1 | [-] | 7.20 | 6.45 | 0.771 | 4.31 | 0.102 | 1.40 | 0.612 | 0.844 | 0.728 | ||
| CRUJRA | [-] | 5.21 | 4.76 | 0.471 | 4.31 | 0.102 | 1.11 | 0.590 | 0.768 | 0.679 | ||
| GSWP3 | [-] | 6.26 | 5.79 | 0.495 | 4.31 | 0.102 | 1.41 | 0.591 | 0.801 | 0.696 | ||
| PRINCETON | [-] | 7.52 | 7.06 | 0.505 | 4.31 | 0.102 | 2.00 | 0.583 | 0.778 | 0.681 |
Temporally integrated period mean