Mean State
Download Data |
Period Mean (original grids) [Pg] |
Model Period Mean (intersection) [Pg] |
Model Period Mean (complement) [Pg] |
Benchmark Period Mean (intersection) [Pg] |
Benchmark Period Mean (complement) [Pg] |
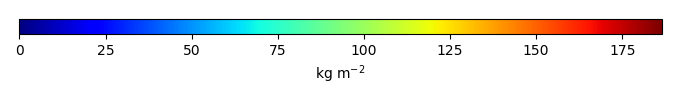
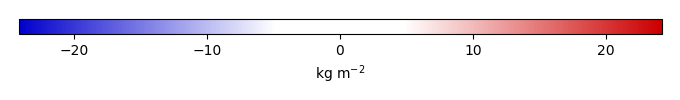
Bias [kg m-2] |
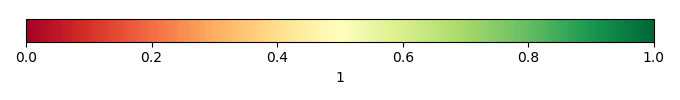
Bias Score [1] |
Spatial Distribution Score [1] |
Overall Score [1] |
|||
|---|---|---|---|---|---|---|---|---|---|---|---|---|
| Benchmark | [-] | 34.1 | ||||||||||
| CESM2_1 | [-] | 34.5 | 35.0 | 0.267 | 33.8 | 0.315 | 0.733 | 0.679 | 0.916 | 0.797 | ||
| CRUJRA | [-] | 38.7 | 39.6 | 0.271 | 33.8 | 0.315 | 1.73 | 0.664 | 0.881 | 0.773 | ||
| GSWP3 | [-] | 30.8 | 31.2 | 0.272 | 33.8 | 0.315 | -0.162 | 0.725 | 0.945 | 0.835 | ||
| PRINCETON | [-] | 38.0 | 39.2 | 0.265 | 33.8 | 0.315 | 1.63 | 0.683 | 0.913 | 0.798 |
Download Data |
Period Mean (original grids) [Pg] |
Model Period Mean (intersection) [Pg] |
Model Period Mean (complement) [Pg] |
Benchmark Period Mean (intersection) [Pg] |
Benchmark Period Mean (complement) [Pg] |
Bias [kg m-2] |
Bias Score [1] |
Spatial Distribution Score [1] |
Overall Score [1] |
|||
|---|---|---|---|---|---|---|---|---|---|---|---|---|
| Benchmark | [-] | 44.8 | ||||||||||
| CESM2_1 | [-] | 16.3 | 15.4 | 0.0240 | 44.4 | 0.478 | -4.21 | 0.495 | 0.840 | 0.668 | ||
| CRUJRA | [-] | 18.6 | 17.4 | 0.0244 | 44.4 | 0.478 | -3.95 | 0.505 | 0.842 | 0.673 | ||
| GSWP3 | [-] | 15.3 | 14.4 | 0.0244 | 44.4 | 0.478 | -4.37 | 0.501 | 0.779 | 0.640 | ||
| PRINCETON | [-] | 23.5 | 21.7 | 0.0211 | 44.4 | 0.478 | -3.34 | 0.522 | 0.787 | 0.655 |
Download Data |
Period Mean (original grids) [Pg] |
Model Period Mean (intersection) [Pg] |
Model Period Mean (complement) [Pg] |
Benchmark Period Mean (intersection) [Pg] |
Benchmark Period Mean (complement) [Pg] |
Bias [kg m-2] |
Bias Score [1] |
Spatial Distribution Score [1] |
Overall Score [1] |
|||
|---|---|---|---|---|---|---|---|---|---|---|---|---|
| Benchmark | [-] | 60.1 | ||||||||||
| CESM2_1 | [-] | 39.1 | 38.2 | 0.682 | 59.3 | 0.762 | -1.87 | 0.558 | 0.786 | 0.672 | ||
| CRUJRA | [-] | 47.4 | 46.3 | 0.840 | 59.3 | 0.762 | -0.935 | 0.587 | 0.754 | 0.670 | ||
| GSWP3 | [-] | 29.3 | 28.4 | 0.751 | 59.3 | 0.762 | -2.87 | 0.546 | 0.831 | 0.689 | ||
| PRINCETON | [-] | 43.1 | 42.3 | 0.865 | 59.3 | 0.762 | -1.34 | 0.582 | 0.773 | 0.677 |
Download Data |
Period Mean (original grids) [Pg] |
Model Period Mean (intersection) [Pg] |
Model Period Mean (complement) [Pg] |
Benchmark Period Mean (intersection) [Pg] |
Benchmark Period Mean (complement) [Pg] |
Bias [kg m-2] |
Bias Score [1] |
Spatial Distribution Score [1] |
Overall Score [1] |
|||
|---|---|---|---|---|---|---|---|---|---|---|---|---|
| Benchmark | [-] | 11.1 | ||||||||||
| CESM2_1 | [-] | 62.8 | 3.43 | 59.5 | 10.3 | 0.803 | -8.34 | 0.413 | 0.410 | 0.412 | ||
| CRUJRA | [-] | 196. | 13.0 | 183. | 10.3 | 0.803 | 19.9 | 0.414 | 0.103 | 0.258 | ||
| GSWP3 | [-] | 99.3 | 8.93 | 90.2 | 10.3 | 0.803 | 6.66 | 0.417 | 0.182 | 0.300 | ||
| PRINCETON | [-] | 297. | 13.4 | 285. | 10.3 | 0.803 | 22.4 | 0.472 | 0.113 | 0.293 |
Download Data |
Period Mean (original grids) [Pg] |
Model Period Mean (intersection) [Pg] |
Model Period Mean (complement) [Pg] |
Benchmark Period Mean (intersection) [Pg] |
Benchmark Period Mean (complement) [Pg] |
Bias [kg m-2] |
Bias Score [1] |
Spatial Distribution Score [1] |
Overall Score [1] |
|||
|---|---|---|---|---|---|---|---|---|---|---|---|---|
| Benchmark | [-] | 55.7 | ||||||||||
| CESM2_1 | [-] | 23.8 | 22.3 | 1.35 | 50.7 | 4.99 | -5.20 | 0.687 | 0.311 | 0.499 | ||
| CRUJRA | [-] | 23.2 | 21.7 | 1.34 | 50.7 | 4.99 | -5.32 | 0.679 | 0.248 | 0.464 | ||
| GSWP3 | [-] | 20.6 | 19.1 | 1.30 | 50.7 | 4.99 | -6.14 | 0.647 | 0.274 | 0.461 | ||
| PRINCETON | [-] | 23.8 | 22.3 | 1.35 | 50.7 | 4.99 | -5.07 | 0.683 | 0.318 | 0.501 |
Download Data |
Period Mean (original grids) [Pg] |
Model Period Mean (intersection) [Pg] |
Model Period Mean (complement) [Pg] |
Benchmark Period Mean (intersection) [Pg] |
Benchmark Period Mean (complement) [Pg] |
Bias [kg m-2] |
Bias Score [1] |
Spatial Distribution Score [1] |
Overall Score [1] |
|||
|---|---|---|---|---|---|---|---|---|---|---|---|---|
| Benchmark | [-] | 65.6 | ||||||||||
| CESM2_1 | [-] | 149. | 54.3 | 91.1 | 65.2 | 0.461 | -2.28 | 0.683 | 0.728 | 0.705 | ||
| CRUJRA | [-] | 244. | 81.5 | 157. | 65.2 | 0.461 | 4.31 | 0.665 | 0.884 | 0.774 | ||
| GSWP3 | [-] | 134. | 59.5 | 71.3 | 65.2 | 0.461 | -0.967 | 0.712 | 0.842 | 0.777 | ||
| PRINCETON | [-] | 297. | 82.9 | 208. | 65.2 | 0.461 | 4.72 | 0.657 | 0.916 | 0.787 |
Download Data |
Period Mean (original grids) [Pg] |
Model Period Mean (intersection) [Pg] |
Model Period Mean (complement) [Pg] |
Benchmark Period Mean (intersection) [Pg] |
Benchmark Period Mean (complement) [Pg] |
Bias [kg m-2] |
Bias Score [1] |
Spatial Distribution Score [1] |
Overall Score [1] |
|||
|---|---|---|---|---|---|---|---|---|---|---|---|---|
| Benchmark | [-] | 143. | ||||||||||
| CESM2_1 | [-] | 117. | 107. | 12.8 | 142. | 0.973 | -1.71 | 0.583 | 0.768 | 0.676 | ||
| CRUJRA | [-] | 114. | 104. | 13.4 | 142. | 0.973 | -1.81 | 0.644 | 0.774 | 0.709 | ||
| GSWP3 | [-] | 92.5 | 89.0 | 5.84 | 142. | 0.973 | -2.72 | 0.623 | 0.910 | 0.767 | ||
| PRINCETON | [-] | 189. | 159. | 34.6 | 142. | 0.973 | 1.30 | 0.609 | 0.419 | 0.514 |
Download Data |
Period Mean (original grids) [Pg] |
Model Period Mean (intersection) [Pg] |
Model Period Mean (complement) [Pg] |
Benchmark Period Mean (intersection) [Pg] |
Benchmark Period Mean (complement) [Pg] |
Bias [kg m-2] |
Bias Score [1] |
Spatial Distribution Score [1] |
Overall Score [1] |
|||
|---|---|---|---|---|---|---|---|---|---|---|---|---|
| Benchmark | [-] | 58.4 | ||||||||||
| CESM2_1 | [-] | 33.0 | 31.4 | 0.830 | 56.8 | 1.57 | -2.58 | 0.631 | 0.795 | 0.713 | ||
| CRUJRA | [-] | 38.3 | 36.8 | 0.884 | 56.8 | 1.57 | -1.83 | 0.653 | 0.787 | 0.720 | ||
| GSWP3 | [-] | 32.9 | 31.0 | 0.852 | 56.8 | 1.57 | -2.68 | 0.652 | 0.854 | 0.753 | ||
| PRINCETON | [-] | 39.8 | 37.8 | 0.867 | 56.8 | 1.57 | -1.69 | 0.640 | 0.725 | 0.683 |
Download Data |
Period Mean (original grids) [Pg] |
Model Period Mean (intersection) [Pg] |
Model Period Mean (complement) [Pg] |
Benchmark Period Mean (intersection) [Pg] |
Benchmark Period Mean (complement) [Pg] |
Bias [kg m-2] |
Bias Score [1] |
Spatial Distribution Score [1] |
Overall Score [1] |
|||
|---|---|---|---|---|---|---|---|---|---|---|---|---|
| Benchmark | [-] | 7.78 | ||||||||||
| CESM2_1 | [-] | 44.4 | 0.982 | 44.0 | 7.36 | 0.414 | -12.4 | 0.389 | 0.514 | 0.452 | ||
| CRUJRA | [-] | 200. | 14.0 | 189. | 7.36 | 0.414 | 28.4 | 0.445 | 0.142 | 0.294 | ||
| GSWP3 | [-] | 119. | 9.48 | 111. | 7.36 | 0.414 | 11.2 | 0.455 | 0.207 | 0.331 | ||
| PRINCETON | [-] | 209. | 15.9 | 195. | 7.36 | 0.414 | 32.8 | 0.369 | 0.187 | 0.278 |
Download Data |
Period Mean (original grids) [Pg] |
Model Period Mean (intersection) [Pg] |
Model Period Mean (complement) [Pg] |
Benchmark Period Mean (intersection) [Pg] |
Benchmark Period Mean (complement) [Pg] |
Bias [kg m-2] |
Bias Score [1] |
Spatial Distribution Score [1] |
Overall Score [1] |
|||
|---|---|---|---|---|---|---|---|---|---|---|---|---|
| Benchmark | [-] | 58.9 | ||||||||||
| CESM2_1 | [-] | 25.6 | 24.4 | 1.08 | 57.4 | 1.53 | -3.09 | 0.553 | 0.597 | 0.575 | ||
| CRUJRA | [-] | 29.1 | 27.5 | 1.41 | 57.4 | 1.53 | -2.59 | 0.542 | 0.437 | 0.489 | ||
| GSWP3 | [-] | 27.4 | 25.6 | 1.60 | 57.4 | 1.53 | -2.79 | 0.539 | 0.471 | 0.505 | ||
| PRINCETON | [-] | 34.1 | 32.2 | 1.64 | 57.4 | 1.53 | -1.93 | 0.521 | 0.307 | 0.414 |
Download Data |
Period Mean (original grids) [Pg] |
Model Period Mean (intersection) [Pg] |
Model Period Mean (complement) [Pg] |
Benchmark Period Mean (intersection) [Pg] |
Benchmark Period Mean (complement) [Pg] |
Bias [kg m-2] |
Bias Score [1] |
Spatial Distribution Score [1] |
Overall Score [1] |
|||
|---|---|---|---|---|---|---|---|---|---|---|---|---|
| Benchmark | [-] | 61.8 | ||||||||||
| CESM2_1 | [-] | 36.5 | 33.8 | 2.23 | 60.2 | 1.58 | -3.65 | 0.678 | 0.704 | 0.691 | ||
| CRUJRA | [-] | 59.9 | 53.8 | 5.29 | 60.2 | 1.58 | 0.724 | 0.734 | 0.886 | 0.810 | ||
| GSWP3 | [-] | 44.4 | 39.5 | 4.21 | 60.2 | 1.58 | -2.33 | 0.722 | 0.849 | 0.785 | ||
| PRINCETON | [-] | 57.7 | 51.8 | 5.07 | 60.2 | 1.58 | 0.264 | 0.713 | 0.856 | 0.784 |
Download Data |
Period Mean (original grids) [Pg] |
Model Period Mean (intersection) [Pg] |
Model Period Mean (complement) [Pg] |
Benchmark Period Mean (intersection) [Pg] |
Benchmark Period Mean (complement) [Pg] |
Bias [kg m-2] |
Bias Score [1] |
Spatial Distribution Score [1] |
Overall Score [1] |
|||
|---|---|---|---|---|---|---|---|---|---|---|---|---|
| Benchmark | [-] | 1.09e+03 | ||||||||||
| CESM2_1 | [-] | 967. | 621. | 346. | 1.03e+03 | 54.5 | -2.56 | 0.604 | 0.139 | 0.371 | ||
| CRUJRA | [-] | 1.57e+03 | 767. | 804. | 1.03e+03 | 54.5 | -1.34 | 0.631 | 0.569 | 0.600 | ||
| GSWP3 | [-] | 1.05e+03 | 609. | 445. | 1.03e+03 | 54.5 | -2.80 | 0.620 | 0.751 | 0.685 | ||
| PRINCETON | [-] | 2.00e+03 | 864. | 1.13e+03 | 1.03e+03 | 54.5 | -0.495 | 0.626 | 0.491 | 0.558 |
Download Data |
Period Mean (original grids) [Pg] |
Model Period Mean (intersection) [Pg] |
Model Period Mean (complement) [Pg] |
Benchmark Period Mean (intersection) [Pg] |
Benchmark Period Mean (complement) [Pg] |
Bias [kg m-2] |
Bias Score [1] |
Spatial Distribution Score [1] |
Overall Score [1] |
|||
|---|---|---|---|---|---|---|---|---|---|---|---|---|
| Benchmark | [-] | 64.3 | ||||||||||
| CESM2_1 | [-] | 15.0 | 14.9 | 0.266 | 63.6 | 0.698 | -2.89 | 0.483 | 0.808 | 0.646 | ||
| CRUJRA | [-] | 19.3 | 19.0 | 0.416 | 63.6 | 0.698 | -2.59 | 0.512 | 0.776 | 0.644 | ||
| GSWP3 | [-] | 14.1 | 13.9 | 0.385 | 63.6 | 0.698 | -2.91 | 0.483 | 0.819 | 0.651 | ||
| PRINCETON | [-] | 21.6 | 21.3 | 0.420 | 63.6 | 0.698 | -2.44 | 0.504 | 0.682 | 0.593 |
Download Data |
Period Mean (original grids) [Pg] |
Model Period Mean (intersection) [Pg] |
Model Period Mean (complement) [Pg] |
Benchmark Period Mean (intersection) [Pg] |
Benchmark Period Mean (complement) [Pg] |
Bias [kg m-2] |
Bias Score [1] |
Spatial Distribution Score [1] |
Overall Score [1] |
|||
|---|---|---|---|---|---|---|---|---|---|---|---|---|
| Benchmark | [-] | 13.3 | ||||||||||
| CESM2_1 | [-] | 100. | 20.1 | 81.2 | 12.1 | 1.24 | 27.1 | 0.407 | 0.00924 | 0.208 | ||
| CRUJRA | [-] | 201. | 11.8 | 190. | 12.1 | 1.24 | 5.69 | 0.458 | 0.343 | 0.400 | ||
| GSWP3 | [-] | 123. | 8.46 | 114. | 12.1 | 1.24 | -0.283 | 0.472 | 0.573 | 0.522 | ||
| PRINCETON | [-] | 350. | 17.7 | 333. | 12.1 | 1.24 | 11.6 | 0.459 | 0.135 | 0.297 |
Download Data |
Period Mean (original grids) [Pg] |
Model Period Mean (intersection) [Pg] |
Model Period Mean (complement) [Pg] |
Benchmark Period Mean (intersection) [Pg] |
Benchmark Period Mean (complement) [Pg] |
Bias [kg m-2] |
Bias Score [1] |
Spatial Distribution Score [1] |
Overall Score [1] |
|||
|---|---|---|---|---|---|---|---|---|---|---|---|---|
| Benchmark | [-] | 42.5 | ||||||||||
| CESM2_1 | [-] | 19.3 | 18.2 | 0.794 | 40.2 | 2.26 | -4.99 | 0.612 | 0.745 | 0.679 | ||
| CRUJRA | [-] | 18.6 | 17.3 | 0.883 | 40.2 | 2.26 | -4.94 | 0.579 | 0.772 | 0.675 | ||
| GSWP3 | [-] | 17.0 | 15.6 | 0.946 | 40.2 | 2.26 | -5.50 | 0.570 | 0.740 | 0.655 | ||
| PRINCETON | [-] | 21.5 | 20.0 | 0.990 | 40.2 | 2.26 | -4.06 | 0.592 | 0.820 | 0.706 |
Download Data |
Period Mean (original grids) [Pg] |
Model Period Mean (intersection) [Pg] |
Model Period Mean (complement) [Pg] |
Benchmark Period Mean (intersection) [Pg] |
Benchmark Period Mean (complement) [Pg] |
Bias [kg m-2] |
Bias Score [1] |
Spatial Distribution Score [1] |
Overall Score [1] |
|||
|---|---|---|---|---|---|---|---|---|---|---|---|---|
| Benchmark | [-] | 45.3 | ||||||||||
| CESM2_1 | [-] | 22.0 | 21.3 | 0.252 | 44.4 | 0.888 | -5.24 | 0.627 | 0.456 | 0.541 | ||
| CRUJRA | [-] | 38.3 | 37.3 | 0.356 | 44.4 | 0.888 | -1.26 | 0.764 | 0.769 | 0.767 | ||
| GSWP3 | [-] | 31.7 | 30.7 | 0.316 | 44.4 | 0.888 | -2.90 | 0.717 | 0.777 | 0.747 | ||
| PRINCETON | [-] | 39.5 | 38.4 | 0.374 | 44.4 | 0.888 | -0.943 | 0.766 | 0.836 | 0.801 |
Download Data |
Period Mean (original grids) [Pg] |
Model Period Mean (intersection) [Pg] |
Model Period Mean (complement) [Pg] |
Benchmark Period Mean (intersection) [Pg] |
Benchmark Period Mean (complement) [Pg] |
Bias [kg m-2] |
Bias Score [1] |
Spatial Distribution Score [1] |
Overall Score [1] |
|||
|---|---|---|---|---|---|---|---|---|---|---|---|---|
| Benchmark | [-] | 51.3 | ||||||||||
| CESM2_1 | [-] | 58.5 | 28.3 | 29.9 | 49.6 | 1.76 | -5.95 | 0.583 | 0.873 | 0.728 | ||
| CRUJRA | [-] | 103. | 49.2 | 53.6 | 49.6 | 1.76 | 0.638 | 0.652 | 0.866 | 0.759 | ||
| GSWP3 | [-] | 74.8 | 39.2 | 35.9 | 49.6 | 1.76 | -2.53 | 0.631 | 0.881 | 0.756 | ||
| PRINCETON | [-] | 114. | 57.8 | 56.2 | 49.6 | 1.76 | 3.28 | 0.639 | 0.674 | 0.657 |
Download Data |
Period Mean (original grids) [Pg] |
Model Period Mean (intersection) [Pg] |
Model Period Mean (complement) [Pg] |
Benchmark Period Mean (intersection) [Pg] |
Benchmark Period Mean (complement) [Pg] |
Bias [kg m-2] |
Bias Score [1] |
Spatial Distribution Score [1] |
Overall Score [1] |
|||
|---|---|---|---|---|---|---|---|---|---|---|---|---|
| Benchmark | [-] | 34.3 | ||||||||||
| CESM2_1 | [-] | 7.77 | 8.05 | 0.190 | 34.0 | 0.216 | -6.38 | 0.484 | 0.728 | 0.606 | ||
| CRUJRA | [-] | 12.2 | 12.4 | 0.431 | 34.0 | 0.216 | -5.20 | 0.539 | 0.840 | 0.689 | ||
| GSWP3 | [-] | 11.5 | 11.8 | 0.368 | 34.0 | 0.216 | -5.40 | 0.538 | 0.873 | 0.706 | ||
| PRINCETON | [-] | 17.3 | 17.3 | 0.753 | 34.0 | 0.216 | -3.96 | 0.582 | 0.768 | 0.675 |
Download Data |
Period Mean (original grids) [Pg] |
Model Period Mean (intersection) [Pg] |
Model Period Mean (complement) [Pg] |
Benchmark Period Mean (intersection) [Pg] |
Benchmark Period Mean (complement) [Pg] |
Bias [kg m-2] |
Bias Score [1] |
Spatial Distribution Score [1] |
Overall Score [1] |
|||
|---|---|---|---|---|---|---|---|---|---|---|---|---|
| Benchmark | [-] | 101. | ||||||||||
| CESM2_1 | [-] | 80.8 | 80.1 | 0.434 | 100. | 0.811 | -1.76 | 0.711 | 0.541 | 0.626 | ||
| CRUJRA | [-] | 85.2 | 84.3 | 0.378 | 100. | 0.811 | -1.38 | 0.725 | 0.442 | 0.584 | ||
| GSWP3 | [-] | 68.5 | 67.9 | 0.373 | 100. | 0.811 | -3.34 | 0.692 | 0.466 | 0.579 | ||
| PRINCETON | [-] | 84.1 | 83.2 | 0.394 | 100. | 0.811 | -1.49 | 0.728 | 0.491 | 0.610 |
Download Data |
Period Mean (original grids) [Pg] |
Model Period Mean (intersection) [Pg] |
Model Period Mean (complement) [Pg] |
Benchmark Period Mean (intersection) [Pg] |
Benchmark Period Mean (complement) [Pg] |
Bias [kg m-2] |
Bias Score [1] |
Spatial Distribution Score [1] |
Overall Score [1] |
|||
|---|---|---|---|---|---|---|---|---|---|---|---|---|
| Benchmark | [-] | 60.7 | ||||||||||
| CESM2_1 | [-] | 39.8 | 40.0 | 0.570 | 60.4 | 0.300 | -2.50 | 0.652 | 0.860 | 0.756 | ||
| CRUJRA | [-] | 61.9 | 62.3 | 0.506 | 60.4 | 0.300 | 0.796 | 0.674 | 0.899 | 0.787 | ||
| GSWP3 | [-] | 46.9 | 47.1 | 0.480 | 60.4 | 0.300 | -1.49 | 0.671 | 0.839 | 0.755 | ||
| PRINCETON | [-] | 63.4 | 64.0 | 0.608 | 60.4 | 0.300 | 1.09 | 0.678 | 0.907 | 0.793 |
Download Data |
Period Mean (original grids) [Pg] |
Model Period Mean (intersection) [Pg] |
Model Period Mean (complement) [Pg] |
Benchmark Period Mean (intersection) [Pg] |
Benchmark Period Mean (complement) [Pg] |
Bias [kg m-2] |
Bias Score [1] |
Spatial Distribution Score [1] |
Overall Score [1] |
|||
|---|---|---|---|---|---|---|---|---|---|---|---|---|
| Benchmark | [-] | 29.6 | ||||||||||
| CESM2_1 | [-] | 17.4 | 16.5 | 0.279 | 28.2 | 1.46 | -2.83 | 0.582 | 0.435 | 0.508 | ||
| CRUJRA | [-] | 14.6 | 13.9 | 0.246 | 28.2 | 1.46 | -3.26 | 0.552 | 0.703 | 0.627 | ||
| GSWP3 | [-] | 15.5 | 14.7 | 0.271 | 28.2 | 1.46 | -3.27 | 0.571 | 0.491 | 0.531 | ||
| PRINCETON | [-] | 22.0 | 21.0 | 0.204 | 28.2 | 1.46 | -1.28 | 0.572 | 0.723 | 0.648 |
Temporally integrated period mean