Mean State
Download Data |
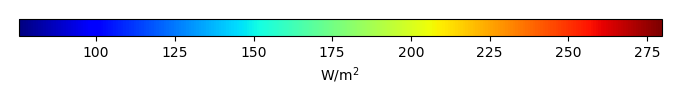
Period Mean (original grids) [W/m2] |
Model Period Mean (intersection) [W/m2] |
Model Period Mean (complement) [W/m2] |
Benchmark Period Mean (intersection) [W/m2] |
Benchmark Period Mean (complement) [W/m2] |
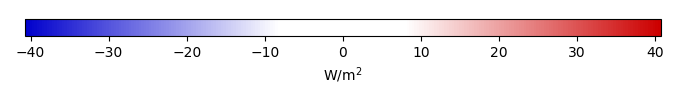
Bias [W/m2] |
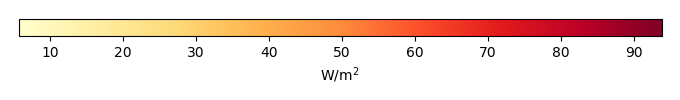
RMSE [W/m2] |
Phase Shift [months] |
Bias Score [1] |
RMSE Score [1] |
Seasonal Cycle Score [1] |
Spatial Distribution Score [1] |
Interannual Variability Score [1] |
Overall Score [1] |
|||
|---|---|---|---|---|---|---|---|---|---|---|---|---|---|---|---|---|---|
| Benchmark | [-] | 218. | |||||||||||||||
| CESM2_1 | [-] | 210. | 209. | 218. | 219. | -8.15 | 28.8 | 1.25 | 0.603 | 0.296 | 0.823 | 0.989 | 0.645 | 0.609 | |||
| CRUJRA | [-] | 225. | 225. | 218. | 219. | 6.92 | 17.7 | 1.10 | 0.645 | 0.499 | 0.854 | 0.990 | 0.481 | 0.662 | |||
| GSWP3 | [-] | 215. | 215. | 218. | 219. | -2.67 | 17.1 | 0.845 | 0.743 | 0.489 | 0.903 | 0.937 | 0.819 | 0.730 | |||
| PRINCETON | [-] | 212. | 211. | 218. | 219. | -6.53 | 16.7 | 0.873 | 0.689 | 0.513 | 0.881 | 0.994 | 0.866 | 0.743 |
Download Data |
Period Mean (original grids) [W/m2] |
Model Period Mean (intersection) [W/m2] |
Model Period Mean (complement) [W/m2] |
Benchmark Period Mean (intersection) [W/m2] |
Benchmark Period Mean (complement) [W/m2] |
Bias [W/m2] |
RMSE [W/m2] |
Phase Shift [months] |
Bias Score [1] |
RMSE Score [1] |
Seasonal Cycle Score [1] |
Spatial Distribution Score [1] |
Interannual Variability Score [1] |
Overall Score [1] |
|||
|---|---|---|---|---|---|---|---|---|---|---|---|---|---|---|---|---|---|
| Benchmark | [-] | 243. | |||||||||||||||
| CESM2_1 | [-] | 232. | 233. | 243. | 228. | -9.42 | 26.4 | 0.760 | 0.620 | 0.377 | 0.936 | 0.940 | 0.657 | 0.651 | |||
| CRUJRA | [-] | 241. | 242. | 243. | 228. | -1.21 | 20.2 | 0.742 | 0.588 | 0.539 | 0.927 | 0.976 | 0.737 | 0.718 | |||
| GSWP3 | [-] | 240. | 241. | 243. | 228. | -2.41 | 14.7 | 0.393 | 0.807 | 0.547 | 0.972 | 0.988 | 0.863 | 0.787 | |||
| PRINCETON | [-] | 228. | 229. | 243. | 228. | -14.2 | 20.5 | 0.551 | 0.549 | 0.565 | 0.957 | 0.985 | 0.785 | 0.734 |
Download Data |
Period Mean (original grids) [W/m2] |
Model Period Mean (intersection) [W/m2] |
Model Period Mean (complement) [W/m2] |
Benchmark Period Mean (intersection) [W/m2] |
Benchmark Period Mean (complement) [W/m2] |
Bias [W/m2] |
RMSE [W/m2] |
Phase Shift [months] |
Bias Score [1] |
RMSE Score [1] |
Seasonal Cycle Score [1] |
Spatial Distribution Score [1] |
Interannual Variability Score [1] |
Overall Score [1] |
|||
|---|---|---|---|---|---|---|---|---|---|---|---|---|---|---|---|---|---|
| Benchmark | [-] | 233. | |||||||||||||||
| CESM2_1 | [-] | 231. | 231. | 233. | 234. | -1.63 | 30.7 | 1.13 | 0.765 | 0.383 | 0.832 | 0.957 | 0.634 | 0.659 | |||
| CRUJRA | [-] | 229. | 230. | 233. | 234. | -3.52 | 18.5 | 0.937 | 0.724 | 0.588 | 0.866 | 0.868 | 0.557 | 0.699 | |||
| GSWP3 | [-] | 232. | 232. | 233. | 234. | -0.710 | 16.8 | 0.786 | 0.840 | 0.570 | 0.897 | 0.981 | 0.756 | 0.769 | |||
| PRINCETON | [-] | 232. | 232. | 233. | 234. | -0.986 | 15.7 | 0.770 | 0.827 | 0.592 | 0.902 | 1.00 | 0.895 | 0.801 |
Download Data |
Period Mean (original grids) [W/m2] |
Model Period Mean (intersection) [W/m2] |
Model Period Mean (complement) [W/m2] |
Benchmark Period Mean (intersection) [W/m2] |
Benchmark Period Mean (complement) [W/m2] |
Bias [W/m2] |
RMSE [W/m2] |
Phase Shift [months] |
Bias Score [1] |
RMSE Score [1] |
Seasonal Cycle Score [1] |
Spatial Distribution Score [1] |
Interannual Variability Score [1] |
Overall Score [1] |
|||
|---|---|---|---|---|---|---|---|---|---|---|---|---|---|---|---|---|---|
| Benchmark | [-] | 111. | |||||||||||||||
| CESM2_1 | [-] | 98.5 | 98.7 | 112. | 108. | -13.5 | 27.1 | 0.332 | 0.860 | 0.767 | 0.975 | 0.948 | 0.692 | 0.835 | |||
| CRUJRA | [-] | 112. | 112. | 112. | 108. | 0.660 | 22.9 | 0.894 | 0.954 | 0.781 | 0.937 | 0.976 | 0.602 | 0.838 | |||
| GSWP3 | [-] | 106. | 107. | 112. | 108. | -5.28 | 21.6 | 0.895 | 0.937 | 0.793 | 0.937 | 0.995 | 0.741 | 0.866 | |||
| PRINCETON | [-] | 104. | 104. | 112. | 108. | -8.81 | 21.1 | 0.771 | 0.906 | 0.807 | 0.947 | 0.875 | 0.877 | 0.870 |
Download Data |
Period Mean (original grids) [W/m2] |
Model Period Mean (intersection) [W/m2] |
Model Period Mean (complement) [W/m2] |
Benchmark Period Mean (intersection) [W/m2] |
Benchmark Period Mean (complement) [W/m2] |
Bias [W/m2] |
RMSE [W/m2] |
Phase Shift [months] |
Bias Score [1] |
RMSE Score [1] |
Seasonal Cycle Score [1] |
Spatial Distribution Score [1] |
Interannual Variability Score [1] |
Overall Score [1] |
|||
|---|---|---|---|---|---|---|---|---|---|---|---|---|---|---|---|---|---|
| Benchmark | [-] | 212. | |||||||||||||||
| CESM2_1 | [-] | 191. | 191. | 209. | 219. | -11.7 | 32.6 | 1.48 | 0.541 | 0.233 | 0.796 | 0.841 | 0.522 | 0.528 | |||
| CRUJRA | [-] | 217. | 217. | 209. | 219. | 10.3 | 20.5 | 1.30 | 0.590 | 0.454 | 0.808 | 0.999 | 0.563 | 0.645 | |||
| GSWP3 | [-] | 203. | 202. | 209. | 219. | -2.31 | 17.6 | 1.09 | 0.708 | 0.437 | 0.829 | 0.964 | 0.778 | 0.692 | |||
| PRINCETON | [-] | 193. | 193. | 209. | 219. | -11.8 | 19.2 | 0.971 | 0.534 | 0.502 | 0.849 | 0.963 | 0.878 | 0.705 |
Download Data |
Period Mean (original grids) [W/m2] |
Model Period Mean (intersection) [W/m2] |
Model Period Mean (complement) [W/m2] |
Benchmark Period Mean (intersection) [W/m2] |
Benchmark Period Mean (complement) [W/m2] |
Bias [W/m2] |
RMSE [W/m2] |
Phase Shift [months] |
Bias Score [1] |
RMSE Score [1] |
Seasonal Cycle Score [1] |
Spatial Distribution Score [1] |
Interannual Variability Score [1] |
Overall Score [1] |
|||
|---|---|---|---|---|---|---|---|---|---|---|---|---|---|---|---|---|---|
| Benchmark | [-] | 126. | |||||||||||||||
| CESM2_1 | [-] | 123. | 123. | 126. | 139. | -2.58 | 24.2 | 0.614 | 0.928 | 0.738 | 0.956 | 0.961 | 0.758 | 0.847 | |||
| CRUJRA | [-] | 133. | 133. | 126. | 139. | 7.34 | 21.5 | 0.370 | 0.897 | 0.785 | 0.970 | 0.989 | 0.676 | 0.850 | |||
| GSWP3 | [-] | 126. | 125. | 126. | 139. | -0.0545 | 14.7 | 0.342 | 0.956 | 0.833 | 0.972 | 0.964 | 0.643 | 0.867 | |||
| PRINCETON | [-] | 122. | 122. | 126. | 139. | -3.39 | 13.8 | 0.160 | 0.949 | 0.842 | 0.986 | 0.991 | 0.852 | 0.910 |
Download Data |
Period Mean (original grids) [W/m2] |
Model Period Mean (intersection) [W/m2] |
Model Period Mean (complement) [W/m2] |
Benchmark Period Mean (intersection) [W/m2] |
Benchmark Period Mean (complement) [W/m2] |
Bias [W/m2] |
RMSE [W/m2] |
Phase Shift [months] |
Bias Score [1] |
RMSE Score [1] |
Seasonal Cycle Score [1] |
Spatial Distribution Score [1] |
Interannual Variability Score [1] |
Overall Score [1] |
|||
|---|---|---|---|---|---|---|---|---|---|---|---|---|---|---|---|---|---|
| Benchmark | [-] | 174. | |||||||||||||||
| CESM2_1 | [-] | 188. | 188. | 175. | 163. | 12.4 | 30.2 | 0.579 | 0.792 | 0.656 | 0.952 | 0.998 | 0.838 | 0.815 | |||
| CRUJRA | [-] | 187. | 187. | 175. | 163. | 12.0 | 26.5 | 0.457 | 0.747 | 0.759 | 0.961 | 0.810 | 0.676 | 0.785 | |||
| GSWP3 | [-] | 171. | 170. | 175. | 163. | -4.64 | 17.8 | 0.366 | 0.869 | 0.776 | 0.969 | 0.978 | 0.626 | 0.832 | |||
| PRINCETON | [-] | 172. | 171. | 175. | 163. | -4.07 | 16.7 | 0.334 | 0.851 | 0.799 | 0.968 | 0.973 | 0.871 | 0.877 |
Download Data |
Period Mean (original grids) [W/m2] |
Model Period Mean (intersection) [W/m2] |
Model Period Mean (complement) [W/m2] |
Benchmark Period Mean (intersection) [W/m2] |
Benchmark Period Mean (complement) [W/m2] |
Bias [W/m2] |
RMSE [W/m2] |
Phase Shift [months] |
Bias Score [1] |
RMSE Score [1] |
Seasonal Cycle Score [1] |
Spatial Distribution Score [1] |
Interannual Variability Score [1] |
Overall Score [1] |
|||
|---|---|---|---|---|---|---|---|---|---|---|---|---|---|---|---|---|---|
| Benchmark | [-] | 210. | |||||||||||||||
| CESM2_1 | [-] | 215. | 215. | 210. | 218. | 5.69 | 32.9 | 0.490 | 0.770 | 0.424 | 0.960 | 0.981 | 0.631 | 0.698 | |||
| CRUJRA | [-] | 230. | 230. | 210. | 218. | 19.3 | 28.6 | 0.319 | 0.577 | 0.612 | 0.975 | 0.979 | 0.681 | 0.739 | |||
| GSWP3 | [-] | 207. | 207. | 210. | 218. | -1.45 | 19.3 | 0.328 | 0.807 | 0.623 | 0.973 | 0.937 | 0.745 | 0.784 | |||
| PRINCETON | [-] | 211. | 211. | 210. | 218. | 1.86 | 17.0 | 0.477 | 0.811 | 0.658 | 0.961 | 0.976 | 0.900 | 0.827 |
Download Data |
Period Mean (original grids) [W/m2] |
Model Period Mean (intersection) [W/m2] |
Model Period Mean (complement) [W/m2] |
Benchmark Period Mean (intersection) [W/m2] |
Benchmark Period Mean (complement) [W/m2] |
Bias [W/m2] |
RMSE [W/m2] |
Phase Shift [months] |
Bias Score [1] |
RMSE Score [1] |
Seasonal Cycle Score [1] |
Spatial Distribution Score [1] |
Interannual Variability Score [1] |
Overall Score [1] |
|||
|---|---|---|---|---|---|---|---|---|---|---|---|---|---|---|---|---|---|
| Benchmark | [-] | 98.9 | |||||||||||||||
| CESM2_1 | [-] | 87.0 | 87.2 | 99.3 | 90.5 | -13.0 | 27.3 | 0.648 | 0.868 | 0.765 | 0.955 | 0.931 | 0.779 | 0.844 | |||
| CRUJRA | [-] | 102. | 103. | 99.3 | 90.5 | 2.95 | 23.2 | 0.915 | 0.947 | 0.782 | 0.920 | 0.979 | 0.613 | 0.837 | |||
| GSWP3 | [-] | 96.0 | 96.3 | 99.3 | 90.5 | -3.59 | 20.4 | 0.692 | 0.950 | 0.806 | 0.953 | 0.886 | 0.671 | 0.845 | |||
| PRINCETON | [-] | 90.6 | 90.9 | 99.3 | 90.5 | -9.19 | 21.0 | 0.641 | 0.905 | 0.813 | 0.958 | 0.809 | 0.849 | 0.858 |
Download Data |
Period Mean (original grids) [W/m2] |
Model Period Mean (intersection) [W/m2] |
Model Period Mean (complement) [W/m2] |
Benchmark Period Mean (intersection) [W/m2] |
Benchmark Period Mean (complement) [W/m2] |
Bias [W/m2] |
RMSE [W/m2] |
Phase Shift [months] |
Bias Score [1] |
RMSE Score [1] |
Seasonal Cycle Score [1] |
Spatial Distribution Score [1] |
Interannual Variability Score [1] |
Overall Score [1] |
|||
|---|---|---|---|---|---|---|---|---|---|---|---|---|---|---|---|---|---|
| Benchmark | [-] | 235. | |||||||||||||||
| CESM2_1 | [-] | 238. | 238. | 237. | 210. | -2.30 | 27.3 | 0.371 | 0.907 | 0.621 | 0.973 | 0.982 | 0.854 | 0.826 | |||
| CRUJRA | [-] | 240. | 240. | 237. | 210. | 0.668 | 14.8 | 0.446 | 0.895 | 0.791 | 0.968 | 0.954 | 0.700 | 0.850 | |||
| GSWP3 | [-] | 231. | 231. | 237. | 210. | -7.53 | 17.8 | 0.369 | 0.855 | 0.773 | 0.971 | 0.996 | 0.727 | 0.849 | |||
| PRINCETON | [-] | 222. | 222. | 237. | 210. | -16.5 | 21.8 | 0.348 | 0.741 | 0.804 | 0.973 | 0.949 | 0.894 | 0.861 |
Download Data |
Period Mean (original grids) [W/m2] |
Model Period Mean (intersection) [W/m2] |
Model Period Mean (complement) [W/m2] |
Benchmark Period Mean (intersection) [W/m2] |
Benchmark Period Mean (complement) [W/m2] |
Bias [W/m2] |
RMSE [W/m2] |
Phase Shift [months] |
Bias Score [1] |
RMSE Score [1] |
Seasonal Cycle Score [1] |
Spatial Distribution Score [1] |
Interannual Variability Score [1] |
Overall Score [1] |
|||
|---|---|---|---|---|---|---|---|---|---|---|---|---|---|---|---|---|---|
| Benchmark | [-] | 140. | |||||||||||||||
| CESM2_1 | [-] | 145. | 145. | 138. | 155. | 8.94 | 27.7 | 0.269 | 0.858 | 0.737 | 0.982 | 0.957 | 0.851 | 0.854 | |||
| CRUJRA | [-] | 156. | 156. | 138. | 155. | 18.8 | 25.3 | 0.235 | 0.783 | 0.830 | 0.984 | 0.994 | 0.721 | 0.857 | |||
| GSWP3 | [-] | 135. | 135. | 138. | 155. | -0.611 | 14.4 | 0.228 | 0.939 | 0.844 | 0.985 | 0.998 | 0.646 | 0.876 | |||
| PRINCETON | [-] | 135. | 135. | 138. | 155. | -1.44 | 11.3 | 0.156 | 0.949 | 0.876 | 0.990 | 0.999 | 0.811 | 0.917 |
Download Data |
Period Mean (original grids) [W/m2] |
Model Period Mean (intersection) [W/m2] |
Model Period Mean (complement) [W/m2] |
Benchmark Period Mean (intersection) [W/m2] |
Benchmark Period Mean (complement) [W/m2] |
Bias [W/m2] |
RMSE [W/m2] |
Phase Shift [months] |
Bias Score [1] |
RMSE Score [1] |
Seasonal Cycle Score [1] |
Spatial Distribution Score [1] |
Interannual Variability Score [1] |
Overall Score [1] |
|||
|---|---|---|---|---|---|---|---|---|---|---|---|---|---|---|---|---|---|
| Benchmark | [-] | 187. | |||||||||||||||
| CESM2_1 | [-] | 189. | 189. | 186. | 187. | 1.66 | 27.0 | 0.627 | 0.803 | 0.616 | 0.934 | 0.990 | 0.746 | 0.784 | |||
| CRUJRA | [-] | 190. | 190. | 186. | 187. | 2.99 | 26.8 | 0.549 | 0.780 | 0.696 | 0.943 | 0.995 | 0.622 | 0.789 | |||
| GSWP3 | [-] | 181. | 181. | 186. | 187. | -5.32 | 18.5 | 0.424 | 0.855 | 0.726 | 0.958 | 0.998 | 0.726 | 0.831 | |||
| PRINCETON | [-] | 181. | 181. | 186. | 187. | -6.00 | 18.0 | 0.412 | 0.824 | 0.746 | 0.957 | 0.998 | 0.798 | 0.845 |
Download Data |
Period Mean (original grids) [W/m2] |
Model Period Mean (intersection) [W/m2] |
Model Period Mean (complement) [W/m2] |
Benchmark Period Mean (intersection) [W/m2] |
Benchmark Period Mean (complement) [W/m2] |
Bias [W/m2] |
RMSE [W/m2] |
Phase Shift [months] |
Bias Score [1] |
RMSE Score [1] |
Seasonal Cycle Score [1] |
Spatial Distribution Score [1] |
Interannual Variability Score [1] |
Overall Score [1] |
|||
|---|---|---|---|---|---|---|---|---|---|---|---|---|---|---|---|---|---|
| Benchmark | [-] | 249. | |||||||||||||||
| CESM2_1 | [-] | 260. | 260. | 250. | 235. | 8.32 | 22.1 | 0.628 | 0.804 | 0.703 | 0.950 | 0.993 | 0.793 | 0.824 | |||
| CRUJRA | [-] | 245. | 245. | 250. | 235. | -5.33 | 17.7 | 0.378 | 0.801 | 0.780 | 0.970 | 0.987 | 0.724 | 0.840 | |||
| GSWP3 | [-] | 240. | 240. | 250. | 235. | -10.3 | 17.6 | 0.353 | 0.803 | 0.771 | 0.971 | 0.999 | 0.707 | 0.837 | |||
| PRINCETON | [-] | 243. | 243. | 250. | 235. | -7.72 | 15.3 | 0.312 | 0.819 | 0.792 | 0.975 | 0.988 | 0.814 | 0.863 |
Download Data |
Period Mean (original grids) [W/m2] |
Model Period Mean (intersection) [W/m2] |
Model Period Mean (complement) [W/m2] |
Benchmark Period Mean (intersection) [W/m2] |
Benchmark Period Mean (complement) [W/m2] |
Bias [W/m2] |
RMSE [W/m2] |
Phase Shift [months] |
Bias Score [1] |
RMSE Score [1] |
Seasonal Cycle Score [1] |
Spatial Distribution Score [1] |
Interannual Variability Score [1] |
Overall Score [1] |
|||
|---|---|---|---|---|---|---|---|---|---|---|---|---|---|---|---|---|---|
| Benchmark | [-] | 116. | |||||||||||||||
| CESM2_1 | [-] | 98.9 | 98.8 | 116. | 114. | -17.7 | 31.1 | 0.386 | 0.829 | 0.756 | 0.974 | 0.997 | 0.768 | 0.847 | |||
| CRUJRA | [-] | 117. | 117. | 116. | 114. | 0.889 | 23.7 | 0.623 | 0.950 | 0.783 | 0.955 | 0.976 | 0.469 | 0.819 | |||
| GSWP3 | [-] | 108. | 108. | 116. | 114. | -8.44 | 23.8 | 0.659 | 0.913 | 0.791 | 0.949 | 0.991 | 0.752 | 0.865 | |||
| PRINCETON | [-] | 104. | 104. | 116. | 114. | -13.0 | 25.8 | 0.554 | 0.871 | 0.791 | 0.960 | 0.916 | 0.845 | 0.862 |
Download Data |
Period Mean (original grids) [W/m2] |
Model Period Mean (intersection) [W/m2] |
Model Period Mean (complement) [W/m2] |
Benchmark Period Mean (intersection) [W/m2] |
Benchmark Period Mean (complement) [W/m2] |
Bias [W/m2] |
RMSE [W/m2] |
Phase Shift [months] |
Bias Score [1] |
RMSE Score [1] |
Seasonal Cycle Score [1] |
Spatial Distribution Score [1] |
Interannual Variability Score [1] |
Overall Score [1] |
|||
|---|---|---|---|---|---|---|---|---|---|---|---|---|---|---|---|---|---|
| Benchmark | [-] | 230. | |||||||||||||||
| CESM2_1 | [-] | 234. | 234. | 229. | 232. | 5.75 | 29.6 | 0.637 | 0.730 | 0.516 | 0.942 | 0.995 | 0.708 | 0.734 | |||
| CRUJRA | [-] | 224. | 224. | 229. | 232. | -4.51 | 25.9 | 0.870 | 0.647 | 0.652 | 0.921 | 0.670 | 0.714 | 0.709 | |||
| GSWP3 | [-] | 225. | 226. | 229. | 232. | -2.36 | 17.1 | 0.281 | 0.809 | 0.688 | 0.971 | 0.995 | 0.768 | 0.820 | |||
| PRINCETON | [-] | 226. | 227. | 229. | 232. | -2.48 | 14.5 | 0.311 | 0.829 | 0.732 | 0.967 | 0.992 | 0.901 | 0.859 |
Download Data |
Period Mean (original grids) [W/m2] |
Model Period Mean (intersection) [W/m2] |
Model Period Mean (complement) [W/m2] |
Benchmark Period Mean (intersection) [W/m2] |
Benchmark Period Mean (complement) [W/m2] |
Bias [W/m2] |
RMSE [W/m2] |
Phase Shift [months] |
Bias Score [1] |
RMSE Score [1] |
Seasonal Cycle Score [1] |
Spatial Distribution Score [1] |
Interannual Variability Score [1] |
Overall Score [1] |
|||
|---|---|---|---|---|---|---|---|---|---|---|---|---|---|---|---|---|---|
| Benchmark | [-] | 177. | |||||||||||||||
| CESM2_1 | [-] | 191. | 191. | 176. | 204. | 15.8 | 29.0 | 0.299 | 0.790 | 0.698 | 0.980 | 0.989 | 0.927 | 0.847 | |||
| CRUJRA | [-] | 184. | 184. | 176. | 204. | 9.26 | 18.3 | 0.356 | 0.866 | 0.796 | 0.976 | 0.976 | 0.482 | 0.815 | |||
| GSWP3 | [-] | 172. | 172. | 176. | 204. | -2.36 | 14.9 | 0.261 | 0.946 | 0.798 | 0.983 | 0.996 | 0.649 | 0.862 | |||
| PRINCETON | [-] | 172. | 172. | 176. | 204. | -2.08 | 11.0 | 0.158 | 0.950 | 0.850 | 0.990 | 1.00 | 0.833 | 0.912 |
Download Data |
Period Mean (original grids) [W/m2] |
Model Period Mean (intersection) [W/m2] |
Model Period Mean (complement) [W/m2] |
Benchmark Period Mean (intersection) [W/m2] |
Benchmark Period Mean (complement) [W/m2] |
Bias [W/m2] |
RMSE [W/m2] |
Phase Shift [months] |
Bias Score [1] |
RMSE Score [1] |
Seasonal Cycle Score [1] |
Spatial Distribution Score [1] |
Interannual Variability Score [1] |
Overall Score [1] |
|||
|---|---|---|---|---|---|---|---|---|---|---|---|---|---|---|---|---|---|
| Benchmark | [-] | 136. | |||||||||||||||
| CESM2_1 | [-] | 138. | 138. | 137. | 128. | 1.01 | 24.6 | 0.507 | 0.904 | 0.743 | 0.963 | 0.798 | 0.837 | 0.831 | |||
| CRUJRA | [-] | 148. | 148. | 137. | 128. | 11.6 | 23.1 | 0.317 | 0.858 | 0.787 | 0.977 | 0.990 | 0.497 | 0.816 | |||
| GSWP3 | [-] | 135. | 135. | 137. | 128. | -1.63 | 14.4 | 0.185 | 0.953 | 0.836 | 0.987 | 0.997 | 0.652 | 0.877 | |||
| PRINCETON | [-] | 134. | 134. | 137. | 128. | -2.96 | 14.2 | 0.182 | 0.931 | 0.845 | 0.988 | 0.999 | 0.796 | 0.901 |
Download Data |
Period Mean (original grids) [W/m2] |
Model Period Mean (intersection) [W/m2] |
Model Period Mean (complement) [W/m2] |
Benchmark Period Mean (intersection) [W/m2] |
Benchmark Period Mean (complement) [W/m2] |
Bias [W/m2] |
RMSE [W/m2] |
Phase Shift [months] |
Bias Score [1] |
RMSE Score [1] |
Seasonal Cycle Score [1] |
Spatial Distribution Score [1] |
Interannual Variability Score [1] |
Overall Score [1] |
|||
|---|---|---|---|---|---|---|---|---|---|---|---|---|---|---|---|---|---|
| Benchmark | [-] | 199. | |||||||||||||||
| CESM2_1 | [-] | 212. | 212. | 200. | 176. | 11.7 | 27.2 | 0.252 | 0.858 | 0.740 | 0.982 | 0.995 | 0.827 | 0.857 | |||
| CRUJRA | [-] | 190. | 190. | 200. | 176. | -9.90 | 19.5 | 0.248 | 0.867 | 0.816 | 0.983 | 0.929 | 0.523 | 0.823 | |||
| GSWP3 | [-] | 194. | 194. | 200. | 176. | -5.87 | 15.0 | 0.152 | 0.915 | 0.841 | 0.990 | 0.982 | 0.679 | 0.874 | |||
| PRINCETON | [-] | 197. | 197. | 200. | 176. | -2.75 | 12.2 | 0.125 | 0.941 | 0.867 | 0.992 | 0.991 | 0.877 | 0.923 |
Download Data |
Period Mean (original grids) [W/m2] |
Model Period Mean (intersection) [W/m2] |
Model Period Mean (complement) [W/m2] |
Benchmark Period Mean (intersection) [W/m2] |
Benchmark Period Mean (complement) [W/m2] |
Bias [W/m2] |
RMSE [W/m2] |
Phase Shift [months] |
Bias Score [1] |
RMSE Score [1] |
Seasonal Cycle Score [1] |
Spatial Distribution Score [1] |
Interannual Variability Score [1] |
Overall Score [1] |
|||
|---|---|---|---|---|---|---|---|---|---|---|---|---|---|---|---|---|---|
| Benchmark | [-] | 206. | |||||||||||||||
| CESM2_1 | [-] | 214. | 214. | 206. | 229. | 8.70 | 30.5 | 1.58 | 0.571 | 0.254 | 0.785 | 0.963 | 0.702 | 0.588 | |||
| CRUJRA | [-] | 210. | 210. | 206. | 229. | 4.58 | 18.7 | 1.37 | 0.621 | 0.474 | 0.800 | 0.901 | 0.585 | 0.642 | |||
| GSWP3 | [-] | 200. | 200. | 206. | 229. | -4.44 | 16.2 | 0.734 | 0.705 | 0.471 | 0.906 | 0.999 | 0.806 | 0.726 | |||
| PRINCETON | [-] | 196. | 196. | 206. | 229. | -8.94 | 18.4 | 0.888 | 0.570 | 0.477 | 0.886 | 0.975 | 0.886 | 0.712 |
Download Data |
Period Mean (original grids) [W/m2] |
Model Period Mean (intersection) [W/m2] |
Model Period Mean (complement) [W/m2] |
Benchmark Period Mean (intersection) [W/m2] |
Benchmark Period Mean (complement) [W/m2] |
Bias [W/m2] |
RMSE [W/m2] |
Phase Shift [months] |
Bias Score [1] |
RMSE Score [1] |
Seasonal Cycle Score [1] |
Spatial Distribution Score [1] |
Interannual Variability Score [1] |
Overall Score [1] |
|||
|---|---|---|---|---|---|---|---|---|---|---|---|---|---|---|---|---|---|
| Benchmark | [-] | 216. | |||||||||||||||
| CESM2_1 | [-] | 223. | 224. | 216. | 214. | 7.31 | 32.5 | 1.04 | 0.775 | 0.454 | 0.858 | 0.997 | 0.767 | 0.717 | |||
| CRUJRA | [-] | 217. | 217. | 216. | 214. | 1.10 | 22.6 | 0.767 | 0.692 | 0.637 | 0.918 | 0.775 | 0.516 | 0.696 | |||
| GSWP3 | [-] | 211. | 211. | 216. | 214. | -4.62 | 18.2 | 0.768 | 0.823 | 0.641 | 0.903 | 0.991 | 0.711 | 0.785 | |||
| PRINCETON | [-] | 210. | 211. | 216. | 214. | -5.15 | 16.0 | 0.819 | 0.814 | 0.684 | 0.886 | 0.996 | 0.879 | 0.824 |
Download Data |
Period Mean (original grids) [W/m2] |
Model Period Mean (intersection) [W/m2] |
Model Period Mean (complement) [W/m2] |
Benchmark Period Mean (intersection) [W/m2] |
Benchmark Period Mean (complement) [W/m2] |
Bias [W/m2] |
RMSE [W/m2] |
Phase Shift [months] |
Bias Score [1] |
RMSE Score [1] |
Seasonal Cycle Score [1] |
Spatial Distribution Score [1] |
Interannual Variability Score [1] |
Overall Score [1] |
|||
|---|---|---|---|---|---|---|---|---|---|---|---|---|---|---|---|---|---|
| Benchmark | [-] | 208. | |||||||||||||||
| CESM2_1 | [-] | 220. | 219. | 211. | 183. | 2.37 | 34.9 | 0.825 | 0.746 | 0.607 | 0.902 | 0.982 | 0.710 | 0.759 | |||
| CRUJRA | [-] | 212. | 212. | 211. | 183. | -2.50 | 30.9 | 0.452 | 0.691 | 0.703 | 0.956 | 0.741 | 0.668 | 0.744 | |||
| GSWP3 | [-] | 209. | 208. | 211. | 183. | -7.33 | 23.1 | 0.365 | 0.791 | 0.729 | 0.961 | 0.997 | 0.704 | 0.818 | |||
| PRINCETON | [-] | 209. | 208. | 211. | 183. | -8.52 | 20.1 | 0.393 | 0.801 | 0.757 | 0.960 | 0.996 | 0.835 | 0.851 |
Temporally integrated period mean