Mean State
Download Data |
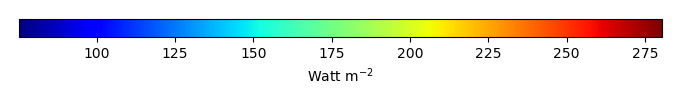
Period Mean (original grids) [Watt m-2] |
Model Period Mean (intersection) [Watt m-2] |
Model Period Mean (complement) [Watt m-2] |
Benchmark Period Mean (intersection) [Watt m-2] |
Benchmark Period Mean (complement) [Watt m-2] |
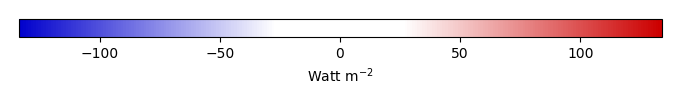
Bias [Watt m-2] |
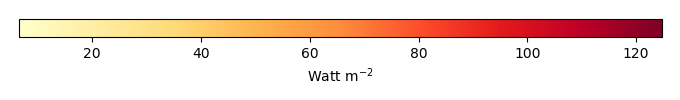
RMSE [Watt m-2] |
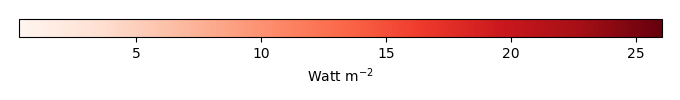
Phase Shift [months] |
Bias Score [1] |
RMSE Score [1] |
Seasonal Cycle Score [1] |
Spatial Distribution Score [1] |
Interannual Variability Score [1] |
Overall Score [1] |
|||
|---|---|---|---|---|---|---|---|---|---|---|---|---|---|---|---|---|---|
| Benchmark | [-] | 217. | |||||||||||||||
| CESM2_1 | [-] | 209. | 209. | 217. | 232. | -6.80 | 28.6 | 1.20 | 0.576 | 0.342 | 0.828 | 0.902 | 0.811 | 0.633 | |||
| CRUJRA | [-] | 225. | 224. | 217. | 232. | 8.22 | 20.9 | 1.02 | 0.634 | 0.472 | 0.854 | 0.991 | 0.523 | 0.658 | |||
| GSWP3 | [-] | 217. | 216. | 217. | 232. | 0.504 | 14.1 | 0.318 | 0.860 | 0.543 | 0.956 | 0.999 | 0.759 | 0.777 | |||
| PRINCETON | [-] | 216. | 215. | 217. | 232. | -0.685 | 11.7 | 0.685 | 0.778 | 0.651 | 0.901 | 0.983 | 0.923 | 0.815 |
Download Data |
Period Mean (original grids) [Watt m-2] |
Model Period Mean (intersection) [Watt m-2] |
Model Period Mean (complement) [Watt m-2] |
Benchmark Period Mean (intersection) [Watt m-2] |
Benchmark Period Mean (complement) [Watt m-2] |
Bias [Watt m-2] |
RMSE [Watt m-2] |
Phase Shift [months] |
Bias Score [1] |
RMSE Score [1] |
Seasonal Cycle Score [1] |
Spatial Distribution Score [1] |
Interannual Variability Score [1] |
Overall Score [1] |
|||
|---|---|---|---|---|---|---|---|---|---|---|---|---|---|---|---|---|---|
| Benchmark | [-] | 241. | |||||||||||||||
| CESM2_1 | [-] | 233. | 234. | 241. | 238. | -6.42 | 26.9 | 0.643 | 0.653 | 0.430 | 0.950 | 0.876 | 0.828 | 0.695 | |||
| CRUJRA | [-] | 241. | 242. | 241. | 238. | 0.590 | 22.6 | 0.662 | 0.647 | 0.521 | 0.942 | 0.936 | 0.658 | 0.704 | |||
| GSWP3 | [-] | 240. | 241. | 241. | 238. | -0.171 | 13.3 | 0.143 | 0.901 | 0.613 | 0.990 | 0.999 | 0.815 | 0.822 | |||
| PRINCETON | [-] | 233. | 233. | 241. | 238. | -7.83 | 15.3 | 0.472 | 0.725 | 0.671 | 0.956 | 0.999 | 0.927 | 0.825 |
Download Data |
Period Mean (original grids) [Watt m-2] |
Model Period Mean (intersection) [Watt m-2] |
Model Period Mean (complement) [Watt m-2] |
Benchmark Period Mean (intersection) [Watt m-2] |
Benchmark Period Mean (complement) [Watt m-2] |
Bias [Watt m-2] |
RMSE [Watt m-2] |
Phase Shift [months] |
Bias Score [1] |
RMSE Score [1] |
Seasonal Cycle Score [1] |
Spatial Distribution Score [1] |
Interannual Variability Score [1] |
Overall Score [1] |
|||
|---|---|---|---|---|---|---|---|---|---|---|---|---|---|---|---|---|---|
| Benchmark | [-] | 233. | |||||||||||||||
| CESM2_1 | [-] | 230. | 230. | 233. | 238. | -2.28 | 32.5 | 0.975 | 0.755 | 0.386 | 0.882 | 0.926 | 0.779 | 0.685 | |||
| CRUJRA | [-] | 229. | 229. | 233. | 238. | -4.28 | 21.2 | 0.821 | 0.712 | 0.557 | 0.896 | 0.893 | 0.558 | 0.696 | |||
| GSWP3 | [-] | 233. | 233. | 233. | 238. | 0.143 | 15.9 | 0.237 | 0.890 | 0.601 | 0.969 | 0.994 | 0.696 | 0.792 | |||
| PRINCETON | [-] | 233. | 233. | 233. | 238. | -0.151 | 12.0 | 0.451 | 0.833 | 0.723 | 0.942 | 0.999 | 0.920 | 0.857 |
Download Data |
Period Mean (original grids) [Watt m-2] |
Model Period Mean (intersection) [Watt m-2] |
Model Period Mean (complement) [Watt m-2] |
Benchmark Period Mean (intersection) [Watt m-2] |
Benchmark Period Mean (complement) [Watt m-2] |
Bias [Watt m-2] |
RMSE [Watt m-2] |
Phase Shift [months] |
Bias Score [1] |
RMSE Score [1] |
Seasonal Cycle Score [1] |
Spatial Distribution Score [1] |
Interannual Variability Score [1] |
Overall Score [1] |
|||
|---|---|---|---|---|---|---|---|---|---|---|---|---|---|---|---|---|---|
| Benchmark | [-] | 111. | |||||||||||||||
| CESM2_1 | [-] | 98.1 | 98.2 | 111. | 117. | -13.0 | 30.9 | 0.747 | 0.864 | 0.708 | 0.950 | 0.793 | 0.793 | 0.803 | |||
| CRUJRA | [-] | 112. | 112. | 111. | 117. | 1.42 | 16.6 | 0.0329 | 0.934 | 0.826 | 0.998 | 0.991 | 0.516 | 0.848 | |||
| GSWP3 | [-] | 107. | 107. | 111. | 117. | -3.90 | 12.6 | 0.0241 | 0.948 | 0.850 | 0.998 | 0.896 | 0.691 | 0.872 | |||
| PRINCETON | [-] | 106. | 106. | 111. | 117. | -5.11 | 11.4 | 0.0457 | 0.920 | 0.869 | 0.997 | 0.737 | 0.906 | 0.883 |
Download Data |
Period Mean (original grids) [Watt m-2] |
Model Period Mean (intersection) [Watt m-2] |
Model Period Mean (complement) [Watt m-2] |
Benchmark Period Mean (intersection) [Watt m-2] |
Benchmark Period Mean (complement) [Watt m-2] |
Bias [Watt m-2] |
RMSE [Watt m-2] |
Phase Shift [months] |
Bias Score [1] |
RMSE Score [1] |
Seasonal Cycle Score [1] |
Spatial Distribution Score [1] |
Interannual Variability Score [1] |
Overall Score [1] |
|||
|---|---|---|---|---|---|---|---|---|---|---|---|---|---|---|---|---|---|
| Benchmark | [-] | 213. | |||||||||||||||
| CESM2_1 | [-] | 190. | 190. | 209. | 225. | -12.0 | 34.4 | 1.56 | 0.544 | 0.249 | 0.788 | 0.973 | 0.683 | 0.581 | |||
| CRUJRA | [-] | 217. | 217. | 209. | 225. | 10.5 | 24.6 | 1.47 | 0.540 | 0.434 | 0.793 | 0.915 | 0.518 | 0.605 | |||
| GSWP3 | [-] | 205. | 205. | 209. | 225. | 0.417 | 17.6 | 0.524 | 0.789 | 0.464 | 0.924 | 0.989 | 0.769 | 0.733 | |||
| PRINCETON | [-] | 199. | 199. | 209. | 225. | -5.27 | 14.8 | 0.764 | 0.656 | 0.616 | 0.892 | 0.981 | 0.892 | 0.776 |
Download Data |
Period Mean (original grids) [Watt m-2] |
Model Period Mean (intersection) [Watt m-2] |
Model Period Mean (complement) [Watt m-2] |
Benchmark Period Mean (intersection) [Watt m-2] |
Benchmark Period Mean (complement) [Watt m-2] |
Bias [Watt m-2] |
RMSE [Watt m-2] |
Phase Shift [months] |
Bias Score [1] |
RMSE Score [1] |
Seasonal Cycle Score [1] |
Spatial Distribution Score [1] |
Interannual Variability Score [1] |
Overall Score [1] |
|||
|---|---|---|---|---|---|---|---|---|---|---|---|---|---|---|---|---|---|
| Benchmark | [-] | 126. | |||||||||||||||
| CESM2_1 | [-] | 120. | 120. | 126. | 145. | -5.51 | 26.1 | 0.480 | 0.897 | 0.736 | 0.968 | 0.827 | 0.774 | 0.823 | |||
| CRUJRA | [-] | 133. | 133. | 126. | 145. | 7.15 | 18.1 | 0.148 | 0.903 | 0.817 | 0.990 | 0.994 | 0.577 | 0.850 | |||
| GSWP3 | [-] | 126. | 125. | 126. | 145. | 0.0721 | 11.8 | 0.0425 | 0.982 | 0.860 | 0.997 | 1.00 | 0.637 | 0.889 | |||
| PRINCETON | [-] | 124. | 124. | 126. | 145. | -1.69 | 9.51 | 0.106 | 0.956 | 0.895 | 0.993 | 0.988 | 0.908 | 0.939 |
Download Data |
Period Mean (original grids) [Watt m-2] |
Model Period Mean (intersection) [Watt m-2] |
Model Period Mean (complement) [Watt m-2] |
Benchmark Period Mean (intersection) [Watt m-2] |
Benchmark Period Mean (complement) [Watt m-2] |
Bias [Watt m-2] |
RMSE [Watt m-2] |
Phase Shift [months] |
Bias Score [1] |
RMSE Score [1] |
Seasonal Cycle Score [1] |
Spatial Distribution Score [1] |
Interannual Variability Score [1] |
Overall Score [1] |
|||
|---|---|---|---|---|---|---|---|---|---|---|---|---|---|---|---|---|---|
| Benchmark | [-] | 170. | |||||||||||||||
| CESM2_1 | [-] | 189. | 189. | 170. | 173. | 18.1 | 34.0 | 0.600 | 0.730 | 0.633 | 0.946 | 0.982 | 0.851 | 0.796 | |||
| CRUJRA | [-] | 187. | 186. | 170. | 173. | 16.4 | 27.3 | 0.485 | 0.731 | 0.735 | 0.961 | 0.889 | 0.622 | 0.779 | |||
| GSWP3 | [-] | 171. | 171. | 170. | 173. | 0.447 | 14.1 | 0.131 | 0.949 | 0.787 | 0.988 | 0.999 | 0.620 | 0.855 | |||
| PRINCETON | [-] | 173. | 172. | 170. | 173. | 2.07 | 13.2 | 0.270 | 0.896 | 0.824 | 0.976 | 0.999 | 0.890 | 0.901 |
Download Data |
Period Mean (original grids) [Watt m-2] |
Model Period Mean (intersection) [Watt m-2] |
Model Period Mean (complement) [Watt m-2] |
Benchmark Period Mean (intersection) [Watt m-2] |
Benchmark Period Mean (complement) [Watt m-2] |
Bias [Watt m-2] |
RMSE [Watt m-2] |
Phase Shift [months] |
Bias Score [1] |
RMSE Score [1] |
Seasonal Cycle Score [1] |
Spatial Distribution Score [1] |
Interannual Variability Score [1] |
Overall Score [1] |
|||
|---|---|---|---|---|---|---|---|---|---|---|---|---|---|---|---|---|---|
| Benchmark | [-] | 210. | |||||||||||||||
| CESM2_1 | [-] | 217. | 217. | 209. | 224. | 8.54 | 36.6 | 0.493 | 0.709 | 0.429 | 0.961 | 0.909 | 0.765 | 0.700 | |||
| CRUJRA | [-] | 230. | 230. | 209. | 224. | 21.1 | 32.1 | 0.303 | 0.569 | 0.578 | 0.978 | 0.995 | 0.549 | 0.708 | |||
| GSWP3 | [-] | 208. | 208. | 209. | 224. | 0.482 | 16.5 | 0.148 | 0.894 | 0.657 | 0.990 | 0.991 | 0.664 | 0.809 | |||
| PRINCETON | [-] | 214. | 214. | 209. | 224. | 5.29 | 16.3 | 0.331 | 0.790 | 0.718 | 0.976 | 0.999 | 0.895 | 0.849 |
Download Data |
Period Mean (original grids) [Watt m-2] |
Model Period Mean (intersection) [Watt m-2] |
Model Period Mean (complement) [Watt m-2] |
Benchmark Period Mean (intersection) [Watt m-2] |
Benchmark Period Mean (complement) [Watt m-2] |
Bias [Watt m-2] |
RMSE [Watt m-2] |
Phase Shift [months] |
Bias Score [1] |
RMSE Score [1] |
Seasonal Cycle Score [1] |
Spatial Distribution Score [1] |
Interannual Variability Score [1] |
Overall Score [1] |
|||
|---|---|---|---|---|---|---|---|---|---|---|---|---|---|---|---|---|---|
| Benchmark | [-] | 105. | |||||||||||||||
| CESM2_1 | [-] | 86.1 | 86.3 | 105. | 108. | -19.3 | 31.2 | 0.386 | 0.802 | 0.700 | 0.972 | 0.881 | 0.790 | 0.807 | |||
| CRUJRA | [-] | 103. | 103. | 105. | 108. | -2.23 | 17.8 | 0.267 | 0.923 | 0.796 | 0.982 | 0.946 | 0.522 | 0.828 | |||
| GSWP3 | [-] | 96.3 | 96.5 | 105. | 108. | -8.76 | 12.5 | 0.0632 | 0.901 | 0.827 | 0.996 | 0.798 | 0.644 | 0.832 | |||
| PRINCETON | [-] | 93.1 | 93.4 | 105. | 108. | -12.0 | 11.4 | 0.0837 | 0.869 | 0.847 | 0.994 | 0.784 | 0.903 | 0.874 |
Download Data |
Period Mean (original grids) [Watt m-2] |
Model Period Mean (intersection) [Watt m-2] |
Model Period Mean (complement) [Watt m-2] |
Benchmark Period Mean (intersection) [Watt m-2] |
Benchmark Period Mean (complement) [Watt m-2] |
Bias [Watt m-2] |
RMSE [Watt m-2] |
Phase Shift [months] |
Bias Score [1] |
RMSE Score [1] |
Seasonal Cycle Score [1] |
Spatial Distribution Score [1] |
Interannual Variability Score [1] |
Overall Score [1] |
|||
|---|---|---|---|---|---|---|---|---|---|---|---|---|---|---|---|---|---|
| Benchmark | [-] | 228. | |||||||||||||||
| CESM2_1 | [-] | 237. | 237. | 229. | 216. | 4.10 | 30.5 | 0.518 | 0.859 | 0.590 | 0.965 | 0.970 | 0.898 | 0.812 | |||
| CRUJRA | [-] | 238. | 238. | 229. | 216. | 5.98 | 19.3 | 0.361 | 0.859 | 0.740 | 0.975 | 0.960 | 0.668 | 0.824 | |||
| GSWP3 | [-] | 232. | 232. | 229. | 216. | 0.0913 | 15.0 | 0.0879 | 0.946 | 0.762 | 0.993 | 1.00 | 0.677 | 0.857 | |||
| PRINCETON | [-] | 225. | 225. | 229. | 216. | -6.53 | 12.3 | 0.193 | 0.851 | 0.855 | 0.986 | 0.973 | 0.870 | 0.898 |
Download Data |
Period Mean (original grids) [Watt m-2] |
Model Period Mean (intersection) [Watt m-2] |
Model Period Mean (complement) [Watt m-2] |
Benchmark Period Mean (intersection) [Watt m-2] |
Benchmark Period Mean (complement) [Watt m-2] |
Bias [Watt m-2] |
RMSE [Watt m-2] |
Phase Shift [months] |
Bias Score [1] |
RMSE Score [1] |
Seasonal Cycle Score [1] |
Spatial Distribution Score [1] |
Interannual Variability Score [1] |
Overall Score [1] |
|||
|---|---|---|---|---|---|---|---|---|---|---|---|---|---|---|---|---|---|
| Benchmark | [-] | 140. | |||||||||||||||
| CESM2_1 | [-] | 142. | 142. | 138. | 161. | 7.23 | 29.4 | 0.216 | 0.847 | 0.712 | 0.986 | 0.926 | 0.882 | 0.844 | |||
| CRUJRA | [-] | 155. | 155. | 138. | 161. | 18.6 | 26.4 | 0.185 | 0.776 | 0.803 | 0.987 | 0.998 | 0.659 | 0.838 | |||
| GSWP3 | [-] | 135. | 135. | 138. | 161. | 0.0454 | 13.3 | 0.0808 | 0.952 | 0.846 | 0.994 | 0.998 | 0.641 | 0.880 | |||
| PRINCETON | [-] | 136. | 136. | 138. | 161. | 0.392 | 10.0 | 0.167 | 0.927 | 0.900 | 0.988 | 0.992 | 0.893 | 0.933 |
Download Data |
Period Mean (original grids) [Watt m-2] |
Model Period Mean (intersection) [Watt m-2] |
Model Period Mean (complement) [Watt m-2] |
Benchmark Period Mean (intersection) [Watt m-2] |
Benchmark Period Mean (complement) [Watt m-2] |
Bias [Watt m-2] |
RMSE [Watt m-2] |
Phase Shift [months] |
Bias Score [1] |
RMSE Score [1] |
Seasonal Cycle Score [1] |
Spatial Distribution Score [1] |
Interannual Variability Score [1] |
Overall Score [1] |
|||
|---|---|---|---|---|---|---|---|---|---|---|---|---|---|---|---|---|---|
| Benchmark | [-] | 191. | |||||||||||||||
| CESM2_1 | [-] | 189. | 189. | 186. | 193. | 2.17 | 31.4 | 0.618 | 0.747 | 0.581 | 0.939 | 0.970 | 0.814 | 0.772 | |||
| CRUJRA | [-] | 189. | 189. | 186. | 193. | 3.26 | 27.8 | 0.453 | 0.761 | 0.674 | 0.953 | 0.975 | 0.561 | 0.766 | |||
| GSWP3 | [-] | 182. | 182. | 186. | 193. | -4.42 | 14.4 | 0.132 | 0.905 | 0.731 | 0.986 | 0.986 | 0.662 | 0.833 | |||
| PRINCETON | [-] | 182. | 182. | 186. | 193. | -3.89 | 14.5 | 0.254 | 0.848 | 0.784 | 0.974 | 0.985 | 0.871 | 0.874 |
Download Data |
Period Mean (original grids) [Watt m-2] |
Model Period Mean (intersection) [Watt m-2] |
Model Period Mean (complement) [Watt m-2] |
Benchmark Period Mean (intersection) [Watt m-2] |
Benchmark Period Mean (complement) [Watt m-2] |
Bias [Watt m-2] |
RMSE [Watt m-2] |
Phase Shift [months] |
Bias Score [1] |
RMSE Score [1] |
Seasonal Cycle Score [1] |
Spatial Distribution Score [1] |
Interannual Variability Score [1] |
Overall Score [1] |
|||
|---|---|---|---|---|---|---|---|---|---|---|---|---|---|---|---|---|---|
| Benchmark | [-] | 240. | |||||||||||||||
| CESM2_1 | [-] | 261. | 261. | 240. | 243. | 19.8 | 31.1 | 0.667 | 0.692 | 0.683 | 0.944 | 0.992 | 0.870 | 0.810 | |||
| CRUJRA | [-] | 246. | 245. | 240. | 243. | 5.06 | 21.1 | 0.356 | 0.829 | 0.738 | 0.971 | 0.983 | 0.617 | 0.813 | |||
| GSWP3 | [-] | 240. | 240. | 240. | 243. | -0.0588 | 13.2 | 0.119 | 0.940 | 0.795 | 0.991 | 0.999 | 0.617 | 0.856 | |||
| PRINCETON | [-] | 244. | 244. | 240. | 243. | 3.53 | 14.7 | 0.230 | 0.858 | 0.823 | 0.983 | 0.988 | 0.827 | 0.884 |
Download Data |
Period Mean (original grids) [Watt m-2] |
Model Period Mean (intersection) [Watt m-2] |
Model Period Mean (complement) [Watt m-2] |
Benchmark Period Mean (intersection) [Watt m-2] |
Benchmark Period Mean (complement) [Watt m-2] |
Bias [Watt m-2] |
RMSE [Watt m-2] |
Phase Shift [months] |
Bias Score [1] |
RMSE Score [1] |
Seasonal Cycle Score [1] |
Spatial Distribution Score [1] |
Interannual Variability Score [1] |
Overall Score [1] |
|||
|---|---|---|---|---|---|---|---|---|---|---|---|---|---|---|---|---|---|
| Benchmark | [-] | 113. | |||||||||||||||
| CESM2_1 | [-] | 98.7 | 98.6 | 113. | 116. | -14.4 | 34.0 | 0.642 | 0.849 | 0.684 | 0.955 | 0.927 | 0.785 | 0.814 | |||
| CRUJRA | [-] | 117. | 117. | 113. | 116. | 4.01 | 18.4 | 0.0973 | 0.896 | 0.817 | 0.994 | 0.822 | 0.492 | 0.806 | |||
| GSWP3 | [-] | 108. | 108. | 113. | 116. | -5.10 | 12.3 | 0.0429 | 0.936 | 0.846 | 0.997 | 0.848 | 0.716 | 0.865 | |||
| PRINCETON | [-] | 107. | 107. | 113. | 116. | -6.68 | 12.5 | 0.0873 | 0.907 | 0.855 | 0.994 | 0.756 | 0.899 | 0.877 |
Download Data |
Period Mean (original grids) [Watt m-2] |
Model Period Mean (intersection) [Watt m-2] |
Model Period Mean (complement) [Watt m-2] |
Benchmark Period Mean (intersection) [Watt m-2] |
Benchmark Period Mean (complement) [Watt m-2] |
Bias [Watt m-2] |
RMSE [Watt m-2] |
Phase Shift [months] |
Bias Score [1] |
RMSE Score [1] |
Seasonal Cycle Score [1] |
Spatial Distribution Score [1] |
Interannual Variability Score [1] |
Overall Score [1] |
|||
|---|---|---|---|---|---|---|---|---|---|---|---|---|---|---|---|---|---|
| Benchmark | [-] | 229. | |||||||||||||||
| CESM2_1 | [-] | 235. | 235. | 227. | 241. | 8.65 | 32.1 | 0.639 | 0.695 | 0.509 | 0.943 | 0.989 | 0.808 | 0.742 | |||
| CRUJRA | [-] | 223. | 223. | 227. | 241. | -2.95 | 26.9 | 0.814 | 0.666 | 0.623 | 0.920 | 0.681 | 0.588 | 0.684 | |||
| GSWP3 | [-] | 226. | 226. | 227. | 241. | 0.355 | 16.5 | 0.210 | 0.851 | 0.683 | 0.979 | 0.989 | 0.692 | 0.813 | |||
| PRINCETON | [-] | 226. | 227. | 227. | 241. | -0.329 | 14.3 | 0.309 | 0.804 | 0.769 | 0.971 | 0.977 | 0.886 | 0.863 |
Download Data |
Period Mean (original grids) [Watt m-2] |
Model Period Mean (intersection) [Watt m-2] |
Model Period Mean (complement) [Watt m-2] |
Benchmark Period Mean (intersection) [Watt m-2] |
Benchmark Period Mean (complement) [Watt m-2] |
Bias [Watt m-2] |
RMSE [Watt m-2] |
Phase Shift [months] |
Bias Score [1] |
RMSE Score [1] |
Seasonal Cycle Score [1] |
Spatial Distribution Score [1] |
Interannual Variability Score [1] |
Overall Score [1] |
|||
|---|---|---|---|---|---|---|---|---|---|---|---|---|---|---|---|---|---|
| Benchmark | [-] | 173. | |||||||||||||||
| CESM2_1 | [-] | 189. | 189. | 172. | 207. | 17.7 | 30.6 | 0.285 | 0.754 | 0.676 | 0.981 | 0.999 | 0.932 | 0.836 | |||
| CRUJRA | [-] | 185. | 185. | 172. | 207. | 14.4 | 21.4 | 0.368 | 0.788 | 0.782 | 0.976 | 0.987 | 0.505 | 0.803 | |||
| GSWP3 | [-] | 171. | 171. | 172. | 207. | 0.686 | 13.8 | 0.0926 | 0.964 | 0.804 | 0.994 | 1.00 | 0.633 | 0.866 | |||
| PRINCETON | [-] | 172. | 172. | 172. | 207. | 1.04 | 8.44 | 0.159 | 0.951 | 0.884 | 0.989 | 1.00 | 0.884 | 0.932 |
Download Data |
Period Mean (original grids) [Watt m-2] |
Model Period Mean (intersection) [Watt m-2] |
Model Period Mean (complement) [Watt m-2] |
Benchmark Period Mean (intersection) [Watt m-2] |
Benchmark Period Mean (complement) [Watt m-2] |
Bias [Watt m-2] |
RMSE [Watt m-2] |
Phase Shift [months] |
Bias Score [1] |
RMSE Score [1] |
Seasonal Cycle Score [1] |
Spatial Distribution Score [1] |
Interannual Variability Score [1] |
Overall Score [1] |
|||
|---|---|---|---|---|---|---|---|---|---|---|---|---|---|---|---|---|---|
| Benchmark | [-] | 135. | |||||||||||||||
| CESM2_1 | [-] | 137. | 137. | 135. | 133. | 1.48 | 24.6 | 0.557 | 0.902 | 0.740 | 0.959 | 0.766 | 0.775 | 0.814 | |||
| CRUJRA | [-] | 148. | 148. | 135. | 133. | 13.2 | 20.1 | 0.194 | 0.838 | 0.821 | 0.987 | 0.973 | 0.548 | 0.831 | |||
| GSWP3 | [-] | 135. | 135. | 135. | 133. | 0.0758 | 11.1 | 0.0540 | 0.980 | 0.864 | 0.996 | 1.00 | 0.654 | 0.893 | |||
| PRINCETON | [-] | 136. | 136. | 135. | 133. | 0.535 | 9.66 | 0.0825 | 0.949 | 0.894 | 0.995 | 0.999 | 0.903 | 0.939 |
Download Data |
Period Mean (original grids) [Watt m-2] |
Model Period Mean (intersection) [Watt m-2] |
Model Period Mean (complement) [Watt m-2] |
Benchmark Period Mean (intersection) [Watt m-2] |
Benchmark Period Mean (complement) [Watt m-2] |
Bias [Watt m-2] |
RMSE [Watt m-2] |
Phase Shift [months] |
Bias Score [1] |
RMSE Score [1] |
Seasonal Cycle Score [1] |
Spatial Distribution Score [1] |
Interannual Variability Score [1] |
Overall Score [1] |
|||
|---|---|---|---|---|---|---|---|---|---|---|---|---|---|---|---|---|---|
| Benchmark | [-] | 193. | |||||||||||||||
| CESM2_1 | [-] | 212. | 212. | 193. | 181. | 18.5 | 31.0 | 0.286 | 0.779 | 0.722 | 0.980 | 0.995 | 0.909 | 0.851 | |||
| CRUJRA | [-] | 191. | 191. | 193. | 181. | -1.78 | 16.8 | 0.250 | 0.925 | 0.814 | 0.983 | 0.975 | 0.545 | 0.842 | |||
| GSWP3 | [-] | 193. | 193. | 193. | 181. | -0.0247 | 13.4 | 0.0748 | 0.969 | 0.838 | 0.995 | 1.00 | 0.647 | 0.881 | |||
| PRINCETON | [-] | 198. | 198. | 193. | 181. | 4.93 | 11.6 | 0.126 | 0.926 | 0.877 | 0.992 | 1.00 | 0.893 | 0.927 |
Download Data |
Period Mean (original grids) [Watt m-2] |
Model Period Mean (intersection) [Watt m-2] |
Model Period Mean (complement) [Watt m-2] |
Benchmark Period Mean (intersection) [Watt m-2] |
Benchmark Period Mean (complement) [Watt m-2] |
Bias [Watt m-2] |
RMSE [Watt m-2] |
Phase Shift [months] |
Bias Score [1] |
RMSE Score [1] |
Seasonal Cycle Score [1] |
Spatial Distribution Score [1] |
Interannual Variability Score [1] |
Overall Score [1] |
|||
|---|---|---|---|---|---|---|---|---|---|---|---|---|---|---|---|---|---|
| Benchmark | [-] | 202. | |||||||||||||||
| CESM2_1 | [-] | 214. | 214. | 201. | 241. | 13.0 | 32.4 | 1.36 | 0.498 | 0.284 | 0.817 | 0.975 | 0.840 | 0.616 | |||
| CRUJRA | [-] | 209. | 209. | 201. | 241. | 8.41 | 21.1 | 1.21 | 0.627 | 0.463 | 0.833 | 0.871 | 0.516 | 0.629 | |||
| GSWP3 | [-] | 201. | 201. | 201. | 241. | 0.303 | 15.0 | 0.334 | 0.865 | 0.504 | 0.955 | 0.995 | 0.752 | 0.762 | |||
| PRINCETON | [-] | 198. | 198. | 201. | 241. | -2.24 | 11.4 | 0.606 | 0.761 | 0.647 | 0.923 | 0.996 | 0.894 | 0.811 |
Download Data |
Period Mean (original grids) [Watt m-2] |
Model Period Mean (intersection) [Watt m-2] |
Model Period Mean (complement) [Watt m-2] |
Benchmark Period Mean (intersection) [Watt m-2] |
Benchmark Period Mean (complement) [Watt m-2] |
Bias [Watt m-2] |
RMSE [Watt m-2] |
Phase Shift [months] |
Bias Score [1] |
RMSE Score [1] |
Seasonal Cycle Score [1] |
Spatial Distribution Score [1] |
Interannual Variability Score [1] |
Overall Score [1] |
|||
|---|---|---|---|---|---|---|---|---|---|---|---|---|---|---|---|---|---|
| Benchmark | [-] | 211. | |||||||||||||||
| CESM2_1 | [-] | 223. | 223. | 211. | 216. | 11.0 | 33.8 | 0.862 | 0.703 | 0.445 | 0.906 | 0.990 | 0.869 | 0.726 | |||
| CRUJRA | [-] | 215. | 215. | 211. | 216. | 3.84 | 23.3 | 0.737 | 0.759 | 0.588 | 0.917 | 0.776 | 0.488 | 0.686 | |||
| GSWP3 | [-] | 212. | 212. | 211. | 216. | 0.782 | 17.8 | 0.173 | 0.918 | 0.624 | 0.980 | 0.996 | 0.673 | 0.802 | |||
| PRINCETON | [-] | 211. | 212. | 211. | 216. | 0.353 | 11.2 | 0.274 | 0.872 | 0.770 | 0.968 | 0.999 | 0.883 | 0.877 |
Download Data |
Period Mean (original grids) [Watt m-2] |
Model Period Mean (intersection) [Watt m-2] |
Model Period Mean (complement) [Watt m-2] |
Benchmark Period Mean (intersection) [Watt m-2] |
Benchmark Period Mean (complement) [Watt m-2] |
Bias [Watt m-2] |
RMSE [Watt m-2] |
Phase Shift [months] |
Bias Score [1] |
RMSE Score [1] |
Seasonal Cycle Score [1] |
Spatial Distribution Score [1] |
Interannual Variability Score [1] |
Overall Score [1] |
|||
|---|---|---|---|---|---|---|---|---|---|---|---|---|---|---|---|---|---|
| Benchmark | [-] | 204. | |||||||||||||||
| CESM2_1 | [-] | 219. | 219. | 205. | 190. | 8.29 | 40.3 | 0.951 | 0.707 | 0.586 | 0.886 | 0.980 | 0.800 | 0.757 | |||
| CRUJRA | [-] | 210. | 209. | 205. | 190. | 1.35 | 32.7 | 0.427 | 0.692 | 0.681 | 0.959 | 0.732 | 0.533 | 0.713 | |||
| GSWP3 | [-] | 210. | 208. | 205. | 190. | -0.797 | 19.6 | 0.252 | 0.880 | 0.725 | 0.974 | 0.999 | 0.643 | 0.825 | |||
| PRINCETON | [-] | 210. | 209. | 205. | 190. | -1.11 | 18.3 | 0.372 | 0.839 | 0.772 | 0.961 | 0.996 | 0.840 | 0.863 |
Temporally integrated period mean