Mean State
Download Data |
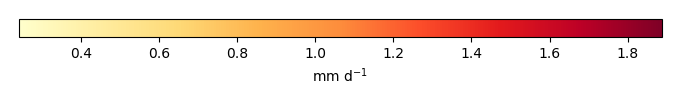
Period Mean (original grids) [mm d-1] |
Model Period Mean (intersection) [mm d-1] |
Model Period Mean (complement) [mm d-1] |
Benchmark Period Mean (intersection) [mm d-1] |
Benchmark Period Mean (complement) [mm d-1] |
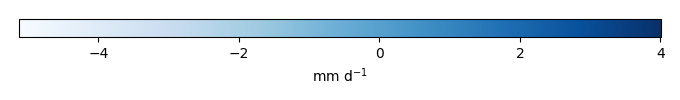
Bias [mm d-1] |
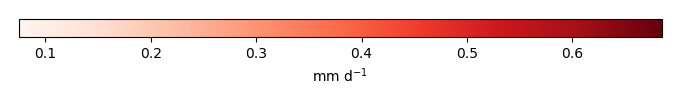
RMSE [mm d-1] |
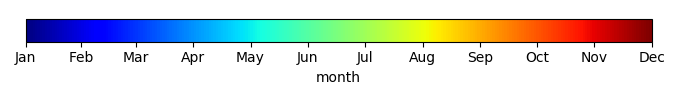
Phase Shift [months] |
Bias Score [1] |
RMSE Score [1] |
Seasonal Cycle Score [1] |
Spatial Distribution Score [1] |
Interannual Variability Score [1] |
Overall Score [1] |
|||
|---|---|---|---|---|---|---|---|---|---|---|---|---|---|---|---|---|---|
| Benchmark | [-] | 2.49 | |||||||||||||||
| CESM2_1 | [-] | 2.58 | 2.62 | 1.92 | 2.49 | 2.68 | 0.128 | 0.869 | 2.68 | 0.539 | 0.317 | 0.575 | 0.973 | 0.640 | 0.560 | ||
| CRUJRA | [-] | 2.49 | 2.53 | 1.72 | 2.49 | 2.68 | 0.0276 | 0.768 | 2.57 | 0.577 | 0.336 | 0.572 | 0.972 | 0.639 | 0.572 | ||
| GSWP3 | [-] | 2.44 | 2.48 | 1.67 | 2.49 | 2.68 | -0.0235 | 0.890 | 3.00 | 0.515 | 0.288 | 0.491 | 0.965 | 0.637 | 0.531 | ||
| PRINCETON | [-] | 2.09 | 2.13 | 1.49 | 2.50 | 2.68 | -0.366 | 0.983 | 3.08 | 0.345 | 0.317 | 0.454 | 0.876 | 0.646 | 0.492 |
Download Data |
Period Mean (original grids) [mm d-1] |
Model Period Mean (intersection) [mm d-1] |
Model Period Mean (complement) [mm d-1] |
Benchmark Period Mean (intersection) [mm d-1] |
Benchmark Period Mean (complement) [mm d-1] |
Bias [mm d-1] |
RMSE [mm d-1] |
Phase Shift [months] |
Bias Score [1] |
RMSE Score [1] |
Seasonal Cycle Score [1] |
Spatial Distribution Score [1] |
Interannual Variability Score [1] |
Overall Score [1] |
|||
|---|---|---|---|---|---|---|---|---|---|---|---|---|---|---|---|---|---|
| Benchmark | [-] | 1.21 | |||||||||||||||
| CESM2_1 | [-] | 1.73 | 1.75 | 0.548 | 1.20 | 2.59 | 0.546 | 1.14 | 1.21 | 0.541 | 0.430 | 0.744 | 0.916 | 0.682 | 0.624 | ||
| CRUJRA | [-] | 1.67 | 1.68 | 0.720 | 1.20 | 2.59 | 0.471 | 1.12 | 1.20 | 0.555 | 0.429 | 0.747 | 0.830 | 0.692 | 0.614 | ||
| GSWP3 | [-] | 1.63 | 1.64 | 0.724 | 1.20 | 2.59 | 0.430 | 1.12 | 1.44 | 0.562 | 0.415 | 0.692 | 0.806 | 0.711 | 0.600 | ||
| PRINCETON | [-] | 1.58 | 1.59 | 0.638 | 1.20 | 2.59 | 0.386 | 1.15 | 1.65 | 0.548 | 0.383 | 0.642 | 0.817 | 0.699 | 0.579 |
Download Data |
Period Mean (original grids) [mm d-1] |
Model Period Mean (intersection) [mm d-1] |
Model Period Mean (complement) [mm d-1] |
Benchmark Period Mean (intersection) [mm d-1] |
Benchmark Period Mean (complement) [mm d-1] |
Bias [mm d-1] |
RMSE [mm d-1] |
Phase Shift [months] |
Bias Score [1] |
RMSE Score [1] |
Seasonal Cycle Score [1] |
Spatial Distribution Score [1] |
Interannual Variability Score [1] |
Overall Score [1] |
|||
|---|---|---|---|---|---|---|---|---|---|---|---|---|---|---|---|---|---|
| Benchmark | [-] | 1.67 | |||||||||||||||
| CESM2_1 | [-] | 2.06 | 2.05 | 1.99 | 1.67 | 2.05 | 0.391 | 1.07 | 1.42 | 0.592 | 0.444 | 0.812 | 0.935 | 0.662 | 0.648 | ||
| CRUJRA | [-] | 1.83 | 1.83 | 1.82 | 1.67 | 2.05 | 0.168 | 0.912 | 1.53 | 0.645 | 0.453 | 0.792 | 0.963 | 0.664 | 0.662 | ||
| GSWP3 | [-] | 1.71 | 1.71 | 1.73 | 1.67 | 2.05 | 0.0510 | 0.956 | 1.76 | 0.629 | 0.435 | 0.732 | 0.903 | 0.664 | 0.633 | ||
| PRINCETON | [-] | 1.76 | 1.76 | 1.78 | 1.69 | 2.06 | 0.0771 | 0.978 | 1.93 | 0.640 | 0.413 | 0.666 | 0.950 | 0.662 | 0.624 |
Download Data |
Period Mean (original grids) [mm d-1] |
Model Period Mean (intersection) [mm d-1] |
Model Period Mean (complement) [mm d-1] |
Benchmark Period Mean (intersection) [mm d-1] |
Benchmark Period Mean (complement) [mm d-1] |
Bias [mm d-1] |
RMSE [mm d-1] |
Phase Shift [months] |
Bias Score [1] |
RMSE Score [1] |
Seasonal Cycle Score [1] |
Spatial Distribution Score [1] |
Interannual Variability Score [1] |
Overall Score [1] |
|||
|---|---|---|---|---|---|---|---|---|---|---|---|---|---|---|---|---|---|
| Benchmark | [-] | 0.851 | |||||||||||||||
| CESM2_1 | [-] | 0.514 | 0.524 | 0.392 | 0.851 | 1.06 | -0.332 | 0.540 | 0.319 | 0.672 | 0.607 | 0.980 | 0.955 | 0.654 | 0.746 | ||
| CRUJRA | [-] | 0.584 | 0.590 | 0.507 | 0.851 | 1.06 | -0.266 | 0.478 | 0.320 | 0.721 | 0.626 | 0.981 | 0.975 | 0.656 | 0.764 | ||
| GSWP3 | [-] | 0.554 | 0.566 | 0.397 | 0.851 | 1.06 | -0.294 | 0.568 | 0.387 | 0.696 | 0.582 | 0.976 | 0.971 | 0.691 | 0.750 | ||
| PRINCETON | [-] | 0.534 | 0.543 | 0.421 | 0.851 | 1.06 | -0.313 | 0.483 | 0.256 | 0.679 | 0.649 | 0.985 | 0.960 | 0.706 | 0.772 |
Download Data |
Period Mean (original grids) [mm d-1] |
Model Period Mean (intersection) [mm d-1] |
Model Period Mean (complement) [mm d-1] |
Benchmark Period Mean (intersection) [mm d-1] |
Benchmark Period Mean (complement) [mm d-1] |
Bias [mm d-1] |
RMSE [mm d-1] |
Phase Shift [months] |
Bias Score [1] |
RMSE Score [1] |
Seasonal Cycle Score [1] |
Spatial Distribution Score [1] |
Interannual Variability Score [1] |
Overall Score [1] |
|||
|---|---|---|---|---|---|---|---|---|---|---|---|---|---|---|---|---|---|
| Benchmark | [-] | 3.76 | |||||||||||||||
| CESM2_1 | [-] | 3.31 | 3.27 | 3.51 | 3.75 | 3.91 | -0.426 | 0.718 | 2.68 | 0.361 | 0.267 | 0.554 | 0.986 | 0.787 | 0.537 | ||
| CRUJRA | [-] | 3.44 | 3.44 | 3.46 | 3.75 | 3.91 | -0.315 | 0.759 | 2.80 | 0.353 | 0.251 | 0.542 | 0.892 | 0.734 | 0.504 | ||
| GSWP3 | [-] | 3.32 | 3.29 | 3.45 | 3.75 | 3.91 | -0.429 | 0.698 | 2.70 | 0.341 | 0.300 | 0.559 | 0.995 | 0.719 | 0.536 | ||
| PRINCETON | [-] | 2.86 | 2.78 | 3.19 | 3.75 | 3.91 | -0.878 | 1.07 | 2.84 | 0.140 | 0.322 | 0.515 | 0.710 | 0.715 | 0.454 |
Download Data |
Period Mean (original grids) [mm d-1] |
Model Period Mean (intersection) [mm d-1] |
Model Period Mean (complement) [mm d-1] |
Benchmark Period Mean (intersection) [mm d-1] |
Benchmark Period Mean (complement) [mm d-1] |
Bias [mm d-1] |
RMSE [mm d-1] |
Phase Shift [months] |
Bias Score [1] |
RMSE Score [1] |
Seasonal Cycle Score [1] |
Spatial Distribution Score [1] |
Interannual Variability Score [1] |
Overall Score [1] |
|||
|---|---|---|---|---|---|---|---|---|---|---|---|---|---|---|---|---|---|
| Benchmark | [-] | 1.12 | |||||||||||||||
| CESM2_1 | [-] | 1.01 | 1.00 | 1.07 | 1.12 | 1.40 | -0.112 | 0.418 | 0.229 | 0.867 | 0.684 | 0.984 | 0.928 | 0.662 | 0.802 | ||
| CRUJRA | [-] | 0.966 | 0.964 | 1.00 | 1.12 | 1.40 | -0.152 | 0.392 | 0.299 | 0.850 | 0.712 | 0.980 | 0.989 | 0.821 | 0.844 | ||
| GSWP3 | [-] | 0.893 | 0.891 | 0.879 | 1.12 | 1.40 | -0.225 | 0.484 | 0.464 | 0.795 | 0.673 | 0.968 | 0.935 | 0.775 | 0.803 | ||
| PRINCETON | [-] | 0.842 | 0.839 | 0.855 | 1.12 | 1.39 | -0.275 | 0.448 | 0.195 | 0.758 | 0.715 | 0.985 | 0.983 | 0.765 | 0.820 |
Download Data |
Period Mean (original grids) [mm d-1] |
Model Period Mean (intersection) [mm d-1] |
Model Period Mean (complement) [mm d-1] |
Benchmark Period Mean (intersection) [mm d-1] |
Benchmark Period Mean (complement) [mm d-1] |
Bias [mm d-1] |
RMSE [mm d-1] |
Phase Shift [months] |
Bias Score [1] |
RMSE Score [1] |
Seasonal Cycle Score [1] |
Spatial Distribution Score [1] |
Interannual Variability Score [1] |
Overall Score [1] |
|||
|---|---|---|---|---|---|---|---|---|---|---|---|---|---|---|---|---|---|
| Benchmark | [-] | 1.17 | |||||||||||||||
| CESM2_1 | [-] | 1.16 | 1.24 | 0.774 | 1.17 | 1.94 | 0.0789 | 0.781 | 1.37 | 0.667 | 0.438 | 0.888 | 0.948 | 0.695 | 0.679 | ||
| CRUJRA | [-] | 1.01 | 1.11 | 0.556 | 1.17 | 1.94 | -0.0449 | 0.689 | 1.40 | 0.710 | 0.464 | 0.885 | 0.964 | 0.697 | 0.697 | ||
| GSWP3 | [-] | 0.920 | 1.03 | 0.430 | 1.17 | 1.94 | -0.133 | 0.724 | 1.44 | 0.652 | 0.451 | 0.878 | 0.897 | 0.727 | 0.676 | ||
| PRINCETON | [-] | 0.908 | 1.00 | 0.475 | 1.17 | 1.94 | -0.154 | 0.737 | 1.49 | 0.651 | 0.445 | 0.872 | 0.892 | 0.702 | 0.668 |
Download Data |
Period Mean (original grids) [mm d-1] |
Model Period Mean (intersection) [mm d-1] |
Model Period Mean (complement) [mm d-1] |
Benchmark Period Mean (intersection) [mm d-1] |
Benchmark Period Mean (complement) [mm d-1] |
Bias [mm d-1] |
RMSE [mm d-1] |
Phase Shift [months] |
Bias Score [1] |
RMSE Score [1] |
Seasonal Cycle Score [1] |
Spatial Distribution Score [1] |
Interannual Variability Score [1] |
Overall Score [1] |
|||
|---|---|---|---|---|---|---|---|---|---|---|---|---|---|---|---|---|---|
| Benchmark | [-] | 2.11 | |||||||||||||||
| CESM2_1 | [-] | 1.99 | 2.03 | 1.58 | 2.11 | 3.39 | -0.00242 | 1.04 | 2.10 | 0.516 | 0.346 | 0.672 | 0.889 | 0.700 | 0.578 | ||
| CRUJRA | [-] | 2.14 | 2.21 | 1.56 | 2.11 | 3.39 | 0.162 | 1.02 | 2.09 | 0.520 | 0.365 | 0.670 | 0.831 | 0.730 | 0.580 | ||
| GSWP3 | [-] | 2.00 | 2.05 | 1.52 | 2.11 | 3.39 | 0.00984 | 1.08 | 2.34 | 0.487 | 0.348 | 0.619 | 0.836 | 0.732 | 0.562 | ||
| PRINCETON | [-] | 1.95 | 2.01 | 1.47 | 2.10 | 3.39 | -0.0334 | 1.10 | 2.49 | 0.481 | 0.339 | 0.580 | 0.808 | 0.764 | 0.552 |
Download Data |
Period Mean (original grids) [mm d-1] |
Model Period Mean (intersection) [mm d-1] |
Model Period Mean (complement) [mm d-1] |
Benchmark Period Mean (intersection) [mm d-1] |
Benchmark Period Mean (complement) [mm d-1] |
Bias [mm d-1] |
RMSE [mm d-1] |
Phase Shift [months] |
Bias Score [1] |
RMSE Score [1] |
Seasonal Cycle Score [1] |
Spatial Distribution Score [1] |
Interannual Variability Score [1] |
Overall Score [1] |
|||
|---|---|---|---|---|---|---|---|---|---|---|---|---|---|---|---|---|---|
| Benchmark | [-] | 0.785 | |||||||||||||||
| CESM2_1 | [-] | 0.434 | 0.464 | 0.220 | 0.785 | 0.741 | -0.323 | 0.557 | 0.410 | 0.668 | 0.567 | 0.972 | 0.920 | 0.558 | 0.708 | ||
| CRUJRA | [-] | 0.674 | 0.695 | 0.509 | 0.785 | 0.741 | -0.0915 | 0.415 | 0.419 | 0.861 | 0.612 | 0.973 | 0.994 | 0.617 | 0.778 | ||
| GSWP3 | [-] | 0.605 | 0.641 | 0.325 | 0.785 | 0.741 | -0.148 | 0.554 | 0.410 | 0.817 | 0.521 | 0.974 | 0.972 | 0.557 | 0.727 | ||
| PRINCETON | [-] | 0.526 | 0.549 | 0.344 | 0.786 | 0.740 | -0.240 | 0.403 | 0.285 | 0.736 | 0.673 | 0.983 | 0.973 | 0.736 | 0.796 |
Download Data |
Period Mean (original grids) [mm d-1] |
Model Period Mean (intersection) [mm d-1] |
Model Period Mean (complement) [mm d-1] |
Benchmark Period Mean (intersection) [mm d-1] |
Benchmark Period Mean (complement) [mm d-1] |
Bias [mm d-1] |
RMSE [mm d-1] |
Phase Shift [months] |
Bias Score [1] |
RMSE Score [1] |
Seasonal Cycle Score [1] |
Spatial Distribution Score [1] |
Interannual Variability Score [1] |
Overall Score [1] |
|||
|---|---|---|---|---|---|---|---|---|---|---|---|---|---|---|---|---|---|
| Benchmark | [-] | 0.787 | |||||||||||||||
| CESM2_1 | [-] | 1.25 | 1.22 | 1.80 | 0.779 | 2.20 | 0.478 | 0.909 | 2.29 | 0.520 | 0.359 | 0.831 | 0.878 | 0.559 | 0.584 | ||
| CRUJRA | [-] | 1.18 | 1.14 | 1.90 | 0.779 | 2.20 | 0.402 | 0.753 | 2.12 | 0.522 | 0.399 | 0.824 | 0.950 | 0.605 | 0.617 | ||
| GSWP3 | [-] | 1.17 | 1.13 | 1.98 | 0.779 | 2.20 | 0.397 | 0.734 | 2.16 | 0.534 | 0.408 | 0.809 | 0.949 | 0.604 | 0.619 | ||
| PRINCETON | [-] | 1.09 | 1.05 | 1.83 | 0.784 | 2.20 | 0.311 | 0.697 | 2.13 | 0.576 | 0.387 | 0.808 | 0.950 | 0.639 | 0.624 |
Download Data |
Period Mean (original grids) [mm d-1] |
Model Period Mean (intersection) [mm d-1] |
Model Period Mean (complement) [mm d-1] |
Benchmark Period Mean (intersection) [mm d-1] |
Benchmark Period Mean (complement) [mm d-1] |
Bias [mm d-1] |
RMSE [mm d-1] |
Phase Shift [months] |
Bias Score [1] |
RMSE Score [1] |
Seasonal Cycle Score [1] |
Spatial Distribution Score [1] |
Interannual Variability Score [1] |
Overall Score [1] |
|||
|---|---|---|---|---|---|---|---|---|---|---|---|---|---|---|---|---|---|
| Benchmark | [-] | 1.32 | |||||||||||||||
| CESM2_1 | [-] | 1.23 | 1.24 | 1.18 | 1.31 | 1.43 | -0.0736 | 0.531 | 0.425 | 0.795 | 0.579 | 0.972 | 0.988 | 0.653 | 0.761 | ||
| CRUJRA | [-] | 1.29 | 1.29 | 1.32 | 1.31 | 1.43 | -0.0157 | 0.482 | 0.333 | 0.827 | 0.607 | 0.978 | 0.967 | 0.655 | 0.773 | ||
| GSWP3 | [-] | 1.18 | 1.18 | 1.16 | 1.31 | 1.43 | -0.131 | 0.519 | 0.311 | 0.764 | 0.613 | 0.979 | 0.988 | 0.735 | 0.782 | ||
| PRINCETON | [-] | 1.14 | 1.14 | 1.20 | 1.31 | 1.43 | -0.165 | 0.496 | 0.345 | 0.739 | 0.635 | 0.978 | 0.989 | 0.697 | 0.778 |
Download Data |
Period Mean (original grids) [mm d-1] |
Model Period Mean (intersection) [mm d-1] |
Model Period Mean (complement) [mm d-1] |
Benchmark Period Mean (intersection) [mm d-1] |
Benchmark Period Mean (complement) [mm d-1] |
Bias [mm d-1] |
RMSE [mm d-1] |
Phase Shift [months] |
Bias Score [1] |
RMSE Score [1] |
Seasonal Cycle Score [1] |
Spatial Distribution Score [1] |
Interannual Variability Score [1] |
Overall Score [1] |
|||
|---|---|---|---|---|---|---|---|---|---|---|---|---|---|---|---|---|---|
| Benchmark | [-] | 1.56 | |||||||||||||||
| CESM2_1 | [-] | 1.28 | 1.60 | 0.398 | 1.56 | 2.67 | 0.0642 | 0.797 | 1.42 | 0.588 | 0.407 | 0.781 | 0.969 | 0.672 | 0.637 | ||
| CRUJRA | [-] | 1.13 | 1.56 | -0.0406 | 1.56 | 2.67 | 0.0226 | 0.731 | 1.47 | 0.586 | 0.429 | 0.740 | 0.971 | 0.695 | 0.642 | ||
| GSWP3 | [-] | 1.18 | 1.50 | 0.307 | 1.56 | 2.67 | -0.0377 | 0.767 | 1.44 | 0.561 | 0.425 | 0.773 | 0.964 | 0.703 | 0.642 | ||
| PRINCETON | [-] | 1.11 | 1.39 | 0.364 | 1.56 | 2.67 | -0.143 | 0.803 | 1.49 | 0.498 | 0.433 | 0.748 | 0.932 | 0.701 | 0.624 |
Download Data |
Period Mean (original grids) [mm d-1] |
Model Period Mean (intersection) [mm d-1] |
Model Period Mean (complement) [mm d-1] |
Benchmark Period Mean (intersection) [mm d-1] |
Benchmark Period Mean (complement) [mm d-1] |
Bias [mm d-1] |
RMSE [mm d-1] |
Phase Shift [months] |
Bias Score [1] |
RMSE Score [1] |
Seasonal Cycle Score [1] |
Spatial Distribution Score [1] |
Interannual Variability Score [1] |
Overall Score [1] |
|||
|---|---|---|---|---|---|---|---|---|---|---|---|---|---|---|---|---|---|
| Benchmark | [-] | 0.603 | |||||||||||||||
| CESM2_1 | [-] | 0.352 | 0.842 | 0.233 | 0.603 | 0.429 | 0.242 | 0.860 | 2.36 | 0.482 | 0.162 | 0.751 | 0.945 | 0.503 | 0.501 | ||
| CRUJRA | [-] | 0.332 | 0.849 | 0.205 | 0.603 | 0.429 | 0.254 | 0.802 | 2.16 | 0.497 | 0.186 | 0.773 | 0.943 | 0.468 | 0.509 | ||
| GSWP3 | [-] | 0.296 | 0.809 | 0.171 | 0.603 | 0.429 | 0.215 | 0.783 | 1.94 | 0.507 | 0.201 | 0.798 | 0.942 | 0.538 | 0.531 | ||
| PRINCETON | [-] | 0.291 | 0.810 | 0.164 | 0.601 | 0.430 | 0.215 | 0.813 | 2.10 | 0.510 | 0.178 | 0.779 | 0.938 | 0.461 | 0.507 |
Download Data |
Period Mean (original grids) [mm d-1] |
Model Period Mean (intersection) [mm d-1] |
Model Period Mean (complement) [mm d-1] |
Benchmark Period Mean (intersection) [mm d-1] |
Benchmark Period Mean (complement) [mm d-1] |
Bias [mm d-1] |
RMSE [mm d-1] |
Phase Shift [months] |
Bias Score [1] |
RMSE Score [1] |
Seasonal Cycle Score [1] |
Spatial Distribution Score [1] |
Interannual Variability Score [1] |
Overall Score [1] |
|||
|---|---|---|---|---|---|---|---|---|---|---|---|---|---|---|---|---|---|
| Benchmark | [-] | 0.876 | |||||||||||||||
| CESM2_1 | [-] | 0.527 | 0.633 | 0.260 | 0.875 | 1.04 | -0.246 | 0.502 | 0.758 | 0.710 | 0.575 | 0.941 | 0.952 | 0.621 | 0.729 | ||
| CRUJRA | [-] | 0.596 | 0.687 | 0.362 | 0.875 | 1.04 | -0.188 | 0.468 | 0.540 | 0.763 | 0.587 | 0.965 | 0.922 | 0.603 | 0.738 | ||
| GSWP3 | [-] | 0.557 | 0.660 | 0.293 | 0.875 | 1.04 | -0.221 | 0.562 | 0.568 | 0.725 | 0.532 | 0.963 | 0.946 | 0.609 | 0.718 | ||
| PRINCETON | [-] | 0.491 | 0.561 | 0.314 | 0.878 | 1.05 | -0.317 | 0.484 | 0.492 | 0.654 | 0.632 | 0.969 | 0.983 | 0.771 | 0.773 |
Download Data |
Period Mean (original grids) [mm d-1] |
Model Period Mean (intersection) [mm d-1] |
Model Period Mean (complement) [mm d-1] |
Benchmark Period Mean (intersection) [mm d-1] |
Benchmark Period Mean (complement) [mm d-1] |
Bias [mm d-1] |
RMSE [mm d-1] |
Phase Shift [months] |
Bias Score [1] |
RMSE Score [1] |
Seasonal Cycle Score [1] |
Spatial Distribution Score [1] |
Interannual Variability Score [1] |
Overall Score [1] |
|||
|---|---|---|---|---|---|---|---|---|---|---|---|---|---|---|---|---|---|
| Benchmark | [-] | 2.12 | |||||||||||||||
| CESM2_1 | [-] | 2.10 | 2.13 | 1.98 | 2.12 | 2.78 | 0.0662 | 1.03 | 2.38 | 0.445 | 0.305 | 0.606 | 0.862 | 0.554 | 0.513 | ||
| CRUJRA | [-] | 1.92 | 1.90 | 2.06 | 2.12 | 2.78 | -0.116 | 0.732 | 1.62 | 0.525 | 0.352 | 0.724 | 0.954 | 0.738 | 0.608 | ||
| GSWP3 | [-] | 1.97 | 1.96 | 2.11 | 2.12 | 2.78 | -0.0638 | 0.754 | 1.51 | 0.515 | 0.363 | 0.765 | 0.947 | 0.698 | 0.608 | ||
| PRINCETON | [-] | 1.81 | 1.79 | 2.01 | 2.12 | 2.79 | -0.228 | 0.768 | 1.54 | 0.466 | 0.365 | 0.737 | 0.926 | 0.743 | 0.600 |
Download Data |
Period Mean (original grids) [mm d-1] |
Model Period Mean (intersection) [mm d-1] |
Model Period Mean (complement) [mm d-1] |
Benchmark Period Mean (intersection) [mm d-1] |
Benchmark Period Mean (complement) [mm d-1] |
Bias [mm d-1] |
RMSE [mm d-1] |
Phase Shift [months] |
Bias Score [1] |
RMSE Score [1] |
Seasonal Cycle Score [1] |
Spatial Distribution Score [1] |
Interannual Variability Score [1] |
Overall Score [1] |
|||
|---|---|---|---|---|---|---|---|---|---|---|---|---|---|---|---|---|---|
| Benchmark | [-] | 1.88 | |||||||||||||||
| CESM2_1 | [-] | 1.79 | 1.78 | 2.12 | 1.88 | 2.11 | -0.0774 | 0.633 | 0.669 | 0.836 | 0.609 | 0.944 | 0.995 | 0.739 | 0.789 | ||
| CRUJRA | [-] | 1.75 | 1.75 | 1.89 | 1.88 | 2.11 | -0.108 | 0.590 | 0.620 | 0.810 | 0.642 | 0.950 | 0.897 | 0.798 | 0.790 | ||
| GSWP3 | [-] | 1.75 | 1.75 | 1.87 | 1.88 | 2.11 | -0.108 | 0.611 | 0.524 | 0.804 | 0.638 | 0.952 | 0.938 | 0.771 | 0.790 | ||
| PRINCETON | [-] | 1.62 | 1.62 | 1.81 | 1.88 | 2.10 | -0.238 | 0.657 | 0.514 | 0.755 | 0.625 | 0.953 | 0.912 | 0.791 | 0.777 |
Download Data |
Period Mean (original grids) [mm d-1] |
Model Period Mean (intersection) [mm d-1] |
Model Period Mean (complement) [mm d-1] |
Benchmark Period Mean (intersection) [mm d-1] |
Benchmark Period Mean (complement) [mm d-1] |
Bias [mm d-1] |
RMSE [mm d-1] |
Phase Shift [months] |
Bias Score [1] |
RMSE Score [1] |
Seasonal Cycle Score [1] |
Spatial Distribution Score [1] |
Interannual Variability Score [1] |
Overall Score [1] |
|||
|---|---|---|---|---|---|---|---|---|---|---|---|---|---|---|---|---|---|
| Benchmark | [-] | 1.14 | |||||||||||||||
| CESM2_1 | [-] | 1.13 | 1.13 | 1.34 | 1.14 | 1.29 | -0.00590 | 0.504 | 0.294 | 0.825 | 0.595 | 0.980 | 0.990 | 0.643 | 0.771 | ||
| CRUJRA | [-] | 1.09 | 1.08 | 1.27 | 1.14 | 1.29 | -0.0513 | 0.450 | 0.147 | 0.855 | 0.633 | 0.990 | 0.923 | 0.752 | 0.798 | ||
| GSWP3 | [-] | 1.06 | 1.06 | 1.14 | 1.14 | 1.29 | -0.0781 | 0.529 | 0.180 | 0.821 | 0.590 | 0.989 | 0.985 | 0.721 | 0.783 | ||
| PRINCETON | [-] | 0.939 | 0.932 | 1.11 | 1.13 | 1.29 | -0.198 | 0.475 | 0.169 | 0.787 | 0.640 | 0.988 | 0.945 | 0.741 | 0.790 |
Download Data |
Period Mean (original grids) [mm d-1] |
Model Period Mean (intersection) [mm d-1] |
Model Period Mean (complement) [mm d-1] |
Benchmark Period Mean (intersection) [mm d-1] |
Benchmark Period Mean (complement) [mm d-1] |
Bias [mm d-1] |
RMSE [mm d-1] |
Phase Shift [months] |
Bias Score [1] |
RMSE Score [1] |
Seasonal Cycle Score [1] |
Spatial Distribution Score [1] |
Interannual Variability Score [1] |
Overall Score [1] |
|||
|---|---|---|---|---|---|---|---|---|---|---|---|---|---|---|---|---|---|
| Benchmark | [-] | 0.787 | |||||||||||||||
| CESM2_1 | [-] | 1.01 | 1.02 | 0.985 | 0.786 | 1.92 | 0.236 | 0.790 | 1.97 | 0.527 | 0.223 | 0.789 | 0.793 | 0.725 | 0.547 | ||
| CRUJRA | [-] | 0.860 | 0.873 | 0.919 | 0.786 | 1.92 | 0.0946 | 0.681 | 1.94 | 0.591 | 0.262 | 0.790 | 0.938 | 0.663 | 0.584 | ||
| GSWP3 | [-] | 0.857 | 0.873 | 0.880 | 0.786 | 1.92 | 0.0951 | 0.725 | 1.76 | 0.558 | 0.246 | 0.809 | 0.954 | 0.660 | 0.579 | ||
| PRINCETON | [-] | 0.852 | 0.863 | 0.922 | 0.786 | 1.92 | 0.0831 | 0.699 | 1.75 | 0.606 | 0.250 | 0.814 | 0.929 | 0.604 | 0.576 |
Download Data |
Period Mean (original grids) [mm d-1] |
Model Period Mean (intersection) [mm d-1] |
Model Period Mean (complement) [mm d-1] |
Benchmark Period Mean (intersection) [mm d-1] |
Benchmark Period Mean (complement) [mm d-1] |
Bias [mm d-1] |
RMSE [mm d-1] |
Phase Shift [months] |
Bias Score [1] |
RMSE Score [1] |
Seasonal Cycle Score [1] |
Spatial Distribution Score [1] |
Interannual Variability Score [1] |
Overall Score [1] |
|||
|---|---|---|---|---|---|---|---|---|---|---|---|---|---|---|---|---|---|
| Benchmark | [-] | 3.61 | |||||||||||||||
| CESM2_1 | [-] | 3.29 | 3.29 | 2.91 | 3.61 | 3.16 | -0.329 | 0.824 | 2.19 | 0.474 | 0.264 | 0.665 | 0.991 | 0.686 | 0.557 | ||
| CRUJRA | [-] | 3.20 | 3.20 | 3.07 | 3.61 | 3.16 | -0.413 | 0.839 | 3.35 | 0.373 | 0.287 | 0.438 | 0.903 | 0.702 | 0.498 | ||
| GSWP3 | [-] | 3.15 | 3.15 | 2.97 | 3.61 | 3.16 | -0.464 | 0.827 | 1.99 | 0.347 | 0.333 | 0.726 | 0.898 | 0.730 | 0.561 | ||
| PRINCETON | [-] | 2.64 | 2.63 | 2.88 | 3.61 | 3.16 | -0.977 | 1.23 | 2.23 | 0.164 | 0.350 | 0.680 | 0.766 | 0.688 | 0.500 |
Download Data |
Period Mean (original grids) [mm d-1] |
Model Period Mean (intersection) [mm d-1] |
Model Period Mean (complement) [mm d-1] |
Benchmark Period Mean (intersection) [mm d-1] |
Benchmark Period Mean (complement) [mm d-1] |
Bias [mm d-1] |
RMSE [mm d-1] |
Phase Shift [months] |
Bias Score [1] |
RMSE Score [1] |
Seasonal Cycle Score [1] |
Spatial Distribution Score [1] |
Interannual Variability Score [1] |
Overall Score [1] |
|||
|---|---|---|---|---|---|---|---|---|---|---|---|---|---|---|---|---|---|
| Benchmark | [-] | 1.96 | |||||||||||||||
| CESM2_1 | [-] | 2.12 | 2.12 | 2.29 | 1.96 | 2.09 | 0.160 | 1.06 | 1.42 | 0.576 | 0.430 | 0.834 | 0.759 | 0.709 | 0.623 | ||
| CRUJRA | [-] | 2.32 | 2.30 | 2.45 | 1.96 | 2.09 | 0.346 | 1.14 | 1.71 | 0.518 | 0.449 | 0.768 | 0.902 | 0.698 | 0.630 | ||
| GSWP3 | [-] | 2.22 | 2.21 | 2.47 | 1.96 | 2.09 | 0.253 | 1.13 | 1.69 | 0.540 | 0.444 | 0.767 | 0.792 | 0.739 | 0.621 | ||
| PRINCETON | [-] | 2.21 | 2.19 | 2.45 | 1.96 | 2.09 | 0.240 | 1.18 | 1.86 | 0.536 | 0.415 | 0.748 | 0.841 | 0.713 | 0.611 |
Download Data |
Period Mean (original grids) [mm d-1] |
Model Period Mean (intersection) [mm d-1] |
Model Period Mean (complement) [mm d-1] |
Benchmark Period Mean (intersection) [mm d-1] |
Benchmark Period Mean (complement) [mm d-1] |
Bias [mm d-1] |
RMSE [mm d-1] |
Phase Shift [months] |
Bias Score [1] |
RMSE Score [1] |
Seasonal Cycle Score [1] |
Spatial Distribution Score [1] |
Interannual Variability Score [1] |
Overall Score [1] |
|||
|---|---|---|---|---|---|---|---|---|---|---|---|---|---|---|---|---|---|
| Benchmark | [-] | 1.17 | |||||||||||||||
| CESM2_1 | [-] | 1.29 | 1.42 | 0.719 | 1.17 | 1.34 | 0.236 | 0.835 | 1.84 | 0.501 | 0.371 | 0.801 | 0.907 | 0.570 | 0.587 | ||
| CRUJRA | [-] | 0.873 | 0.974 | 0.451 | 1.17 | 1.34 | -0.175 | 0.677 | 1.86 | 0.460 | 0.411 | 0.801 | 0.919 | 0.509 | 0.585 | ||
| GSWP3 | [-] | 0.946 | 1.06 | 0.455 | 1.17 | 1.34 | -0.107 | 0.688 | 1.78 | 0.480 | 0.418 | 0.808 | 0.902 | 0.546 | 0.595 | ||
| PRINCETON | [-] | 0.740 | 0.820 | 0.381 | 1.17 | 1.34 | -0.350 | 0.740 | 1.90 | 0.390 | 0.402 | 0.776 | 0.778 | 0.541 | 0.548 |
Temporally integrated period mean